Author: Zaheer Babar

  • Best Performing DCA Playbooks 📊: 3 Real Backtests Across Market Regimes 📈 That Reveal What Really Works 🧪

    Best Performing DCA Playbooks 📊: 3 Real Backtests Across Market Regimes 📈 That Reveal What Really Works 🧪

    So you searched for the best-performing DCA playbooks, and you’re expecting a highlight reel of green numbers.

    Honestly, that’s not what real backtesting gives you. We ran three DCA setups on CryptoGates, each one built for a different market mood: SHIB in a chaotic pump-and-dump, ASTER in a slow bleed, ENA in a fast climb.

    One thing surprised even us. Vanguard‘s long-running research found that lump-sum investing beats DCA about 68% of the time over decades of market data, which sounds like bad news for DCA fans, but that’s not the full picture once you factor in risk.

    Here’s what actually happened when we tested it on real crypto price action.

    EXECUTIVE SUMMARY
    • The Problem: Most “best DCA setup” content only shows winning trades, hiding what happens when the market doesn’t cooperate.
    • The Solution: Three real backtests across different regimes, meme volatility, slow bleed, and a fast breakout, show where DCA actually helps and where it doesn’t.
    • The Incentive: You get a real framework for picking DCA settings based on market condition, not guesswork.
    • The Risk: DCA reduces exposure to bad timing, but it doesn’t guarantee profit, and one of these three playbooks proves it.

    What Makes a DCA Playbook Worth Testing

    A real DCA playbook isn’t a screenshot of a green number.

    It’s a strategy tied to specific parameters, tested against real price data, in a market condition you can actually name.

    Base order size, step percentage, take profit, all of it gets picked to fit a regime, not picked at random and hoped for the best, the way these common DCA mistakes crypto investors make show what happens when it isn’t.That’s the whole point of backtesting before you deploy real capital.

    CEO Note:

    Zaheer says it plainly, a strategy that only gets shown in its best light isn’t proof of anything. If we only published the wins, we’d be doing the same hype thing we built CryptoGates to fight. Test it, show the real number, then decide.

    Why Market Regime Matters More Than the Coin

    Here’s the thing most beginners miss.

    The coin isn’t what makes a DCA setup work or fail; the market regime does. A tight 2% step built for a slow grind gets wrecked in a volatile chop, and a wide step built for volatility feels sluggish in a clean trend.

    That’s why each playbook below uses a different step size, order count, and take profit target, matched to the coin’s actual behavior over the test window, not a copy-paste template.

    HISTORICAL DATA AUDIT

    Battle-Test Your Strategy
    Before the Market Does.

    Eliminate guesswork with institutional-grade backtesting for DCA, Grid, and Rebalance bots. Real historical data. Real-world results.

    EST. OPTIMIZATION +42% ROI Efficiency
    Start Backtest Now

    Sourced from 5+ Years of Exchange Data

    Playbook 1 — The Meme Liquidity Grab (SHIB)

    SHIB was picked for this one on purpose. Meme coins swing hard, and a narrow DCA step gets caught buying every small dip before the real move even starts.

    So this setup used a wider 4.5% step, betting on catching liquidity spikes instead of every minor wobble.

    Swipe to view full data →
    Parameter Setting
    Base / DCA Order 250 / 250 USDT
    DCA Step % 4.5%
    Max DCA Orders 9
    Take Profit % 4%
    Total Invested (across sessions) 10,507.88 USDT
    Result -612.58 USDT (-5.83% ROI), 79.04% max drawdown

    Setup and Market Regime

    The test ran from June 1 to December 31, 2025, on SHIB/USDT, using Binance’s 1-minute OHLCV data through CryptoGates’ DCA Backtest Bot.

    The bot opened 15 sessions, closed 14 of them on take profit, and averaged about 341 hours per session. That’s a lot of cycling, which tells you SHIB kept oscillating instead of trending cleanly in one direction.

    What the Backtest Showed

    Look, this is the one that doesn’t end in a win, and we’re not hiding it.

    The bot closed at -5.83% ROI with a brutal 79.04% max drawdown at one point. But here’s what actually matters for the comparison.

    A plain buy-and-hold on the same SHIB window lost -506.64 USDT on 1,100 USDT invested, a much rougher percentage hit. The DCA version still lost money, ngl, but it lost less than just holding through the same chop.

    That’s not a win. It’s a smaller loss, and in a coin this volatile, that gap is the whole lesson.

    Can DCA lose money in a volatile market?

    Yes. The SHIB playbook above proves it, DCA closed at a loss during a highly volatile stretch. It still outperformed a plain buy-and-hold on the same window, but a loss is a loss.

    Playbook 2 — The Slow-Bleed Accumulation (ASTER)

    ASTER tells a different story. This wasn’t a volatile chop; it was a grinding, steady decline, the kind that wears traders down slowly instead of shocking them all at once.

    The setup used a tighter 3% step and a lower 2.5% take profit, built to lower the average entry price faster while the price kept sliding.

    Swipe to view full data →
    Parameter Setting
    Base / DCA Order 200 / 200 USDT
    DCA Step % 3%
    Max DCA Orders 9
    Take Profit % 2.5%
    Total Invested (across sessions) 3,602.70 USDT
    Result -1,225.11 USDT (-34.01% ROI), 72.03% max drawdown

    Setup and Market Regime

    Same window, June 1 to December 31, 2025, on ASTER/USDT. The bot opened 6 sessions and closed 5 at take profit.

    One session, the last one, stayed open through the entire slow bleed and never hit its target, which is what dragged the whole result down.

    What the Backtest Showed

    Here’s where the picture flips.

    Yes, -34.01% ROI looks rough on its own. But the benchmark tells the real story. A straight buy-and-hold on ASTER over the same period lost -1,329.46 USDT on 2,000 USDT invested, worse in both dollar terms and percentage terms than the DCA result.

    The bot’s cost-averaging genuinely softened the damage here. This is the exact scenario DCA was built for, a slow grind where averaging your entry price actually earns its keep, even when the result still shows red.

    Larry Fink, BlackRock
    “The strategy of DCA rests on lowering the average cost basis, protecting you from the worst timing risk.”

    Larry Fink, BlackRock CEO

    Does DCA work better in a downtrend or an uptrend?

    Based on this test, downtrends. In a slow bleed, DCA cut losses by over 60% compared to buy-and-hold. In the fast uptrend below, the gap between DCA and holding tightens up considerably.

    Playbook 3 — The Parabolic Momentum Capture (ENA)

    ENA was the wildcard here, a coin that spent the second half of the year climbing hard with higher highs stacking up between August and November.

    The setup went tight, a 2% step and a 2% take profit, built to keep buying into strength without waiting for deep pullbacks that might not come.

    Swipe to view full data →
    Parameter Setting
    Base / DCA Order 300 / 300 USDT
    DCA Step % 2%
    Max DCA Orders 9
    Take Profit % 2%
    Total Invested (across sessions) 119,789.78 USDT
    Result -61.64 USDT (-0.05% ROI), 84.78% max drawdown

    Real Backtest Example

    Strategy: DCA
    Coin: ENA/USDT
    Market Condition: Sharp panic-driven crash (Ethena USDe redemption event)
    Objective: Test DCA resilience during a sudden, news-driven capitulation rather than a slow grind

    While our in-article ENA test tracked a fast uptrend, CryptoGates also ran a DCA backtest on ENA during the opposite scenario, a 45% panic crash triggered by a multi-million-dollar USDe redemption. The bot still closed the window up +$898.19, holding its ground while spot holders absorbed the full drop.

    Put side by side with the uptrend result above, ENA becomes an interesting case study on its own: the same coin, tested in two opposite regimes, and DCA held up in both. That’s less about ENA being special and more about what tight-step averaging does when volatility spikes fast instead of grinding slow.

    View Complete Playbook — https://cryptogates.io/playbooks/ena-dca-bot-playbook-surviving-a-45-crash-for-898-profit/

    Setup and Market Regime

    This one ran the same June to December window on ENA/USDT, but the activity level was on a different scale entirely.

    The bot opened 163 sessions and closed 162 of them on take profit, executing 399 orders in total.

    Tight steps mean way more cycles, which is exactly what you’d expect from a fast-moving trend.

    What the Backtest Showed

    The bot landed at -0.05% ROI, basically flat, after 399 executed orders and a 162 out of 163 take-profit hit rate.

    (Source: CryptoGates DCA Backtest Bot, ENAUSDT test run)

    Now compare that to holding. A buy-and-hold on ENA over the identical window lost -691.33 USDT on 2,000 USDT invested, a real dent. The DCA version landed almost exactly at break-even.

    That 162 take-profit hit rate is the real story here, tight-step DCA in a genuine uptrend keeps closing small wins over and over, and those small wins nearly erased what would’ve otherwise been a meaningful loss from bad timing on the entry.

    SYSTEM ACCESS: CG4.2

    Stop Guessing.
    Stress Test Your Edge.

    The market doesn’t care about your backtest. Our engine simulates 1,000+ “what-if” scenarios to ensure your strategy is built for survival.

    Run Crypto Strategy Engine →
    ROBUSTNESS SCORE
    75+ STRUCTURAL EDGE
    RISK OF RUIN < 1%
    TARGET HIT 92%

    DCA vs Buy-and-Hold — What 3 Regimes Actually Prove

    Put all three side by side and the pattern gets obvious fast. DCA didn’t turn any of these into a winning trade. What it did was change how much damage the market did on the way there.

    Swipe to view full data →
    Playbook DCA Result Buy-and-Hold Result Difference
    SHIB (volatile chop) -612.58 USDT -506.64 USDT DCA lost more
    ASTER (slow bleed) -1,225.11 USDT -1,329.46 USDT DCA lost less
    ENA (fast uptrend) -61.64 USDT -691.33 USDTDCA lost far less
    Across these three tests, DCA outperformed a plain buy-and-hold approach in 2 out of 3 market regimes tested.

    (Source: CryptoGates DCA Backtest Bot, three-run comparison, June to December 2025 window)

    Where DCA Underperformed

    SHIB is the outlier, and it’s worth sitting with instead of burying. Wait, doesn’t DCA always smooth out volatility?

    Not always.

    When a coin whips this hard in both directions, even a wide 4.5% step can end up buying into more chop than it should. This is the honest limit of the strategy.

    Extreme, erratic volatility can outpace what step-based averaging is built to handle.

    Research Insight

    The SHIB result above raises a fair question: is meme-coin volatility just too erratic for DCA to handle, period?

    Not necessarily. A separate CryptoGates test ran a DCA bot on PEPE through a 64% drop over 112 days, one of the worst sustained meme-coin bleeds on record, and it still closed +$2,542.73 while spot holders lost $704.79 on the same capital. The difference wasn’t the coin category.

    It was the shape of the decline. SHIB’s chop was fast and directionless; PEPE’s was a longer, steadier bleed, closer to ASTER’s regime than SHIB’s.

    This lines up with the article’s core finding: DCA doesn’t fail because a coin is a meme coin, it struggles specifically when price whips in both directions faster than a step size can adapt.

    View Complete Playbook — https://cryptogates.io/playbooks/pepe-fell-64-in-112-days-our-dca-bot-still-made-2542/

    Where DCA Clearly Won

    ASTER and ENA tell the story CG actually wants people to see. In a grind-down and in a fast uptrend, cost-averaging did its job.

    It didn’t produce a profit in either case; that’s not the promise here, but it meaningfully reduced exposure to bad entry timing. That’s the real alpha of DCA. Not upside. Downside protection.

    Interactive Checklist — Choosing Your Own DCA Regime

    Pre-Trade Strategy Audit

    • Identify the current regime first. Trending, ranging, or chaotic, before picking any parameter.
    • Use a wider step (4%+) only in high-volatility, choppy conditions, and expect it to still lag in extreme cases.
    • Use a tighter step (2-3%) in slow, grinding trends where lowering cost basis matters most.
    • Match your take profit to order frequency. Tight steps with tight TPs cycle fast and compound small wins.
    • Always backtest against a buy-and-hold benchmark on the same window before trusting a setup.

    Look, none of this replaces running your own numbers.

    Every coin, every window, every step size changes the outcome. That’s kind of the whole point of testing before you deploy.

    Research Highlight

    The ASTER result above isn’t a one-off. A separate CryptoGates DCA test on TRX ground through a 105-day slow-bleed stretch, price sliding from $0.2208 down to $0.20 with no clean bounce, and the bot still closed +$888.51, with 27 of 28 sessions finishing in profit. What stands out is the parameter choice: a tighter 1.15x multiplier outperformed wider variants by $192 in this exact regime.

    That’s the same pattern the ASTER playbook points to, in a slow grind, tighter, more frequent averaging beats a wide net waiting for a bounce that may not come. Two different coins, same grinding-down regime, same conclusion: step size matched to market condition matters more than the coin itself.

    View Complete Playbook — https://cryptogates.io/playbooks/trx-dca-bot-backtest-888-profit-in-a-slow-bleed-market/

    The Real Takeaway From These 3 Playbooks

    Three backtests, three different regimes, and only one clean story. DCA isn’t a magic profit machine, and honestly, anyone selling it that way isn’t being straight with you.

    What it did across these tests was cut losses in two out of three regimes, sometimes by a wide margin, and that’s a real, measurable edge even when the final number still shows red.

    If there’s one lesson from SHIB, ASTER, and ENA together, it’s that DCA earns its value in slow bleeds and steady climbs, and it struggles in erratic chop.

    Know which regime you’re in before you pick your parameters. Run your own version on the DCA Backtest Bot and see how your numbers compare to these three.

    FAQs

    Does DCA always outperform buy-and-hold?

    No. Across these three tests, DCA beat buy-and-hold in two out of three regimes. In extreme volatility, it can still underperform.

    Wider steps, generally 4% or more, work better in choppy conditions, though even that doesn’t guarantee a profit in extreme cases.

    It depends on the regime. Tighter steps with more orders suit fast trends, while fewer, wider-spaced orders suit slow, grinding markets.

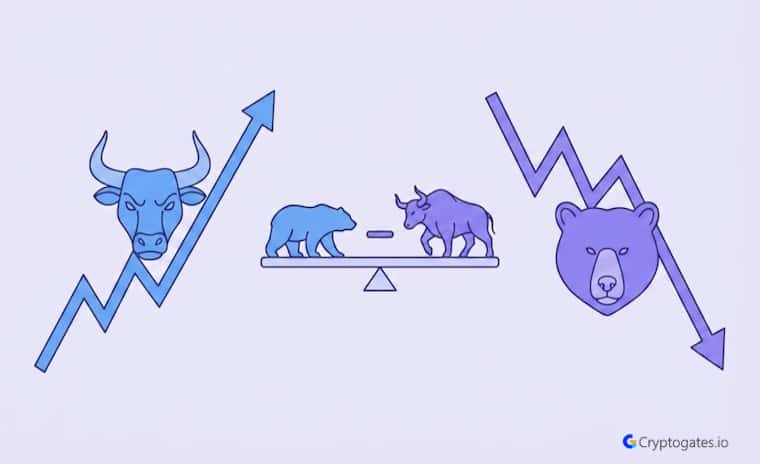
  • Best Grid Trading Strategies 📈 for Bull 🐂, Bear 🐻 & Sideways Markets That Maximize Returns

    Best Grid Trading Strategies 📈 for Bull 🐂, Bear 🐻 & Sideways Markets That Maximize Returns

    Be honest with yourself for a second.

    You’ve probably run the same grid trading strategy on every single asset without ever asking if the market actually matches your settings.

    That’s not your fault, though.

    Most beginners think grid trading is a “set it and forget it” tool:

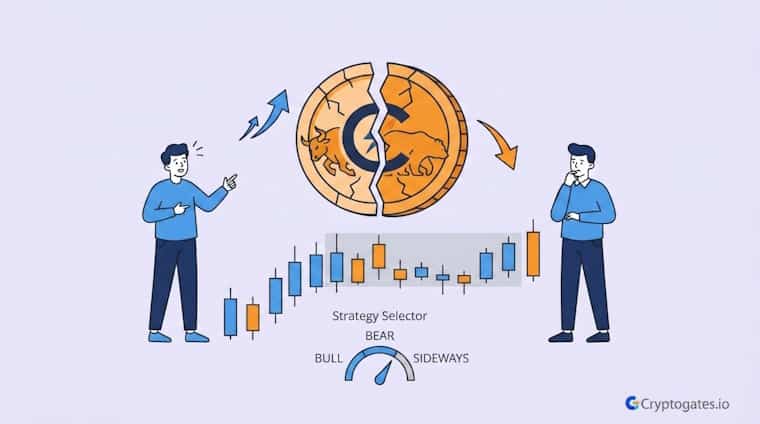
    Plug in a range, walk away, and let the bot print money. Look, it’s not that simple. Grid works differently in a bull run than it does in a bear market chop, and completely differently again during a flat, boring sideways grind.

    Here’s what actually matters:

    Matching your grid to the regime in front of you, not the one you wish were happening.

    Crypto markets spend roughly 70% of their time moving sideways, according to DeepAlpha. That single number is basically the entire reason grid trading exists as a strategy.

    OutrightCRM

    EXECUTIVE SUMMARY
    • The Problem: Traders run one grid setup across bull, bear, and sideways markets, then wonder why it stops working the moment conditions shift.
    • The Solution: Adjust range width, grid density, and capital exposure based on the actual market regime instead of a fixed template.
    • The Incentive: A properly matched grid setup can turn boring, range-bound price action into consistent, fee-adjusted returns.
    • The Risk: A grid built for the wrong regime can trap capital in a falling market or leave profits on the table during a breakout.

    What Is Grid Trading?

    Honestly, grid trading sounds more complicated than it is.

    You set a price range, split it into levels, and place buy orders below the current price and sell orders above it.

    When price swings through those levels, the bot buys low and sells high automatically.

    No predictions. No staring at charts all day.

    Here’s the interesting part, though. Grid trading isn’t trying to guess where the price goes next. It’s built entirely around the idea that price will oscillate, bounce, chop, whatever you want to call it, and that oscillation itself is the profit engine.

    Think of it less like a directional bet and more like range trading on autopilot, tied to buy-low-sell-high logic and automated execution.

    How Grid Orders Work

    Every time price crosses a grid level, one order fills and a new one gets placed opposite it.

    That’s the whole loop. It just keeps repeating as long as price stays inside your range.

    Why Market Conditions Matter in Grid Trading

    Wait, this is the part most beginners skip.

    A grid that prints steady wins in a sideways market can absolutely wreck your capital allocation the moment that same asset starts trending hard.

    Grid trading does not perform equally across every condition, and pretending otherwise is how accounts get cooked.

    Market structure, volatility, and trend strength all decide whether your grid is working with the market or fighting it. A tight range in a strong trend basically means you’re guaranteed to get run over in one direction.

    That’s not bad luck. That’s a mismatch between setup and regime.

    Reading Volatility and Trend Strength

    Range behavior tells you if price is respecting boundaries or breaking them. If support and resistance keep holding, you’re probably fine.

    If price keeps making new highs or lows without returning, the grid is fighting a trend it can’t win.

    Does grid trading work in a bull market?

    It can, but only with wider ranges and lighter grid density. A tight, aggressive grid in a strong uptrend often gets left behind as price runs past the top of the range.

    Best Grid Trading Strategy for Bull Markets

    Bull markets feel like free money until your grid gets left in the dust.

    Ngl,

    This is where a lot of degens get overconfident. Grid can still work here, it’s just gonna need real adjustment instead of the default settings you copied from some YouTube video.

    The smart move is leaning the range upward or widening it so a strong trend doesn’t just blow past your top sell order.

    Watch for breakout risk and trend continuation, because upward drift can strand a tight grid fast.

    Bull Market Grid Setup

    Use wider ranges than you’d normally set.

    Reduce grid density if price is trending hard, since too many tight levels just means more missed fills. Consider geometric spacing if the move is accelerating.

    And honestly,

    Capital preservation should matter more here than stacking aggressive orders.

    Bull Market Risks

    Price can run straight past your grid and stop triggering sells entirely. This thing can rip, and if it rips past your range, your bot just sits there doing nothing useful.

    Overly tight grids underperform because the market simply doesn’t stay in range long enough to matter.

    Best Use Case in Bull Markets

    Mildly bullish, choppy uptrends with real pullbacks work best. Assets that consolidate before continuing higher give the grid something to actually chew on, instead of just watching from the sidelines.

    Mark Douglas,
    “The hard, cold reality of trading is that every trade has an uncertain outcome.”

    Mark Douglas, Trading in the Zone

    Best Grid Trading Strategy for Bear Markets

    Look, bear markets are brutal for grid trading.

    There’s no sugarcoating this one. If the range breaks to the downside, the bot just keeps buying into a falling knife, and that’s exactly the kind of setup that turns into a bagholder situation.

    Downside pressure, drawdown risk, and capital lock-up are the three things you need to respect here.

    This is where CT starts talking about getting rekt, and honestly, most of the time it’s because someone ran a bull-market grid setup during a bear leg.

    Bear Market Grid Setup

    Keep the range defensive.

    Use smaller capital than you would in calmer conditions.

    Prefer spot grid over futures grid here, since leverage in a falling market is a recipe for liquidation.

    Widen your spacing and resist the urge to overtrade every small bounce.

    Bear Market Risks

    Continuous decline can trap capital for a long time. The bot may keep accumulating losing positions as price grinds lower.

    Futures grids get especially dangerous here, because leverage turns a slow bleed into something that can wipe an account fast.

    Common Belief:

    A grid bot losing less than a spot holder during a crash still counts as a “win.”

    What CryptoGates research found: In a backtest covering BNB’s 33% post-ATH collapse (from $1,294 to $864 over 79 days), the grid bot fired 171 trades and generated $163.94 in grid profit — yet total ROI still landed at −21.64%.

    Grid profit and actual account performance are not the same number, and treating them as interchangeable is exactly the trap the article’s “bear market risk” section warns against: a range that breaks to the downside keeps the bot buying into a falling price, and no amount of fill activity fixes that.

    Why it matters: This is the practical cost of running a bull- or sideways-tuned grid into a bear leg without defensive adjustments — trade count and gross profit can look active while the account still bleeds.

    View Complete Playbook: https://cryptogates.io/playbooks/grid-bot-vs-a-33-bnb-crash-what-the-backtest-data-actually-shows/

    Best Use Case in Bear Markets

    Short relief bounces and deep, temporary support zones.

    This setup really only makes sense for experienced traders who are actively monitoring, ready to pause the bot the moment structure breaks.

    What is the best market condition for grid trading?

    Sideways, range-bound markets. Price bounces between clear support and resistance without committing to a direction, which is exactly what a grid is built to capture.

    Best Grid Trading Strategy for Sideways Markets

    Here’s the thing everyone eventually figures out.

    Sideways markets, the ones that bore directional traders half to death, are grid trading’s actual home turf. This is where the strategy is supposed to shine, and honestly, it’s not close.

    Price repeatedly moves between support and resistance, creating one grid opportunity after another. This is where consistency peaks and where both spot and AI-driven setups tend to perform their best.

    Grid Trading’s Sideways Advantage: A Real Test

    Theory says grid trading thrives in sideways markets — but what does that actually look like in practice?

    In one CryptoGates backtest, SOL drifted between $80 and $97 for 60 straight days, the kind of “boring” price action that frustrates directional traders.

    The grid bot didn’t need direction. It fired 146 trades, banked $462.95 in net profit, and outperformed a simple buy-and-hold position by 10.88%. No trend calls, no predictions — just the range being respected and the grid doing what it’s built to do.

    This is the practical version of the “sideways is grid’s home turf” argument: it’s not a theory, it’s a repeatable pattern once range width and grid count are matched to the market’s actual behavior.

    View Complete Playbook: https://cryptogates.io/playbooks/sol-usdt-grid-bot-backtest-mar-apr-2026/

    Sideways Market Grid Setup

    Use a tight-to-moderate range with a balanced grid count.

    Keep your focus on fee-adjusted profitability rather than raw trade count. Liquid pairs with a clear horizontal structure make this setup so much easier to run.

    Sideways Market Advantages

    Frequent order fills. Clear, readable price behavior.

    A better risk-to-reward setup than anything you’d get chasing a trend. It’s just a stronger, steadier system overall for both spot and algorithmic approaches.

    Best Use Case in Sideways Markets

    Consolidation after a big move, assets stuck between obvious boundaries, and traders who’d rather collect small repeatable gains than chase the next moon candle.

    How to Optimize a Grid Strategy

    Honestly, grid trading isn’t a “turn it on and forget it” tool, no matter what some Telegram group tells you.

    Optimization is where the real edge lives, and it comes down to range, spacing, capital allocation, and fee awareness working together instead of separately.

    This is where backtesting earns its keep.

    Before you commit real capital, running your setup through CryptoGates’ Grid Strategy Backtest Bot lets you see how your exact range and spacing would’ve performed across real historical conditions, not a guess dressed up as a plan.

    CEO Note:

    Zaheer here. I’ll say this every time someone asks me about grid settings: verify first, risk later, scale slowly. A backtest costs you nothing. A live mistake costs you real money.

    Choosing the Right Price Range

    Set your range around actual support and resistance, not a number that just felt right.

    Avoid ranges that are too tight, since price breaks out fast, and avoid ranges that are too wide, since each grid captures too little to matter. The range should reflect what the market has actually been doing, not what you hope it does next.

    Grid Count, Spacing and Capital Allocation

    More grids mean more trades but smaller profit per trade.

    Fewer grids mean bigger profit per trade but fewer chances to fill. Match your spacing to volatility, and honestly, don’t overcommit to one grid just because it feels active.

    Keep position size aligned with your actual risk tolerance and reserve some cash for a sudden breakout or trend shift.

    Content Table: Grid Setup by Market Type

    Swipe to view full data →
    Market Condition Range Width Grid Density
    Bull Wide Low
    Bear Defensive/Narrow Low
    Sideways Tight-to-moderate Balanced

    Fees and ROI

    Here’s the issue nobody warns you about early enough.

    Fees can quietly destroy an otherwise solid grid setup. Every fill has a cost, and if your grid spacing doesn’t comfortably clear that cost, you’re basically paying the exchange to lose small amounts over and over.

    Always measure ROI net of fees, factoring in realized profit, unrealized loss, and true capital efficiency, not just the raw number of trades your bot executed.

    Grid bots that ignore fee drag from overly narrow spacing are one of the most common reasons range-bound strategies underperform in practice, according to CoinCodeCap.

    When Not to Use Grid (and Common Mistakes to Avoid)

    Wait, here’s the thing that separates a disciplined trader from someone about to get cooked. Grid trading isn’t supposed to run on every market, every pair, every condition.

    Trend-heavy markets and illiquid pairs are the two biggest red flags, and ignoring them is basically asking for a strategy failure.

    Market Mismatches to Avoid

    Strong one-directional trends can trap your bot on the wrong side of a move, fast.

    Illiquid pairs create wide spreads and poor execution, where slippage and fees quietly eat whatever small profit the grid was supposed to capture.

    And if support and resistance aren’t even visible on the chart, setting a range is just guessing with extra steps. Guessing isn’t a strategy, no matter how confident it feels.

    Spot Grid vs Futures Grid

    Spot grid is the safer, more forgiving option for most people. Futures grid adds leverage into the mix, which means liquidation risk becomes a real possibility instead of a theoretical one.

    Futures setups demand stronger discipline and sharper market timing, so they’re not really a beginner’s tool.

    Common Grid Trading Mistakes

    Using one grid setup across every market condition. Setting too many grids in a fee-heavy environment. Ignoring trend breaks until it’s too late. Running futures grid with zero risk control.

    Not updating settings as volatility shifts. Look, these five mistakes cover most of the losses people blame on “bad luck.“

    Best Practices and the Market-Condition Playbook

    Here’s the simple truth.

    The best grid traders aren’t the ones with the fanciest bot. They’re the ones who adapt their settings instead of running the same formula on every chart.

    Ngl,

    That’s basically the entire difference between consistent grid profits and getting cooked during a trend change.

    Andreas M. Antonopoulos
    “The idea that you can do capitalism without risk is ridiculous on its face.”

    Andreas M. Antonopoulos

    Interactive Checklist: Before You Launch a Grid

    • Backtest the exact range and spacing first
    • Start with smaller capital, scale up slowly
    • Only use liquid pairs with clear structure
    • Match the setup to bull, bear, or sideways conditions
    • Track ROI net of fees, not gross trade count

    Quick Playbook by Market Type

    Bull market: wider, defensive, trend-aware settings that won’t get left behind.

    Bear market: reduced exposure, smaller capital, capital protection first.

    Sideways market: this is where you run your most active grid setup, full stop. The strategy that wins isn’t the most aggressive one.

    It’s the one that fits the market instead of fighting it.

    Grid bots are widely reported to perform best when price oscillates repeatedly within a defined range, since more swings inside that range directly compound into more completed, profitable cycles.

    Bitsgap

    Conclusion

    Look, grid trading works best when the market is sideways.

    That’s just the honest answer. But it can still be adapted for bull and bear conditions if you’re willing to adjust range, density, and capital instead of copying one template everywhere.

    The traders who actually stay consistent are the ones who know when to widen a range, when to go defensive, and when to sit a trend out entirely.

    If you want to see how your own settings would’ve performed instead of guessing, run them through the Grid Strategy Backtest Bot first.

    Verify before you automate.

    FAQs

    Is grid trading profitable in a trending market?

    It can struggle in strong one-directional trends since the bot may miss upside or keep buying into a decline. Wider ranges and lighter density help, but sideways conditions remain more reliable.

    There’s no fixed number. It depends on your grid density, spacing, and risk tolerance. Starting small and scaling slowly is the safer approach for most traders.

    Spot grid trades with owned assets and carries lower risk. Futures grid adds leverage, which increases both potential returns and liquidation risk, so it demands more discipline.

  • AI 🤖 vs Human Strategy Selection: Which Approach 🎯 Makes Smarter Crypto Decisions 📈

    AI 🤖 vs Human Strategy Selection: Which Approach 🎯 Makes Smarter Crypto Decisions 📈

    Ser, there’s a common assumption floating around CT lately.

    AI picks strategies, so it must be smarter, cleaner, and more objective than a human ever could be.

    And honestly,

    There’s some truth to that. But it’s not the full picture. AI vs human strategy selection isn’t really a fight where one side wins and the other loses. It’s a question of what each one is actually good at, and where each one quietly fails.

    Get that wrong, and you either trust a machine with decisions it was never built to make, or you keep making the same emotional mistakes a machine could’ve caught in seconds.

    Studies on retail trading behavior consistently show that emotional decision-making, not lack of information, is the leading cause of poor strategy outcomes.

    EXECUTIVE SUMMARY
    • The Problem: Traders either over-trust their own gut feeling or blindly trust AI output, without understanding what each one actually does well.
    • The Solution: Liquidity Combine AI’s data-processing scale with human judgment on risk tolerance and capital constraints.
    • The Incentive: This hybrid approach catches mistakes neither side would catch alone, emotional bias on one hand, blind automation on the other.
    • The Risk: Relying entirely on either AI or human instinct alone leaves a real gap that eventually costs capital.

    What Human Strategy Selection Actually Gets Wrong

    Humans are pattern-seeking creatures, and honestly, that’s both our strength and our biggest weakness in trading.

    We’re great at noticing a trend. We’re terrible at staying objective once we’ve noticed one.

    Here’s the interesting part. Most bad strategy decisions don’t come from a lack of intelligence or effort. They come from very predictable psychological shortcuts that everyone falls into, even experienced traders.

    Recency Bias — Trusting What Just Worked

    Look,

    If a strategy just had a great month, it feels proven. That’s recency bias at work.

    Humans naturally overweight what just happened and underweight what happened three months ago, or what might happen next month.

    A strategy’s last 30 days tell you almost nothing about whether it survives a genuinely bad market.

    This is where things get risky. Traders scale into a strategy right when it “feels” most trustworthy, which is often exactly when it’s about to underperform.

    Emotional Attachment to a Strategy

    Here’s the issue.

    Once a trader’s been running a strategy for a while, it stops being just a system.

    It becomes personal.

    They hold onto a losing strategy longer than they should because admitting it’s broken feels like admitting they were wrong.

    Or

    They abandon a genuinely solid strategy after one rough week because fear kicks in faster than logic does.

    Wait.

    Neither of those decisions is based on data. Both come from feelings, wearing a strategist’s hat.

    Real Backtest Example

    Ser, this is exactly the kind of scenario where emotional attachment gets tested in real time.

    In one CryptoGates Playbook, a DCA bot ran on TAO through a sharp 36% pump followed by a bleed back down to a 17% loss for anyone just holding.

    A human running that same trade would almost certainly have felt the pull to stop buying once the price started reversing, or to hold on hoping for a bounce back to the highs. The bot didn’t do either.

    It kept executing its rules through both legs, closing 139 of 140 sessions in profit and finishing up $1,677. Nothing about that result came from conviction or hope, it came from ignoring the emotional part entirely and just running the system.

    View Complete Playbook: https://cryptogates.io/playbooks/tao-dca-bot-made-1677-while-spot-holders-lost-17/

    What AI Actually Brings to Strategy Selection

    Now let’s look at the other side. AI-driven analysis brings something humans structurally cannot replicate: scale without fatigue.

    It doesn’t get tired. It doesn’t get emotionally attached. It just processes.

    The simple truth is, this is exactly where AI earns its place in strategy selection, not by being “smarter” in some abstract sense, but by doing repetitive, data-heavy work at a scale no human ever could.

    “The hardest part of trading isn’t finding a strategy, it’s staying objective about your own strategy once you’re emotionally invested in it.”

    ZAHEER, CEO CryptoGates

    Why do human traders make bad strategy decisions?

    Mostly because of recency bias and emotional attachment, not lack of knowledge. Recent results feel more convincing than they actually are, and losing positions get harder to exit objectively.

    Processing Thousands of Scenarios Without Fatigue

    A human might manually backtest a strategy across a handful of market conditions if they’re patient.

    AI-driven simulation runs thousands of permutations, shuffling trade sequences to see how a strategy behaves across many possible versions of history.

    That’s not a small difference, ser.

    That’s the difference between checking one weather forecast and checking ten thousand possible forecasts before deciding whether to bring an umbrella.

    Removing Emotional Bias From the Decision

    Here’s the key idea.

    AI doesn’t care that a strategy “just had a great month.“

    It doesn’t feel attached to a winning streak, and it doesn’t feel sunk cost toward a losing one. It evaluates purely on the data in front of it.

    Honestly, that objectivity alone eliminates a huge chunk of the mistakes humans make without even realizing they’re making them.

    Swipe to view full data →
    Factor Human Selection AI-Driven Selection
    Speed Limited, manual review Thousands of scenarios instantly
    Bias Recency and emotional attachment None, purely data-driven
    Context Awareness Understands personal risk No inherent risk awareness

    Where AI Still Has Limits

    But there’s a problem, and it’s an important one. AI isn’t magic. It’s only as good as the data and parameters someone feeds it. Garbage assumptions in, garbage confidence out.

    AI Can’t Set Your Risk Tolerance For You

    This is the part people miss. AI can tell you a strategy’s Risk of Ruin is 3%.

    It cannot tell you whether 3% feels acceptable to you personally, given your capital, your goals, your actual tolerance for watching a number drop.

    That’s not a data problem. That’s a human one, and no simulation replaces it.

    Reality Check

    Common belief: a data-driven bot removing emotional bias means it should reliably win. What CryptoGates research found: that’s not always true.

    A grid bot running BNB through a 33% post-ATH crash still fired 171 trades and generated real grid profit, yet total ROI landed at −21.64% once the underlying price move was accounted for. Why it matters: objectivity isn’t the same as protection.

    A system can execute flawlessly, without a single emotional decision anywhere in the process, and still lose if the parameters or market conditions don’t hold up. That’s the honest boundary of automation, it removes bias, not risk.

    View Complete Playbook: https://cryptogates.io/playbooks/grid-bot-vs-a-33-bnb-crash-what-the-backtest-data-actually-shows/

    Garbage In, Garbage Out

    Feed a simulation bad historical data or unrealistic parameters, and it’ll confidently spit out a result that looks scientific but means nothing.

    Honestly,

    That’s kinda the scary part, ngl. A polished chart or a clean robustness score can create false confidence if the inputs behind it were flawed to begin with.

    CEO Note:

    Hey, it’s Zaheer. AI can crunch numbers faster than any of us ever could, but it still can’t tell you what you can actually live with emotionally. That part’s still on you. Verify first. Risk later. Scale slowly.

    Can AI fully replace human judgment in crypto trading?

    No. AI can process scenarios and remove emotional bias, but it can’t determine your personal risk tolerance or capital constraints. That judgment still needs a human.

    The Smarter Approach — AI-Assisted, Human-Directed

    Here’s what actually matters.

    This was never really a versus question. The smarter approach uses AI for the heavy analytical lifting and lets the human make the final, risk-based call.

    Neither side replaces the other. They cover each other’s blind spots.

    Let the Data Narrow the Options

    Instead of guessing between five different strategy variations, let stress-tested metrics do the narrowing first.

    Robustness Score and Risk of Ruin can eliminate the options that only look good on the surface, leaving a shortlist of strategies that have actually proven some level of structural survivability.

    Let the Human Make the Final Call

    Once the data narrows things down, the final decision still belongs to the trader.

    Only you know your actual capital, your time horizon, and honestly, how you’ll feel watching a 20% drawdown play out in real time. The data informs that decision. It shouldn’t make it for you blindly.

    TIP:

    Use data to eliminate bad options, but never let a dashboard make your final risk decision. That part has to stay personal.

    How the Strategy Engine Fits This Hybrid Model

    This is exactly the gap the Crypto Strategy Engine was built to close.

    It’s the AI-driven layer that does the heavy lifting, without ever pretending to replace the trader’s own judgment.

    Monte Carlo Simulation as the AI Layer

    Instead of one static backtest, the Engine runs a Monte Carlo Simulation, shuffling thousands of trade permutations to see how a strategy holds up across many different possible market sequences.

    This is the AI-driven scale part, the piece no human could realistically do by hand.

    The Trader Still Owns the Final Decision

    But here’s the thing. The Engine doesn’t tell you “trade this.”

    It shows you Robustness Score, Risk of Ruin, and Probable Drawdown, then leaves the actual decision, the risk ownership, with you.

    That’s intentional.

    Ser, honestly, that’s the whole point. Data removes guesswork. It doesn’t remove responsibility.

    Interactive Checklist: Before trusting AI output for strategy selection, check:

    Pre-Trade Strategy Audit

    • Has the strategy been stress-tested across multiple market conditions?
    • Do you understand what Risk of Ruin actually means for your capital?
    • Are the historical data and parameters realistic, not idealized?
    • Does the Robustness Score hold steady across different simulation runs?
    • Have you personally confirmed the risk level feels survivable to you?
    Should I trust AI-generated trading strategies completely?

    No. AI is strong at processing scale and removing bias, but risk tolerance and capital decisions still need human judgment. Use AI output as a data point, not a final answer.

    Conclusion

    Neither Wins Alone

    Ser, at the end of the day, AI vs human strategy selection isn’t really a competition.

    AI brings scale, consistency, and objectivity that no human can match manually, running thousands of scenarios without ever getting emotionally attached to a winning streak.

    Humans bring context, risk ownership, and an understanding of what they can actually survive emotionally, something no simulation can measure.

    The traders who do this well don’t pick a side. They let AI narrow the field with real data, then make the final call themselves.

    That’s the whole idea behind the Strategy Engine:

    Doing the heavy analytical lifting so your decision is based on proof, not a gut feeling or a screenshot from CT.

    Run your own strategy through it and see what the data actually shows → cryptogates.io.

    FAQs

    Is AI better than human judgment for crypto strategy selection?

    Not entirely. AI is better at processing scale and removing emotional bias, but humans still need to set risk tolerance and make the final capital decision.

    No. AI can reduce guesswork through stress testing, but it can’t eliminate risk or replace personal judgment about what you can financially and emotionally handle.

    Use AI-driven tools to narrow down options using data like Robustness Score and Risk of Ruin, then make the final decision based on your own risk profile.

  • Crypto Portfolio Rebalancing Strategies 📊 That Keep Your Risk 🛡️ Under Control Through Every Market 📈

    Crypto Portfolio Rebalancing Strategies 📊 That Keep Your Risk 🛡️ Under Control Through Every Market 📈

    Ser, have you ever checked your portfolio after a big pump and realized one coin quietly took over half your holdings?

    That’s portfolio drift, and it happens faster than most people think. One asset moons, another one bleeds, and suddenly your “balanced” setup isn’t balanced anymore.

    This is exactly why crypto portfolio rebalancing strategies exist. They’re not about chasing gains.

    They’re about keeping your risk where you actually want it. Shrimpy’s backtesting portfolio rebalancing study found that nearly 85% of all portfolios evaluated produced better results when using a rebalancing strategy compared to simply holding.

    That’s not a small edge.

    Here’s the thing:

    Most traders never touch rebalancing until they’ve already been burned by one coin dominating their bag.

    This guide walks through the main strategies, how each one fits, and how to actually build one you’ll stick with. 

    EXECUTIVE SUMMARY
    • The Problem: Crypto prices move so fast that your original portfolio mix can drift into a completely different risk profile without you noticing.
    • The Solution: Rebalancing strategies like periodic, threshold, manual, or automatic rebalancing reset your allocations back to target and keep risk in check.
    • The Incentive: Backtested data shows rebalanced portfolios have historically outperformed simple holding in most tested scenarios, especially in choppy or sideways markets.
    • The Risk: Rebalancing too often, ignoring fees, or picking a method that doesn’t match your time and capital can quietly erode the exact returns you’re trying to protect.

    What Is Crypto Portfolio Rebalancing?

    Crypto portfolio rebalancing is the process of bringing your holdings back to their original target weights after prices move them out of line.

    Say you started with 50% BTC, 30% ETH, and 20% in smaller altcoins.

    That’s your target allocation. Now imagine BTC pumps hard for a few weeks. Suddenly, BTC might be sitting at 65% of your portfolio, not 50%. That shift is called portfolio drift, and it happens whether you’re watching the charts or not.

    Rebalancing means selling a bit of the asset that grew too large and buying more of the ones that fell behind, restoring your original mix.

    It sounds almost too simple. But that simplicity is the whole point. You’re not trying to predict which coin moons next.

    You’re just keeping your exposure where you originally decided it should be, based on your own risk tolerance and target weights, not on whatever happened to pump last week.

    Research Highlight

    A pattern that shows up repeatedly across CryptoGates‘ rebalance testing: the strategy doesn’t need both assets to go up to earn its keep.

    In a two-asset portfolio where SOL fell nearly 32% and ETH collapsed 48% over eight weeks, a passive 50/50 holder had no way to reduce exposure to either falling asset.

    The rebalance bot, forced by its own rules to keep trimming and adding across both legs down, still lost less than doing nothing — a smaller loss than the buy-and-hold benchmark over the same window.

    This is the part that’s easy to miss when people evaluate rebalancing only by its wins: the real value shows up in how much less it loses when the whole market is red, not just how much more it gains when one asset outperforms.

    View Complete Playbook: https://cryptogates.io/playbooks/sol-crashed-32-eth-crashed-48-did-rebalancing-help/

    Why Rebalancing Matters in Crypto

    Look, crypto doesn’t move like traditional markets.

    A 20% swing in a single day isn’t rare; it’s kind of expected. That level of volatility can distort a portfolio’s balance in ways that would take traditional stocks months or years to do.

    One winner runs, one loser bleeds, and before you know it, your “diversified” portfolio is really just a concentrated bet on whatever asset happened to pump the hardest.

    Shrimpy’s backtesting research, which ran over a thousand simulated portfolios per test group, found that when all tests were combined, the median performance improvement from rebalancing was 64% compared to simply holding.

    Source: Shrimpy Research, Backtesting Portfolio Rebalancing Study

    That’s not a guarantee of future results, and CryptoGates isn’t in the business of promising outcomes. But the pattern is hard to ignore.

    Rebalancing forces discipline into a market that rewards emotional decisions with liquidation. It caps how much exposure any single asset can quietly build up, which means your downside gets managed even while you’re not staring at charts all day.

    This is where risk management and diversification actually meet in practice, not just in theory.

    How often should you rebalance a crypto portfolio?

    There’s no single right answer here. It depends on your method, but monthly or threshold-based triggers work well for most retail investors without overtrading.

    Types of Crypto Rebalancing Strategies

    There isn’t one single “correct” way to rebalance.

    There are four core approaches, and each one trades off control against effort in a different way.

    Picking the right one comes down to how much time you want to spend babysitting your portfolio.

    The method matters less than the consistency. Pick a rule set you can actually follow every time, not the one that sounds smartest on paper.

    ZAHEER, CEO CryptoGates

    Periodic Rebalancing

    Periodic rebalancing means you adjust your portfolio on a fixed schedule.

    Weekly, monthly, quarterly, yearly,

    Whatever cadence fits your style. You check the weights on that date, sell what’s overweight, buy what’s underweight, and move on.

    It’s simple, it’s predictable, and it’s the easiest method to automate through a bot or scheduled tool.

    Threshold Rebalancing

    Threshold rebalancing skips the calendar entirely. Instead, you set a drift limit, say 5% or 10% off target, and only rebalance when an asset crosses that line.

    This reacts to actual market movement instead of arbitrary dates, and it tends to cut down on unnecessary trades during quiet, low-volatility stretches.

    Manual Rebalancing

    This one’s exactly what it sounds like.

    You check your allocations yourself and make the trades by hand whenever you decide it’s time. Manual rebalancing gives you full control over timing and execution.

    Unfortunately, it also demands consistent attention, and that’s where a lot of manual rebalancers slip.

    Life gets busy, and the portfolio drifts unchecked.

    Automatic Rebalancing

    Automatic rebalancing hands the whole process off to a system or bot running predefined rules.

    No emotion, no second-guessing, no “just one more day” hesitation. It’s the closest thing to pure discipline in execution, since the bot doesn’t care if the market feels scary or euphoric that day.

    Best Rebalancing Strategy for Different Investor Types

    Honestly,

    There’s no universal best answer here. The right rebalancing strategy depends on your available time, your capital size, and how much risk you’re actually comfortable holding.

    What works great for a busy professional could be completely wrong for someone glued to charts every day.

    Mark Douglas,
    “Trading is not about being right or wrong. It’s a probability game.”

    Mark Douglas, Trading Psychology Author

    That mindset applies just as much to rebalancing as it does to any trade. You’re not trying to be right about which coin pumps next. You’re managing probability and exposure over time.

    Best for Beginners

    Periodic or automatic rebalancing fits beginners best.

    The rules are simple, the maintenance is low, and there’s less room for emotional decisions to creep in.

    You set it, you follow it, you don’t overthink it.

    Real Backtest Example

    Strategy: Rebalance Bot (Asset vs. Stablecoin)
    Coin: ADA/USDC
    Market Condition: Sharp pump followed by a fast reversal (33 days)
    Objective: Test whether a rule-based rebalance could outperform passive holding through a full round trip

    ADA moved from $0.78 up to $1.02 on a macro announcement, then dropped back to $0.67. A buy-and-hold position rode the entire round trip and gave back most of the gain. The rebalance bot, running on just 6 trades, sold into strength near the top, parked the proceeds in USDC through the crash, and finished 2.74% ahead of simple holding.

    Expert Interpretation: The edge here didn’t come from predicting the top. It came from a pre-set rule that forced a sell when ADA’s weight drifted too far from target — the same threshold logic described above, applied with real capital and real price action.

    View Complete Playbook: https://cryptogates.io/playbooks/ada-rebalanced-against-usdc-for-33-days-the-bot-outperformed-holding-by-2-74/

    Best for Active Investors

    Traders who actually enjoy watching the market tend to do better with threshold or manual rebalancing.

    Both give more control and let you react faster to real market moves instead of waiting for a fixed date to roll around.

    Best for Long-Term Investors

    Periodic rebalancing wins here, too, mostly because it’s the easiest to stick with over the years. Long-term investors don’t want to babysit thresholds constantly.

    A quarterly or yearly check-in keeps the plan alive without becoming a part-time job.

    What is the best rebalancing strategy for a crypto portfolio?

    There isn’t one universal winner. Periodic rebalancing suits beginners and long-term holders, while threshold or manual methods fit active traders who want faster control.

    How to Rebalance Crypto Portfolio Step by Step

    Rebalancing works best when it follows a clear execution plan, not a vague “I’ll check it sometime” approach. Here’s how the process actually flows in practice.

    Interactive Checklist: Rebalancing Execution Plan

    Pre-Trade Strategy Audit

    • Choose your target allocations before you deploy any capital, based on your actual risk tolerance.
    • Pick your rebalancing method, periodic, threshold, manual, or automatic.
    • Decide your frequency or threshold trigger and write it down somewhere you’ll actually see it.
    • Review current portfolio weights against your original targets.
    • Execute the trades needed to restore balance, then log the result and move on.

    That last step matters more than people give it credit for.

    Tracking results over time is what turns rebalancing from a guess into a strategy you can actually improve. Without a record, you’re just repeating the same mistakes and hoping for a different outcome next cycle.

    CryptoGates’ Rebalance Strategy Backtest Bot lets you run this exact process against real historical data before you touch live capital, so you can see how your chosen frequency and thresholds would have played out.

    Common Mistakes When You Rebalance Crypto Portfolio

    Wait,

    Before you set up your first rebalancing rule, it’s worth knowing where most people trip up.

    The biggest one is rebalancing too often. It feels productive, checking your portfolio daily and adjusting at the smallest wiggle, but it usually just burns money on fees without improving your actual results.

    A Vanguard study covering data back to 1926 found that rebalancing quarterly or monthly produced no improvement in long-term risk or returns compared to annual rebalancing, and simply drove up turnover and transaction costs.

    Source: Vanguard research, cited via Kitces.com

    Ignoring fees and spreads is the second big trap.

    Every trade costs something, and in crypto, that cost can sneak up fast if you’re rebalancing across multiple pairs. Setting unrealistic target weights is another one.

    If your targets don’t match your actual risk tolerance, you’ll end up fighting your own plan every time the market moves.

    Letting emotions override the plan is probably the most human mistake on this list. The whole point of rebalancing is removing emotional decisions, so if you skip a trade because “it feels wrong” or chase one more pump before rebalancing, you’re back to square one.

    And rebalancing without a clear strategy at all, just vaguely trading when something feels off, isn’t rebalancing. That’s just reactive trading wearing a disguise.

    Watch your turnover, keep transaction costs in mind, and don’t let overtrading quietly eat your edge.

    What Makes the Best Rebalancing Strategy

    Here’s the thing.

    The best rebalancing strategy isn’t the most complicated one. It’s the one you’ll actually follow when the market gets messy, and your gut is screaming at you to do something else.

    Low complexity beats clever complexity almost every time in practice.

    TIP:

    “Don’t trust, verify.” Nic Carter, Coin Metrics

    That line applies directly here.

    Before you commit to any rebalancing rule set, verify it against real data instead of trusting your gut feeling about what “should” work.

    A strong strategy needs clear rules, reasonable trading costs, and a solid fit with your actual goals, not someone else’s goals borrowed from a Twitter thread.

    It also needs the right balance between control and automation. Too much manual oversight and you’ll burn out. Too much blind automation and you’ll stop understanding your own portfolio. The sweet spot is different for everyone, but the test is always the same:

    Can you follow this rule set consistently for a year without abandoning it the first time the market gets scary?

    Example Crypto Rebalancing Playbook

    Let’s break this down with something concrete. Imagine a portfolio built on a 50/30/20 target: 50% BTC, 30% ETH, and 20% spread across smaller altcoins.

    That’s the target.

    Now here’s how two different approaches would actually play out.

    Swipe to view full data →
    Method Trigger Best Fit
    Monthly Periodic First of every month Beginners, long-term holders
    Threshold (10%) Any asset drifts 10% from target Active traders watching the market
    Hybrid Monthly check, rebalance only if drifted 5%+ Investors wanting balance of both

    With the monthly example, you’d check allocations on the same date every month regardless of what happened in between.

    Simple, predictable, easy to automate.

    With the threshold example, if BTC pumps hard and climbs from 50% to 60% of the portfolio, that crosses the 10% trigger and forces a rebalance right then, not on some arbitrary future date, similar to how this SOL/ETH rebalance bot playbook played out in a real divergence scenario.”

    Now imagine this: it’s honestly kind of satisfying watching a rule-based system just quietly do its job while the timeline is in full meltdown mode over the same price swing.

    That’s the whole appeal.

    CryptoGates’ Rebalance Strategy Guide lets you plug in a playbook like this one and see exactly how it would have performed across real historical market data before you risk a single dollar on it.

    When NOT to Rebalance

    Rebalancing isn’t a rule you apply blindly every single time, no matter what. There are moments when it actually costs you more than it protects you.

    If fees are unusually high or liquidity is thin on the pairs you’re trading, forcing a rebalance right then can eat into the exact returns you’re trying to protect. Slippage on a thin order book adds up fast.

    Tax consequences matter too. In some jurisdictions, every rebalancing trade can trigger a taxable event, and if that cost outweighs the benefit of realigning your weights, it’s worth waiting.
    If your portfolio is already sitting close to target, there’s honestly no point in forcing a trade just because your calendar says it’s time.

    That’s needless turnover for no real gain. And short-term noise, a coin wobbling 3% in either direction during normal volatility, usually isn’t worth reacting to at all.

    Cost efficiency matters just as much as discipline does. Sometimes the most disciplined move is doing absolutely nothing.

    Building a Rebalancing Strategy You Can Actually Stick With

    The best crypto portfolio rebalancing strategy isn’t a secret formula.

    It comes down to how much control you want, how much automation fits your life, and how honestly you can stick to your own rules once things get volatile.

    Periodic works for people who want simplicity. Threshold works for people who want precision. Whatever you pick, the goal stays the same: keep your portfolio aligned with your actual plan instead of whatever the market happened to do last week.

    If you want to see how a rule set like this would have actually performed, CryptoGates’ Rebalance Strategy Backtest Bot lets you test it against real historical data first.

    FAQs

    How often should you rebalance a crypto portfolio?

    There’s no single fixed rule, but monthly or threshold-based triggers work well for most investors without creating excessive fees.

    It can, depending on your jurisdiction. Selling an asset to restore balance may count as a taxable event, so check local rules before automating trades.

     It depends on your style. Automatic rebalancing removes emotion and saves time, while manual rebalancing gives more control for active traders who prefer hands-on decisions.

  • Crypto Backtesting Software 📊 Compared: Choose the Right Tool 🎯 Before You Risk Real Money 💰

    Crypto Backtesting Software 📊 Compared: Choose the Right Tool 🎯 Before You Risk Real Money 💰

    You’re about to risk real money on a crypto strategy you built off a hunch.

    Ser,

    That’s how most people lose their shirts. Here’s the thing, though.

    The traders who actually survive this market don’t guess. They test first.

    That’s exactly what crypto backtesting software is built for, and picking the right one might matter more than the strategy itself.

    Studies show that about twice as many day traders lose money as make money, with data suggesting that up to 72% of day traders ended the year with financial losses, leaving only around 20% more than marginally profitable.

    Source: Financial Analysts Journal, day trading profitability study.

    Look, that number isn’t there to scare you.

    It’s there to explain why backtesting exists in the first place.

    This guide compares the best crypto backtesting software out there, breaks down what actually matters when you’re choosing one, and shows you where free tools hold up against paid platforms.

    EXECUTIVE SUMMARY
    • The Problem: Most traders pick backtesting software based on ads or hype, not on whether the tool actually fits how they trade.
    • The Solution: Compare tools on price, data quality, realism, and features before committing time or money to any of them.
    • The Incentive: The right software lets you test dozens of strategies risk-free and walk into live trading with actual evidence, not a feeling.
    • The Risk: A tool with bad data or unrealistic fee modeling can hand you a “winning” strategy that fails the second it hits a live market.

    What Crypto Backtesting Software Does

    Crypto backtesting software takes a trading strategy and runs it against historical price data to see how it would’ve performed. To fully grasp this methodology, it helps to read a comprehensive crypto backtesting guide that outlines setting parameters and evaluating performance metrics.

    Instead of risking capital to find out if your idea works, you run it against real market history first.

    Weeks, months, even years of data get compressed into a few minutes of testing.

    Honestly, this is the part most beginners skip. They build a strategy in their head, feel confident about it, and jump straight into live trading. Then the market humbles them fast.

    Why Backtesting Matters Before You Risk Real Capital

    A strategy that sounds smart isn’t the same as a strategy that’s proven. Backtesting turns a gut feeling into something you can actually measure.

    It shows you how a DCA setup would’ve handled a 40% drawdown, or how the Grid Backtest Bot would’ve behaved during six months of chop.

    Without that step, you’re not trading. You’re just gambling with extra confidence.

    This ties back to the whole idea behind CryptoGates: verify first, risk later, scale slowly. Backtest bots like the DCA Strategy Backtest Bot, exist specifically to close that gap between “I think this works” and “I know this works.”

    Real Backtest Example

    Strategy: DCA (Dollar-Cost Averaging)
    Coin: ETH/USDT
    Market Condition: Sharp post-peak decline — down 32% over 46 days
    Objective: Test whether staged buying reduces drawdown exposure compared to a single lump-sum position

    Key Result: The DCA bot closed the window down just 1.81%, while a straight buy-and-hold position on the same capital lost significantly more over the same stretch. The gap between the two outcomes — not the bot “beating” a falling market outright — is the real story.

    Expert Interpretation: This is the exact scenario the article keeps pointing at: a strategy only proves itself once it’s been run against a genuine drawdown, not a cherry-picked bull month. Staged entries didn’t turn a loss into a win here, but they meaningfully cut the size of it, which is the whole point of backtesting before deploying real capital.

    View Complete Playbook: https://cryptogates.io/playbooks/eth-crashed-32-in-46-days-our-dca-bot-lost-only-1-81/

    Why Comparing Crypto Backtesting Tools Matters

    Not every trader needs the same thing from a backtesting tool.

    A beginner testing their first DCA idea doesn’t need the same horsepower as a quant running custom scripts across ten pairs. But here’s the thing.

    Most people pick software based on which YouTuber promoted it, not whether it fits how they actually trade.

    Mark Douglas,
    “Market analysis will not solve the problems created by a lack of discipline and confidence.”

    Mark Douglas, Trading in the Zone

    Douglas wasn’t talking about software specifically, but the point lands anyway.

    Even the best backtesting tool in the world won’t save a strategy you never actually stress test. If you need help getting started with structured rulesets, building your layout on top of proven templates like the 12 Proven Crypto Trading Strategies 2026 is an excellent first step before simulating performance.

    What you do with it is on you.

    Matching Backtesting Software to Your Trader Type

    A beginner wants something simple.

    Clear results, no coding, no steep learning curve. An advanced trader might want raw data exports, custom parameters, or API access.

    Someone focused on automation cares less about the testing interface and more about how smoothly the tool connects to live execution afterward. Before migrating your automated strategy to a production environment, it is highly recommended to study in detail how a grid bot works so you understand exactly how execution grids handle sudden momentum swings.

    None of these traders should be shopping for the same software, yet most comparison articles treat backtesting tools like a one-size-fits-all decision. It isn’t.

    Is backtesting software necessary for crypto trading?

    It’s not legally required, obviously. But skipping it means trading on assumptions instead of evidence, and the data shows that rarely ends well for retail traders.

    Crypto Backtesting Software Comparison Criteria

    Before comparing specific platforms, you need a framework. Otherwise you’re just comparing logos and marketing copy.

    Here’s what actually separates a useful tool from a flashy one.

    Price and Free Plan Availability

    This one’s simple, but it matters more than people admit.

    A $50 monthly subscription doesn’t sound like much until you’re testing five strategies across three months and burning through trial credits before you’ve learned anything useful.

    Free access changes the entire equation. It means you can test as many ideas as you want without watching the clock or a paywall.

    Ease of Use and Learning Curve

    A powerful tool nobody can figure out isn’t powerful; it’s abandoned. Look for clean interfaces, clear result summaries, and a setup process that doesn’t require a coding background.

    If you’re spending more time reading documentation than testing strategies, something’s wrong.

    Backtest Realism: Fees and Slippage Modeling

    This is where many tools quietly fail.

    A backtest that ignores trading fees, slippage, or exchange spreads will show you a strategy that looks amazing on paper and falls apart the moment real money touches it.

    This is why professional quants pull precision tick data directly from top-tier analytics directories like CoinGecko or CoinMarketCap to cross-reference exchange-level spreads before taking setups live.

    Ngl,

    This is probably the single most overlooked factor in the whole comparison. Realistic modeling isn’t optional. It’s the whole point.

    Data Quality and Exchange Support

    Garbage data in, garbage conclusions out.

    You want granular historical data, ideally down to 1-minute candles, across the exchanges and pairs you actually trade.

    A tool that only supports Bitcoin on one exchange isn’t going to help much if you trade altcoins across five different platforms.

    Features, Automation, and Reporting Depth

    The backtest itself is only half the value. Good reporting shows you drawdown depth, win rate, risk-adjusted return, and how the strategy performed across different market conditions, not just one lump-sum number.

    That’s the difference between a tool that teaches you something and one that just spits out a percentage and calls it a day.

    CryptoGates Overview — The Free Crypto Strategy Backtesting Option

    CryptoGates takes a different approach from most of the tools on this list.

    There’s no signup wall, no credit card, and no capital required to start testing. You open the DCA, Grid, or Rebalance Backtest Bot and run your strategy against real historical market data right away.

    Built the platform around one belief: verify first, risk later, scale slowly. The backtest bots exist so traders can prove a strategy works before a single dollar touches the market.

    ZAHEER, CEO CryptoGates

    What Makes CryptoGates’ Backtest Bots Different

    The bots run on real 1-minute OHLCV data pulled from major exchanges, not simplified daily candles that smooth over the messy parts.

    That matters because a lot of what actually breaks a strategy, like slippage during a fast move or a bad fill during high volatility, only shows up when the data is granular.

    You can test a DCA setup against a 40% drawdown, run a Grid bot through months of sideways chop, or stress a strategic asset allocation using the Rebalance Backtest Bot against sudden asset divergence. All without paying for the privilege of finding out your idea doesn’t hold up.

    Real Backtest Example

    Strategy: Grid
    Coin: XRP/USDT
    Market Condition: Flat, near-zero net price movement over 90 days
    Objective: Test whether a grid strategy can extract profit from a market with no clear directional trend

    Key Result: XRP opened and closed the 90-day window almost unchanged, yet the grid bot fired 875 trades and returned a 27.74% net gain, while a buy-and-hold position on the same capital earned close to nothing.

    Expert Interpretation: This is the blind spot most traders have about grid bots — the strategy isn’t betting on price going up or down, it’s betting on price moving at all. A backtest that only checks trending markets would completely miss this, which is exactly why granular, realistic data matters more than a single headline ROI number.

    View Complete Playbook: https://cryptogates.io/playbooks/xrp-grid-bot-returned-27-74-in-90-days-while-buy-hold-made-0-24/

    Other Crypto Backtesting Software Options Overview

    There are solid paid platforms out there too, and pretending otherwise wouldn’t be honest. They just come with tradeoffs CG doesn’t have.

    Does free backtesting software give accurate results?

    It depends entirely on data quality and whether fees and slippage are modeled. Free doesn’t mean inferior if the underlying data and cost modeling are done right.

    Popular Paid Backtesting Platforms and Their Use Cases

    Some platforms are built around Python or Pine Script, giving advanced users full control to code custom indicators and logic from scratch. In contrast, if you are looking to deploy rules-based accumulation without coding, learning how to backtest a DCA bot manually on a visual interface can save you weeks of coding setup.

    If you are coding custom indicators, the documentation provided directly by TradingView serves as the gold standard for structuring Pine Script logic to model complex price metrics.

    That’s powerful, but it’s also a wall for anyone who doesn’t already know how to program.

    Others focus heavily on prop-firm-style testing, simulating strict drawdown rules for traders chasing funded accounts.

    A few are general-purpose charting platforms with a backtesting feature bolted on, useful if you’re already living inside that ecosystem for other reasons, but not built specifically for crypto’s weird hours and volatility patterns. Each one solves a real problem.

    None of them solves every problem for every trader, which is kind of the whole point of this comparison.

    Side-by-Side Crypto Backtesting Software Comparison

    Numbers make this easier than opinions. Here’s how CryptoGates stacks up against typical paid platforms across the criteria that actually matter.

    Swipe to view full data →
    Criteria CryptoGates Typical Paid Platforms
    Cost to start testing Free, no signup, no card Often $30 to $100+ monthly
    Data granularity 1-minute OHLCV, major exchanges Varies, sometimes daily candles only
    Fee and slippage modeling Built into backtest bots Varies by platform, often extra setup
    Coding required None Frequently required for full features
    Best suited for Beginners through intermediate Advanced, custom-strategy builders
    John von Neumann
    “There’s no sense in being precise when you don’t even know what you’re talking about.”

    John von Neumann

    That line was about math, not crypto, but honestly, it fits perfectly here.

    A backtest that looks precise down to the decimal point means nothing if the underlying data or fee model was never realistic in the first place.

    Precision without accuracy is just noise dressed up as confidence.

    Where CryptoGates Wins on Value

    Zero cost to test unlimited strategies is a real advantage, not a marketing line.

    Beginners and budget-conscious traders get the exact same data quality and fee modeling that a paid platform would charge for, without the barrier of a subscription standing between them and their first real strategy test.

    Where Paid Tools Offer Advanced Features

    To be fair, some paid platforms do offer things CG doesn’t.

    Custom scripting in Python or Pine Script gives advanced users room to build indicators from scratch.

    If you’re already deep into quant-style strategy design and need that flexibility, a paid tool might be worth the cost. That’s a small slice of traders, though.

    Most people never touch those features even when they’re paying for them.

    Best Crypto Backtesting Software by User Type

    Let’s break this down by who you actually are, not who the marketing assumes you are.

    Pre-Trade Strategy Audit

    • Best for beginners: A free, no-code tool with clear results and simple setup
    • Best for budget-conscious traders: A platform offering unlimited free tests with real historical data
    • Best for advanced traders: A tool with custom scripting and raw data export
    • Best for automation-focused users: A platform that connects tested strategies directly to execution

    Wait,

    That last point deserves a bit more context.

    Automation readiness isn’t just about having a “connect to exchange” button.

    It’s about whether the backtest itself accounted for the same fees and conditions the live bot will face. If those two don’t match, you’re automating a strategy that was never actually validated.

    Best for Beginners

    If you’ve never backtested anything before, complexity is your enemy.

    A free tool with a clean interface removes the two biggest reasons beginners quit before they learn anything: cost anxiety and confusion.

    Best for Budget-Conscious Traders

    This one’s simple.

    Why pay for testing when the free version gives you the same real data and the same fee modeling?

    Save the money for when you’re actually ready to deploy capital, not for the testing phase.

    Best for Advanced Traders

    If you’re running multi-variable strategies with custom logic, a scripting-capable paid tool might genuinely serve you better.

    There’s no shame in that. Different tools for different jobs.

    Best for Automation-Focused Users

    Look for a platform where the backtest bot and the execution layer speak the same language.

    CryptoGates’ DCA, Grid, and Rebalance Backtest Bots are built with that connection in mind. For example, you can review our historical BTC Grid Bot Backtest results from volatile months to see how fee modeling directly affects real trading metrics.

    Final Verdict: Choosing the Right Crypto Backtesting Software

    Here’s the simple truth.

    The best crypto backtesting software isn’t the one with the most features or the biggest name. It’s the one that proves whether your strategy actually holds up before you risk a single dollar on it.

    For most traders, especially beginners and anyone watching their budget, that means starting with a free, real-data option before ever reaching for a paid subscription.

    CryptoGates gives you that starting point. No signup, no credit card, no capital needed. Just open the DCA, Grid, or Rebalance Backtest Bot and see what your strategy actually does against real market history.

    If you eventually outgrow it and need custom scripting or institutional-grade tooling, that’s a fine reason to move to a paid platform. But test that assumption first instead of assuming it.

    FAQs

    Is crypto backtesting software worth using before live trading?

    Yes. It replaces guesswork with evidence, showing how a strategy would’ve handled real market conditions before any capital is at risk.

    Yes, several tools including CryptoGates require no coding at all. You set parameters, run the test, and read the results.

    Accuracy depends on data quality and fee modeling, not price. A free tool with real historical data and realistic slippage can outperform a paid one that skips those details.

  • Grid Trading Strategy 📊 Guide: Choose the Right Grid Type 🎯 for Maximum ROI 💰

    Grid Trading Strategy 📊 Guide: Choose the Right Grid Type 🎯 for Maximum ROI 💰

    Most traders pick a grid trading strategy the same way they pick a coin. Something looked good on a chart, ser, and they hit go.

    Here’s the problem.

    A grid trading strategy isn’t one thing. It’s a family of five different approaches, each built for a different kind of market, and using the wrong one is exactly how a “safe” strategy turns into a slow bleed.

    This guide skips the bot mechanics you’ve probably already read elsewhere. It’s about the decision layer:

    Which grid type fits your market, how to size it, and

    How actually to calculate whether it’s working.

    CryptoGates built its Strategy Lab around exactly this kind of comparison, so traders stop guessing and start testing.

    EXECUTIVE SUMMARY
    • The Problem: Traders default to whichever grid type feels familiar instead of matching the strategy to actual market conditions.
    • The Solution: A structured framework for choosing arithmetic, geometric, spot, futures, or AI grid strategies based on data, not habit.
    • The Incentive: Correctly matched strategy types show measurably better ROI-to-drawdown ratios across ranging markets.
    • The Risk: A mismatched grid strategy compounds losses just as systematically as a matched one compounds gains.

    What Is a Grid Trading Strategy?

    Look,

    if you’ve read a general “what is grid trading” guide already, this part will feel familiar on purpose. Because a grid trading strategy isn’t a single mechanic. It’s a decision framework that sits on top of that mechanic.

    Here’s the reframe that matters. Every grid trade uses buy-low-sell-high logic within a range.

    But which range, which spacing, and which capital structure you choose is where the real strategy lives.

    That’s what this guide covers.

    According to figures cited by trading platform InvestX, grid strategies have shown reported monthly returns in the 3% to 8% range, though outcomes depend heavily on setup quality and market fit.

    That gap between 3% and 8% is basically the difference between a lazy configuration and a tested one.

    The Five Grid Trading Strategy Types — Deep Comparison

    Most beginners think there’s just “grid trading.”

    There isn’t.

    There are five distinct strategy types, and picking one because it sounds exciting instead of because the data supports it is the first mistake almost every trader makes.

    Honestly, this is where CT tends to get it backwards. People ape into futures grids because leverage sounds fun, then wonder why they got rekt during a trend.

    The type you choose should follow your market read, not your mood.

    Arithmetic Grid Strategy

    An arithmetic grid spaces every level by an equal dollar amount.

    If your range is $200 wide with 10 grids, each level sits $20 apart, no exceptions.

    The formula is simple: (Upper Bound − Lower Bound) ÷ Grid Count = Spacing.

    This works well on assets with a tight, low-price range where percentage moves stay small and predictable. Think stablecoin pairs or majors during quiet consolidation.

    Geometric Grid Strategy

    A geometric grid spaces levels by a fixed percentage instead.

    A 2% spacing setting means each level sits 2% above the last, not $2 or $20.
    This matters more than it sounds like it should.

    On a wide-range asset like BTC, arithmetic spacing gets weirdly lopsided near the top of the range.

    Geometric spacing keeps every level proportionally meaningful, which is why experienced grid traders tend to prefer it for high-price-range assets.

    Spot Grid Strategy

    Choose a spot when capital preservation outranks upside. You’re trading real assets, no leverage, no liquidation risk hanging over your position.

    This is a profile decision more than a technical one. If losing sleep over a margin call sounds miserable, the spot is where you start.

    Futures Grid Strategy

    Futures grids add leverage, which means bigger theoretical returns and a much shorter runway before things go wrong.

    The core mechanics don’t change. The consequences of a bad range absolutely do.

    Only run this once you’ve tested a spot version of the same strategy first. Liquidation risk isn’t a footnote here; it’s the whole game.

    AI Grid Strategy

    This is the one that actually changes the decision-making model. A traditional grid is static. You set the range once, and it holds until you intervene.

    An AI grid adjusts.

    It reads volatility signals, momentum shifts, maybe funding rate data, and nudges spacing or range boundaries in response.

    “Adaptive” is the accurate word here, not “smart,” because it’s still following rules. Just more responsive ones.

    “Trading is not about being right or wrong. It’s a probability game.” Mark Douglas, Trading Psychology Author (Source: Trading in the Zone)

    That line applies directly here. Choosing a grid type isn’t about picking the “correct” one. It’s about picking the one with better odds for the market you’re actually in.

    Is a grid trading strategy the same as a grid bot?

    Not quite. A grid bot is the execution tool that runs the trades. A grid trading strategy is the decision layer above it: which type, which range, which spacing you choose before the bot ever runs.

    Arithmetic vs Geometric Grid — Which One Fits Your Market?

    Here’s the thing most guides skip. This isn’t really a “which is better” question.

    It’s a “which matches your asset’s price behavior” question, and the answer changes depending on the pair.

    If your range is under 10% of the asset’s price, arithmetic and geometric spacing look almost identical anyway.

    The difference only shows up once you’re working with wide ranges or genuinely volatile assets, and that’s exactly where picking wrong starts costing you.

    Swipe to view full data →
    Factor Arithmetic Grid Geometric Grid
    Spacing Logic Equal dollar gaps Equal percentage gaps
    Best Fit Tight range, low-price assets Wide range, high-priced assets
    Calculation Simple, fixed Slightly more complex, scales with price

    Best Market Conditions for Each Grid Strategy Type

    A generic “grid trading works in sideways markets” line doesn’t actually help anyone deploy correctly.

    Different grid types want different flavors of sideways, and mixing them up is where the strategic mistakes start.

    Low volatility, tight consolidation.

    This is arithmetic’s home turf. Predictable spacing works because the price isn’t doing anything dramatic between levels.

    Wide-range chop on a high-priced asset. Geometric earns its keep here. BTC oscillating across a few thousand dollars needs percentage-based logic, or the spacing gets distorted near the top of the range.

    Choppy, uncertain conditions with shifting volatility. This is where AI grid strategies start to matter. Static spacing can’t keep up when the character of the chop keeps changing week to week.

    Mild uptrend with patience on your side. A long-biased spot grid fits here, capturing oscillation while still holding some directional exposure.

    Honestly, most losses in this game don’t come from a bad grid type. They come from using a decent grid type in the wrong condition and refusing to admit the market changed underneath it.

    Real Backtest Example

    Strategy: Grid (geometric spacing)
    Coin: XRP/USDT
    Market Condition: Near-flat, 90-day range ($2.08 → $2.09)

    Objective: Extract profit from range-bound chop with no directional bias
    Key Result: 875 trades executed, $1,817.91 gross grid profit, $1,387.14 net — a 27.74% return, while a buy-and-hold position over the same 90 days returned just 0.24%.

    Expert Interpretation: This is close to a textbook case for tight, low-volatility consolidation — the exact condition where a well-spaced grid earns its keep independent of market direction.

    The near-zero net price movement meant buy-and-hold had almost nothing to offer, while the grid’s repeated fills inside a narrow band did the work. It’s a useful reference point for why spacing discipline matters more than market direction in genuinely quiet conditions.

    Full backtest: https://cryptogates.io/playbooks/xrp-grid-bot-returned-27-74-in-90-days-while-buy-hold-made-0-24/

    How to Set Grid Trading Parameters — The Strategic Framework

    This is where traders either build something durable or set themselves up to lose slowly and predictably. Not the range itself. The reasoning behind it.

    Ryan Sean Adams
    Crypto rewards those who understand structure, not just sentiment. Grid type selection is a structure. Everything else is guessing dressed up as conviction.

    Ryan Sean Adams, co-host of the Bankless podcast

    Choosing the Price Range Strategically

    Your range should sit on real support and resistance, not a round number that looks convenient.

    Zoom out. Find where the price has actually reversed more than once, not just where it happened to stop last week.

    A range that’s too tight breaks on the first real move. Too wide, and you’re waiting weeks for a single grid to fill. There’s a balance in there, and it’s specific to the asset, not a fixed rule you can copy-paste.

    Selecting Grid Count — The Trade-off Math

    More grids mean more trades, smaller profit per trade, and more fee exposure. Fewer grids mean the opposite on every count.

    Here’s a simple way to think about it.

    If your total range is $1,000 and you pick 20 grids, each level is $50 apart. Drop that to 10 grids, and each level doubles to $100, fewer fills, but each one is worth more.

    Neither is “correct.”

    It depends on how active you want the strategy to be and what your fee structure can absorb.

    Grid Spacing vs Fee Threshold Formula

    Wait,

    this part gets skipped constantly, and it’s probably the single most common reason a “working” strategy quietly loses money.

    Your spacing has to clear your round-trip fee by a real margin, not just barely.

    A rough threshold traders use: spacing should be at least 3 times your round-trip fee percentage.

    If your fee is 0.2% round trip, your spacing needs to comfortably clear 0.6%, or you’re running a busy bot that isn’t actually profitable.

    Capital Allocation Logic

    How much of your total trading capital goes into one grid strategy on one pair? That’s the real decision, not the grid count.

    At CryptoGates, we tell traders the same thing every time. Don’t size a position based on how confident you feel. Size it based on what you can afford to have locked up for weeks if the range holds longer than expected. Verify first. Risk later. Scale slowly.

    Zaheer – CEO Cryptogates

    A common starting point is capping any single grid strategy at 5% to 10% of total trading capital until you’ve got verified performance data behind it.

    Not because that number is magic. Because it keeps one bad range from meaningfully damaging your whole portfolio.

    Understanding ROI in Grid Trading — Full Breakdown

    Most traders check one number. Total profit.

    That’s not ROI, and treating it like ROI is how a losing setup gets mistaken for a winning one.

    The actual formula looks like this: ROI = (Realized Profit + Unrealized Position Value − Fees) ÷ Capital Deployed.

    Notice unrealized value is in there. Ignore that part, and your ROI is basically fiction.

    Here’s a quick worked example. Say you deployed $2,000 on a BTC grid strategy. Realized profit after 30 days sits at $85.

    Unrealized position value, meaning what your currently held BTC is worth compared to what you paid for it, is negative $40 because the price drifted slightly below your average entry. Fees came to $12.

    Realized ROI alone would look like ($85 − $12) ÷ $2,000, or about 3.65%. Total ROI, the honest number, is ($85 − $40 − $12) ÷ $2,000, which comes out closer to 1.65%. Same bot. Same trades.

    Very different picture depending on which number you’re looking at.

    The mistake that trips up almost everyone: judging ROI without judging drawdown alongside it. A strategy that made $200 but dipped $600 underwater along the way carries a completely different risk profile than one that made $200 smoothly.

    The number on the surface can be identical. What happened underneath it wasn’t.

    Reality Check

    Common belief: many traders assume that if a grid bot is firing trades and generating “grid profit,” the strategy is automatically winning.

    What CryptoGates research found: in a live backtest tracking a major-cap grid strategy through a 33% post-ATH drawdown, the bot generated $163.94 in real grid profit across 171 trades — yet total ROI still landed at −21.64%. The grid mechanism itself worked exactly as designed; it was the underlying price collapse below the range floor that erased the gains on paper.

    Why it matters: grid profit measures how well the bot executed its logic, not whether the position as a whole made money. A trader who only checks “did my bot trade a lot” without checking unrealized losses on the held asset is looking at half the picture — the same gap this guide’s ROI formula is built to close.

    Full backtest: https://cryptogates.io/playbooks/grid-bot-vs-a-33-bnb-crash-what-the-backtest-data-actually-shows/

    How to Use a Grid Trading Calculator

    A calculator won’t predict the market. What it does is stop you from deploying a setup that was broken from the start, before a single dollar goes live.

    Does grid spacing matter more than grid count?

    Yes, more than most beginners realize. Spacing determines whether your fees eat your profit. Count just determines how often you trade within that same spacing.

    What Inputs You Need

    Price range, meaning your upper and lower bounds.

    Grid count: how many levels sit inside that range.

    Order size, or how much capital lands on each level.

    Fee rate: your exchange’s actual round-trip cost.

    And historical volatility, which tells you roughly how often the price is likely to move between your levels.

    Get any one of these wrong, and the output becomes meaningless. Garbage in, garbage out applies here just like anywhere else.

    What Outputs You Should Review

    Expected profit per cycle tells you what one completed round trip is worth after fees.

    Total order count over your test period shows activity level. Fee-adjusted ROI is the number that actually matters, not the gross figure before costs.

    Capital efficiency shows whether your money is working hard enough to justify sitting in this strategy instead of somewhere else.

    Here’s the uncomfortable stat behind all of this.

     Independent testing on automated grid setups has found that a strategy showing 1% daily returns on paper can shrink to roughly 0.2% net after fees and slippage are properly accounted for, an 80% degradation between the backtest and reality.

    (Source: TradingView Hub Research)

    Worked Example Using a Calculator

    Say you’re testing ETH between $2,800 and $3,200, with 8 grids and $1,600 total capital.

    That puts $200 per grid level and $50 spacing between each.

    Plug in a 0.1% round-trip fee and moderate historical volatility, and a decent calculator should show you something like this:

    roughly 6 to 10 completed cycles per week in a ranging market, a fee-adjusted profit per grid of around $1.20 to $1.60, and a projected monthly return somewhere in the low single digits.

    Not exciting. That’s kind of the point.

    CryptoGates’ Strategy Lab lets you run comparisons like this across different grid types before committing real capital, so the numbers above are a starting point to test against, not a promise.

    Common Strategic Mistakes (Not Execution Mistakes)

    These aren’t the “forgot to set a stop-loss” mistakes.

    Those live elsewhere.

    These are the mistakes that happen before the bot even starts running, at the decision level.

    Interactive Checklist: Before You Commit to a Grid Type

    Pre-Trade Strategy Audit

    • Confirm the current market condition actually matches your chosen grid type
    • Run the ROI formula with unrealized value included, not just realized profit
    • Check drawdown alongside ROI, never look at one without the other
    • Run your settings through a calculator before deploying real capital
    • Set a rule for when you’ll switch or pause if the market regime shifts

    Picking arithmetic spacing on a high-volatility asset is a common one.

    The spacing gets distorted near the range edges and the strategy quietly underperforms what geometric would’ve done on the same pair.

    Judging ROI without drawdown is another.

    A strategy can look profitable on the surface while sitting on unrealized losses that never get accounted for until it’s too late to adjust cheaply.

    And here’s the one that costs traders the most over time. Not switching grid type when the market regime changes.

    What worked during three months of chop can start bleeding the moment the asset finds a real trend, and sticking with the same static setup out of habit is how a decent strategy turns into a slow leak.

    How to Choose the Right Grid Strategy for Your Profile

    There’s no universal best grid strategy.

    There’s only the one that matches your risk tolerance, your experience, and your actual read on the market right now.

    Beginner and conservative? Start with a spot arithmetic grid on a liquid major pair.

    Simple spacing, no leverage, room to learn without your first mistake being an expensive one.

    Comfortable with a volatile asset and want better spacing logic? Geometric grid earns its place here, especially on anything with a wide price range like BTC.

    Want something hands-off that adjusts without you babysitting it constantly? AI grid fits that profile, assuming you’ve accepted that “adaptive” still means rule-based, not magic.

    Advanced, leverage-literate, and comfortable with liquidation math?

    Futures grid, but only after a spot version of the same strategy has already proven itself.

    Larry Fink, BlackRock
    “Over time, staying invested has mattered far more than getting the timing right.”

    Larry Fink, CEO, BlackRock (Source: 2026 Chairman’s Letter)

    That logic applies to grid strategy choice too. Picking a type that fits your profile and sticking with it through a proper test period beats chasing whichever grid type had a good week on CT.

    How CryptoGates Supports Grid Strategy Selection

    Deciding between arithmetic, geometric, spot, futures, or AI isn’t a decision you should be making blind.

    CryptoGates’ Strategy Lab lets traders run side-by-side comparisons across grid types before committing capital to any one of them.

    The point isn’t picking a “winner” once and forgetting it. It’s testing how each type would’ve performed across different market conditions, ranging, trending, choppy, so the choice reflects data instead of a feeling you had on a Tuesday.

    That comparison layer sits above the execution side covered in CryptoGates’ Grid Backtest Bot guide. Strategy selection first. Execution settings after.

    Who Should Use Which Grid Strategy

    Beginner traders get the most value from a structured spot approach.

    Arithmetic, tight range, small capital, nothing leveraged. The goal here isn’t maximum return.

    It’s learning how the mechanics actually behave with real money on the line, even if that amount is small.

    Intermediate traders, especially ones comfortable reading volatility and range structure, tend to graduate toward geometric spacing or start experimenting with AI-adjusted parameters.

    This is where the “which condition fits which type” framework from earlier actually starts paying off.

    Advanced traders who understand leverage, liquidation mechanics, and multi-strategy capital splits can combine futures grids with AI adjustment.

    That’s not a starting point for anyone. It’s where you end up after a spot grid has already proven the underlying logic works.

    A 2026 Traders Union survey of active retail crypto traders found that 63% don’t use stop-loss protections at all, and that same gap in discipline tends to show up in grid deployment too, no defined exit, no plan for what happens if the range breaks.

    (Source: Traders Union Research)

    Conclusion

    Grid Trading Strategy Is a Framework, Not a Guess

    A grid trading strategy was never really about the bot.

    It’s about the decision that happens before the bot ever runs, which type fits this market, how it’s sized, and whether the numbers actually support the choice or just feel right.

    Arithmetic, geometric, spot, futures, AI grid. Five tools, five different jobs. Picking based on data instead of excitement is what separates a strategy that survives from one that quietly bleeds.

    ROI without drawdown is half a picture. A calculator before deployment is the difference between testing an idea and gambling on one.

    Verify first. Risk later. Scale slowly.

    Once you’ve picked your strategy type, CryptoGates’ Grid Backtest Bot guide walks through the execution side, settings, range, and live deployment mechanics.

    FAQs

    Is a grid trading strategy profitable long term?

    It can be, but only when the type matches the market condition and fees are accounted for honestly. Treat it as a tested framework, not a passive income guarantee.

    A spot arithmetic grid on a liquid, tight-range pair. It’s the simplest mechanic to understand and carries no leverage risk while you learn.

    Whenever the market regime clearly shifts, ranging to trending or the reverse. Sticking with a static type out of habit is a common way profitable setups turn into slow losses.

  • Advanced Crypto Trading Strategies 📊 Every Professional Trader Should Master 🎯 for Smarter Risk Management 🛡️

    Advanced Crypto Trading Strategies 📊 Every Professional Trader Should Master 🎯 for Smarter Risk Management 🛡️

    Most traders open a chart, see one green candle, and hit buy.

    Six months later, they’re wondering where the account went.

    Honestly, that’s not bad luck. That’s what happens when you trade on a feeling instead of a plan.

    Advanced crypto trading strategies exist because the traders who actually stick around stopped guessing a long time ago.

    They built rules.

    They tested those rules against real data before risking a single dollar. And they took their own emotions almost completely out of the decision.

    A survey of 1,005 retail crypto traders found that 84% lost money in their first year, with 58% losing nearly all of it, and day trading was named as the single biggest cause. (NFTEvening survey, 2025)

    That’s not a small number.

    That’s most people.

    This piece breaks down the frameworks that separate the traders who compound their capital from the ones who become someone else’s exit liquidity, quantitative trading, algorithmic trading, momentum, breakout, and trend following, and shows exactly why professionals lean on them.

    EXECUTIVE SUMMARY
    • The Problem: Most retail traders enter crypto with no system, react to hype and fear in real time, and lose money in predictable, repeatable ways.
    • The Solution: Professional traders use structured, testable frameworks, quant models, algorithms, momentum, breakout, and trend systems, built on data instead of emotion.
    • The Incentive: A tested strategy can be run with consistency across market cycles, protecting capital while compounding gains slowly instead of chasing one lucky trade.
    • The Risk: Even good frameworks fail without risk management. No strategy on this list removes the need to size positions and cut losses properly.

    What Makes a Crypto Trading Strategy “Advanced”?

    Here’s the thing people get wrong first: “advanced” doesn’t mean complicated.

    It doesn’t mean fifteen indicators stacked on one chart. An advanced strategy is simply one that’s rule-based, repeatable, and backed by data instead of a hunch.

    Think about the difference this way.

    A random entry is: “This looks like it’s about to pump.”

    An advanced entry is:

    “This setup has triggered under these exact conditions X number of times, and here’s what happened after.”

    One is a guess dressed up as confidence.

    The other is a strategy edge, something a trader can point to, test, and repeat.

    Mark Douglas,
    “Trading is not about being right or wrong. It’s a probability game.”

    Mark Douglas, author of Trading in the Zone

    That’s really the whole idea behind systematic trading. You’re not trying to predict the future perfectly.

    You’re trying to find a market inefficiency, or an edge, that plays out in your favor often enough over time to be profitable, and then you execute it the same way every single time.

    HISTORICAL DATA AUDIT

    Battle-Test Your Strategy
    Before the Market Does.

    Eliminate guesswork with institutional-grade backtesting for DCA, Grid, and Rebalance bots. Real historical data. Real-world results.

    EST. OPTIMIZATION +42% ROI Efficiency
    Start Backtest Now

    Sourced from 5+ Years of Exchange Data

    Wait, that last part matters more than people think. Most retail traders do have decent ideas sometimes.

    What kills them is inconsistency, following the plan on Monday and abandoning it on Friday because the chart “felt different.”

    Advanced traders remove that variable almost entirely.

    They backtest first, define their risk controls before entering, and track performance like it’s a business, because for them, it is.

    That’s the foundation everything else in this piece builds on.

    Once a strategy is defined, testable, and repeatable, it stops being a guess. It becomes a system. And systems, not predictions, are what actually survive crypto’s volatility.

    Algorithmic Trading for Crypto Professionals

    Algorithmic trading is just quant trading with a job title change; code executes the rules instead of a human clicking buy.

    Once a strategy is proven, it gets turned into a bot that runs the plan exactly as written, every time, without hesitation.

     Nansen’s 2025 data found that over 80% of crypto trading volume is now executed by bots rather than manual human trades.

    That number should tell you something.

    This isn’t a niche tactic anymore. It’s how most of the market actually trades.

    Bots connect to exchanges through an API, watch price action around the clock, and fire trades in milliseconds, something no human, no matter how caffeinated, can match at 4 am.

    Common Types of Crypto Algorithms

    Most crypto bots fall into a few recognizable families.

    Trend-following algorithms ride an established direction until it breaks—momentum-based algorithms chase acceleration.

    Breakout detection algorithms wait for the price to break out of a range.

    And mean reversion systems bet that the price snaps back after stretching too far from average.

    SYSTEM ACCESS: CG4.2

    Stop Guessing.
    Stress Test Your Edge.

    The market doesn’t care about your backtest. Our engine simulates 1,000+ “what-if” scenarios to ensure your strategy is built for survival.

    Run Crypto Strategy Engine →
    ROBUSTNESS SCORE
    75+ STRUCTURAL EDGE
    RISK OF RUIN < 1%
    TARGET HIT 92%

    Why Algorithmic Trading Matters

    Look, the biggest edge isn’t speed. It’s emotional removal.

    A bot doesn’t revenge trade after a red candle. It doesn’t hold a losing position in hopes of a win.

    It removes emotional mistakes entirely and executes faster than any manual click ever could.

    It can also watch multiple markets at once, something a single trader physically can’t do.

    But here’s the catch nobody likes to admit: a bot running a bad strategy just loses money faster and more efficiently than a human would.

    Automation doesn’t fix a flawed plan. It just executes it with more discipline than you’d bring on your own.

    Research Insight

    Discipline is easy to claim and hard to measure – until execution data is put next to it. In a proprietary backtest tracking a DCA bot through a token that pumped 36% and then bled back into a 17% loss, 139 of 140 individual sessions still closed in profit, even as the underlying asset round-tripped through a full reversal.

    The bot didn’t react to the pump or panic during the bleed; it simply executed the same step logic in both directions.

    That gap between “the asset lost value” and “the system still converted most of its sessions into profit” is the practical version of what this article calls emotional removal. It’s not that automation predicts reversals – it’s that it doesn’t need to, because it never abandoned the plan halfway through one.

    View Complete Playbook: https://cryptogates.io/playbooks/tao-dca-bot-made-1677-while-spot-holders-lost-17/

    Momentum Trading Strategies

    Momentum is one of the oldest ideas in trading, and it still works because crowd psychology hasn’t changed much.

    Strong price movement tends to keep moving, at least for a while, and momentum traders are built to catch that window.

    Here’s what actually matters with momentum: it’s not about being early.

    It’s about confirmation.

    Professionals wait for acceleration, rising volume, and continuation before they commit capital, not just a single green candle that might fade in ten minutes.

    Mark Douglas,
    “Anything can happen. You don’t need to know what’s going to happen next to make money.”

    Mark Douglas, Trading in the Zone

    1. Momentum Entry Signals

    A few signs tend to show up together before a real momentum move:

    Strong candle bodies instead of thin wicks, rising trading volume backing the price action, a pattern of higher highs and higher lows, and sometimes a news or sentiment catalyst behind the whole thing.

    2. Momentum Risk Management

    Momentum trades move fast, so the risk controls need to move fast, too.

    Tighter stop losses matter here more than in slower strategies. Avoid entering too late after a big move already run, that’s exit liquidity territory, not opportunity.

    And take partial profits as the move extends, because momentum reverses just as sharply as it starts.

    Wait, one more thing worth saying plainly: momentum isn’t a bull market exclusive tool.

    It shows up in bear market rallies, too. The mechanics don’t care about direction.

    Breakout Trading Strategies

    Breakout trading is exactly what it sounds like.

    Price sits inside a tight range for a while, coiling up, and then it explodes through resistance or support.

    Professionals build entire systems around catching that expansion cleanly, not chasing it three candles late.

    Backtested breakout models across major exchanges show that setups confirmed by a volume increase and a retest of the broken level perform significantly better than breakouts entered on the first close alone.
    TradingView

    Here’s the issue most retail traders run into. They see one big green candle punch through resistance and ape in immediately.

    Sometimes it works. A lot of the time, it’s a fakeout, and they’re the exit liquidity for whoever set the trap.

    1. How to Spot a Real Breakout

    A real breakout usually leaves a trail of evidence behind it, not just one candle.

    Price needs to close above resistance, or below support, not just wick through it.

    Volume increases at the same time, confirming real participation instead of a thin, low-liquidity move.

    Often, the market retests that broken level before continuing, treating old resistance as new support.

    And the overall structure shows real expansion after a period of consolidation, not just one isolated spike.

    2. Best Conditions for Breakout Trading

    Breakout systems tend to perform best under specific conditions. Tight, well-defined ranges give the cleanest signals.

    Low volatility building up beforehand, that quiet-before-the-storm feel, often precedes the sharpest moves.

    Strong catalysts or an existing trend already in motion tend to produce breakouts that actually follow through instead of fading.

    What Is a Real Crypto Breakout?

    A real breakout closes beyond the level on rising volume and holds after a retest, unlike a fakeout, which reverses back into the range almost immediately.

    Honestly, chop is where most breakout strategies get clapped.

    Sideways, directionless markets throw off fakeout after fakeout, testing a trader’s patience and their stop losses at the same time.

    Trend Following Strategies

    Trend following is the strategy equivalent of not fighting the current.

    Instead of trying to predict when a move will reverse, professionals simply ride the direction that’s already established, for as long as the structure holds.

    That discipline matters here specifically.

    Trend following isn’t exciting most of the time. It’s watching a chart grind higher or lower, without needing to call the exact top or bottom.

    Sara’s data work on CG’s backtesting side reflects this, too; the strategies that hold up longest tend to be the ones that don’t try to be clever.

    1. Tools Used in Trend Following

    Trend traders lean on a fairly small, consistent toolkit.

    Moving averages help smooth out noise and show direction.

    Trendlines mark structure visually.

    ADX measures whether a trend actually has strength behind it, not just direction.

    And price action confirmation, higher highs and higher lows, or the reverse in a downtrend, ties it all together.

    CONFIDENTIAL // RESEARCH
    STRATEGY INTELLIGENCE

    Proven Setups &
    Expert Breakdowns.

    We don’t just show you the data; we engineer and validate high-performance strategies, providing the “Alpha” behind the numbers.

    2. Why Trend Following Works in Crypto

    Crypto trends tend to run longer than people expect.

    That’s kind of the whole point.

    A strong narrative, once it takes hold on CT, can drive extended moves well past where “smart money” originally expected.

    Trend following lets a trader capture a large chunk of that run without needing to nail the exact entry or exit.

    Bulls stay euphoric, bears stay cynical, but the traders who actually profit from trends usually feel a little bored the whole way through. Send it, but with a plan attached.

    Test this setup yourself → cryptogates.io.

    Risk Management Used by Professional Traders

    None of this works without risk control.

    Not quant models, not algorithms, not the cleanest breakout setup on the chart.

    Here’s the thing nobody wants to hear: the strategy is only half the equation. What happens when it’s wrong matters just as much.

    Professional risk managers commonly cap individual trade risk at 1-2% of total account capital, a standard cited across institutional trading and portfolio risk research to keep any single loss from threatening the account.

    That’s a small number on purpose.

    It means a losing streak, and every strategy has one, but it doesn’t wipe out months of gains in an afternoon.

    Position sizing, stop loss placement, and a hard cap on maximum drawdown aren’t the exciting part of trading.

    But they’re the part that decides whether a trader is still around in twelve months.

    Before You Risk Capital

    • Define your max risk per trade before entering, not after
    • Set a stop loss level before the trade, not once it’s already losing
    • Know your maximum acceptable drawdown for the week or month
    • Confirm your position size matches your risk tolerance, not your excitement
    • Review your risk-reward ratio, don’t enter if it doesn’t make sense on paper

    1. Why Capital Preservation Comes First

    Here’s the uncomfortable truth.

    A 50% loss needs a 100% gain just to break even.

    That math punishes big losses far more than it rewards big wins, which is exactly why downside protection sits at the center of every professional’s process, not as an afterthought bolted on later.

    LIVE DATA FEED // UNFILTERED

    The Truth in Numbers.

    Designed for the 10% who require absolute clarity. We strip away the hype to reveal the structural reality of the crypto markets.

    11.6M TOKENS DEFUNCT (2025)
    “The Illusion of the Infinite Pump.” Most assets are designed to fail. We track the ones that don’t.
    ⚠ Shocking Crypto Statistics

    2. Position Sizing and Portfolio Risk

    Position sizing isn’t glamorous, but it’s doing more work than most traders realize.

    Two traders can run the same strategy and get completely different outcomes just based on how much they risk per trade.

    Backtest before deployment, and that includes testing how your sizing holds up across a losing streak, not just the winning one.

    How Professional Traders Combine Strategies

    Look, almost nobody running real capital sticks to just one strategy.

    That’s kind of a myth that retail traders believe because it makes things feel simpler.

    In reality, professionals treat quant models, algorithms, momentum, breakout, and trend following as tools in a kit, not a single hammer for every situation.

    Strategy Fit by Market Condition

    Swipe to view full data →
    Market Regime Strategy That Tends to Fit What It’s Looking For
    Strong trending market Trend following, momentum Continuation, higher highs/lows
    Tight, sideways range Breakout, mean reversion Compression before expansion
    High uncertainty Quant filters, algorithmic risk rules Confirmation before commitment

    The smarter approach is filtering by market regime and volatility first, then choosing which strategy actually fits what’s happening right now.

    A momentum system fired off during chop is going to get whipsawed constantly.

    That’s not the strategy failing; that’s the wrong tool for the current market.

    CG STRATEGY ANALYZER

    Confused about
    market outlook?

    Trading without a plan is just gambling. Our strategy architect analyzes your risk tolerance and capital to match you with a proven algorithmic framework.

    PASSIVE DCA Bot
    AGGRESSIVE Grid Pro
    BALANCED Rebalance

    This is where a hybrid trading system earns its name.

    Confluence, when two or more signals agree, tends to filter out a lot of the noise that traps retail traders chasing single indicators.

    Sajid’s research work on CG’s strategy side leans on this same idea: strategy stacking isn’t about complexity for its own sake, it’s about not betting everything on one read of the market.

    Stop guessing. Start engineering.

    Run your own parameters and see what the data shows through CryptoGates’ Strategy Engine before committing real capital to any combination.

    Real Backtest Example

    Strategy: Grid
    Coin: XRP/USDT
    Market Condition: Flat, near-zero net movement over 90 days
    Objective: Test whether a range-bound strategy can extract value when price direction offers none

    Key Result: XRP opened and closed the window virtually unchanged (0.24% for a buy-and-hold position), while the grid bot fired 875 trades and returned 27.74% net over the same period.

    Expert Interpretation: This is the market-regime-fit table above, made concrete. A trend-following or momentum system would have found almost nothing to work with in this window — there was no trend to follow. A grid system was built for exactly this condition, and the result gap (0.24% vs 27.74%) is less about one strategy being “better” and more about matching the tool to the regime, the exact discipline this section argues professionals apply before choosing anything.

    View Complete Playbook: https://cryptogates.io/playbooks/xrp-grid-bot-returned-27-74-in-90-days-while-buy-hold-made-0-24/

    Common Mistakes Retail Traders Make

    Most retail losses aren’t bad luck.

    They’re the same five mistakes showing up again and again, dressed up differently each cycle.

    Copying strategies without understanding them tops the list.

    Someone posts a “proven setup” on CT, and traders ape in without knowing why it worked, or under what conditions it stops working.

    Trading momentum too late is next, jumping in after the move already runs, becoming exit liquidity for whoever got in first.

    Backtesting research consistently shows that over-optimized strategies, ones curve-fit to perform perfectly on past data, tend to underperform or fail once deployed on new, unseen market conditions.

    Ignoring risk management is the quiet killer.

    No stop loss, no position sizing plan, just vibes and hope.

    Using breakout entries without confirmation gets traders caught in fakeouts constantly; that first green candle isn’t proof; it’s a maybe.

    And over-optimizing systems without real-world testing rounds out the list, a strategy that looks flawless in a backtest can still get clapped the moment live conditions shift even slightly.

    Honestly, none of these mistakes requires bad market conditions to hurt you. They’ll cost money in a bull run, a bear market, or a dead sideways chop. That’s kind of the point.

    REF: VOL-NEUTRAL-2026

    Neutralize Volatility.
    Own the Growth.

    Access systematic playbooks designed to eliminate emotional bias. From Spot HODL frameworks to advanced Grid simulators.

    ◒
    Spot & HODL
    ◈
    DCA Engine
    ▦
    Grid Tactics
    ☯
    Rebalance

    How to Build Your Own Advanced Crypto Trading Framework

    Here’s the thing. You don’t need all five strategies from this article running at once. That’s not the goal, and trying to do that on day one is how most people burn out fast.

    Start with one strategy and one market condition.

    Pick something specific, momentum in a trending market, say, and get familiar with it before adding complexity. Backtest it using historical data before risking anything real.

    Define clear rules for entries, exits, and risk before you ever place a live trade, not while you’re already in one and emotions are running the show.

    “I didn’t build CryptoGates for people chasing the next 10x. I built it for traders who want to verify their edge before they risk real capital, then scale slowly once the data backs them up.”

    ZAHEER, CEO CryptoGates

    Review performance and refine the system over time.

    This part never really ends. Markets shift, and a framework that worked last cycle might need adjusting for this one.

    Add automation only after the logic is proven, not before. A bot executing an untested idea just loses money faster than you would by hand.

    Slow, steady, and tested beats fast, exciting, and unverified. Every time.

    Advanced Strategies Work Because They’re Structured, Not Because They’re Secret

    None of the strategies in this article is hidden knowledge.

    Quantitative trading, algorithmic trading, momentum, breakout, and trend following are all well-documented.

    What separates professionals from retail isn’t access to secret information; it’s discipline, testing, and risk management applied consistently over time.

    FAQs

    What is the safest advanced crypto trading strategy for beginners to study first?

    Trend following tends to be the easiest starting point. It requires patience over speed, and the rules are simple enough to backtest quickly.

    Most use a mix, but bots handle the bulk of execution today; over 80% of crypto trading volume runs through automated systems.

    There’s no fixed number. What matters more is testing your strategy on historical data first, before deciding how much capital to risk live.

  • Why Most Crypto Trading Strategies Fail 📉 and How to Match the Right Strategy 🎯 to Your Risk ⚠️, Capital & Personality

    Why Most Crypto Trading Strategies Fail 📉 and How to Match the Right Strategy 🎯 to Your Risk ⚠️, Capital & Personality

    Ser, be honest with yourself for a second.

    How many times have you copied a strategy from CT without checking if it actually fits you?

    Most beginners do this.

    They see a “100x gem” call or a fancy grid setup screenshot, and they just ape in.

    84% of new crypto traders lose money within their first year, and the two biggest reasons are poor research and pure FOMO, not bad luck.

    (NFTevening survey)

    Here’s the thing, though: a crypto trading strategy that works for a whale with deep pockets and zero emotions might completely wreck a shrimp account with small capital and shaky hands.

    Picking the right one isn’t about finding the “best” strategy.

    It’s about finding the one that fits your risk, your capital, and, honestly, your personality too.

    EXECUTIVE SUMMARY
    • The Problem: Most traders pick a crypto trading strategy based on hype, not on whether it actually fits their risk tolerance, capital, or personality.
    • The Solution: Match your profile first, then choose a strategy type, then test it before risking real money.
    • The Incentive: A strategy that fits you feels less stressful and holds up over time instead of falling apart the first time the market gets choppy.
    • The Risk: Ignoring this step usually means panic selling, overtrading, or quitting the strategy right before it would’ve worked.

    Why Choosing the Right Strategy Matters

    Look, no single crypto trading strategy works for every trader, and it definitely doesn’t work the same way in every market condition.

    A grid bot that prints beautifully in a chopping, sideways market can bleed you dry the moment BTC breaks trend, the same trap our grid bot ran into during BTC’s April surge.

    Mark Douglas,
    “The consistency you seek is in your mind, not in the markets.”

    Mark Douglas : Trading Psychologist & Author of Trading in the Zone

    Here’s the part most people skip.

    When your strategy doesn’t match who you actually are, you don’t just get average returns.

    You start making emotional exits.

    You close winning trades too early because you’re nervous, or you hold losers way too long because admitting the mismatch feels worse than the loss itself.

    Strategy choice affects returns, sure, but it also affects your stress level and your consistency, which honestly matter just as much over time.

    CG STRATEGY ANALYZER

    Confused about
    market outlook?

    Trading without a plan is just gambling. Our strategy architect analyzes your risk tolerance and capital to match you with a proven algorithmic framework.

    PASSIVE DCA Bot
    AGGRESSIVE Grid Pro
    BALANCED Rebalance

    The Cost of a Mismatched Strategy

    A wrong-fit strategy rarely fails because the logic was bad.

    It fails because the trader couldn’t emotionally sit through it.

    Constant second-guessing, panic exits, and switching strategies mid-drawdown, that’s the real cost, and it’s a big reason 97% of day traders lose money within their first year.

    “Traders are humans who can’t ignore their emotions…”

    Saad Naja, Founder & CEO of PiP World

    Understand Your Risk Tolerance

    Risk tolerance is just a fancy way of asking one question.

    How much red can you actually watch on your screen before you do something dumb?

    Some traders can sit through a 30% drawdown without blinking. Others start panic selling at 8%.

    Neither one is wrong; it’s just data about you, and your risk profile should be the first filter you run any strategy through, not the last.

    What is the best crypto trading strategy for beginners?

    For most beginners, DCA is the easiest starting point. It’s simple, low-stress, and doesn’t require constant monitoring or perfect timing.

    This is exactly the kind of question CG’s Strategy Picker leads with, too, because guessing your own risk tolerance is where most people get it wrong.

    1. Low-Risk Traders

    Prefer simple, structured setups built around capital protection over speed.

    Slower growth, fewer surprises. DCA, trend-following, or conservative swing strategies usually fit best here.

    2. Medium-Risk Traders

    Can handle moderate volatility without falling apart.

    Breakout, momentum, or hybrid strategies work, but only with firm stop losses and real position sizing, not vibes.

    3. High-Risk Traders

    Comfortable with scalping, leverage, or advanced algorithmic setups.

    This group can survive faster, sharper drawdowns, but it demands strict discipline and fast execution.

    No room for hesitation here.

    Match Strategy to Your Capital

    Honestly, this one gets ignored a lot.

    People pick a strategy based on what looks good on a chart, not on what their actual account size can survive.

    But capital size changes everything about what’s practical.

    Fees eat small accounts alive. Liquidity matters more than people think.

    And position sizing that works fine for a whale account, feels reckless for a shrimp account running the same setup.

    CONFIDENTIAL // RESEARCH
    STRATEGY INTELLIGENCE

    Proven Setups &
    Expert Breakdowns.

    We don’t just show you the data; we engineer and validate high-performance strategies, providing the “Alpha” behind the numbers.

    Wait, here’s the part that trips up beginners specifically.

    They see a strategy backtest with big returns and copy it exactly, without adjusting for their own capital allocation.

    That’s how small accounts get wrecked by trade efficiency problems nobody warned them about.

    1. Small Capital

    Keep it simple here. Focused strategies win.

    DCA or selective swing trading tends to be more realistic than running five bots at once.

    Overtrading and excessive diversification are the two silent killers of small accounts.

    2. Medium Capital

    This is where flexibility opens up a bit.

    You can run more than one strategy, split risk across a couple of setups, and actually test refinements without blowing up the whole account on one bad call.

    3. Large Capital

    Bigger accounts can support broader diversification, portfolio balancing, and even full automation across multiple bots.

    But honestly, bigger capital means bigger consequences if risk management is weak. It demands stronger controls, not less.

    If you’re not sure where your capital fits, running a few scenarios through CG’s Backtest Bots shows pretty quickly what’s realistic for your account size before you commit real money.

    Know Your Trading Personality

    The simple truth is, most people never sit down and actually think about how they handle uncertainty.

    Some traders like fast action and constant decisions.

    Others prefer setting something up once and letting it run quietly in the background.

    Neither style is better. What matters is knowing which one you are before you build around the wrong one.

    Self-awareness here does more for consistency than any indicator ever will.

    That’s not a hot take, it’s just how emotional discipline works in practice.

    1. Patient Traders

    Fit long-term approaches best.

    DCA, trend following, and position trading, these all reward people who don’t need constant screen time to feel in control.

    “The biggest edge isn’t finding a secret strategy, it’s actually knowing yourself well enough to stick with a decent one.”

    ZAHEER, CEO CryptoGates

    2. Active Traders

    Like frequent decisions and market interaction.

    Breakout, momentum, or intraday systems suit this type, but it takes real discipline to avoid turning “active” into impulsive.

    3. Analytical Traders

    Thrive on data, rules, and structure.

    Systematic or quant-style setups fit naturally here, and this group usually gets the most out of backtesting and optimization tools.

    How do I know which trading strategy fits my personality?

    Look at how you already react to red candles. If watching charts stresses you out, you’re probably a patient trader, not an active one.

    Common Crypto Trading Strategy Types

    Now let’s break this down properly.

    Every strategy style out there serves a different kind of trader, and honestly, most people never run a proper crypto trading strategy comparison before picking one.

    They just go with whatever’s trending on CT that week.

    Swipe to view full data →
    Strategy Best Fit For Market Condition
    DCA Patient, low-stress investors Any, especially bear/chop
    Trend Following Traders riding big moves Strong directional trend
    Breakout Trading Fast expansion catchers Range breaking into trend
    Momentum Trading Active, quick-reacting traders High volume, strong moves
    Algorithmic/Systematic Data-driven, rule followers Any, if rules are tested

    1. DCA Strategy

    Best for patients, low-stress investors focused on long-term accumulation. No need to time anything, ser.

    Real Backtest Example

    Strategy: DCA (Dollar-Cost Averaging Bot)
    Coin: BTC/USDT
    Market Condition: Sideways-to-bearish, slow-bleed month
    Objective: Test small-step accumulation in a low-volatility, low-conviction market

    Key Result: Across an 8-session test window where BTC drifted down roughly 2%, the DCA bot closed 7 of 8 sessions in profit, returning +1.93% overall.

    Expert Interpretation: This is the kind of market condition low-risk, patient traders are most likely to encounter — no clear trend, no dramatic swings, just quiet chop.

    The data suggests DCA’s edge isn’t in spotting direction; it’s in removing the need to guess direction at all. The one losing session in the set is arguably more instructive than the winners, since it shows what happens when price simply doesn’t cooperate.

    View Complete Playbook:

    BTC Fell 2% in March — Our DCA Bot Made +1.93% Anyway

    2. Trend Following

    Best for traders who want to ride major directional moves.

    Works well in a strong bullish or bearish structure, not so much in chop.

    Roughly 89% of retail traders rely on lagging indicators that tend to fail during high volatility.

    CoinGecko research cited in industry trading reports.

    3. Breakout Trading

    Best for catching fast expansions out of a range. Needs confirmation, though, chasing every fakeout gets expensive fast.

    4. Momentum Trading

    Best for active traders who can react quickly to strength and volume. This one relies heavily on speed and discipline, not luck.

    5. Algorithmic or Systematic Trading

    Best for data-driven traders running tested, repeatable rules instead of gut feeling.

    This is where backtesting actually earns its keep.

    Put It All Together: Risk, Capital & Personality

    Here’s the thing.

    None of these three filters works well on its own.

    Your risk tolerance tells you how much pain you can sit through.

    Your capital tells you what’s actually practical.

    Your personality tells you whether you’ll stick with the plan on a bad week. Line all three up, and a strategy stops being a guess.


    Swipe to view full data →
    Filter Question It Answers Example Fit
    Risk Tolerance How much red can I handle? Low risk → DCA
    Capital What’s realistic for my account size? Small capital → focused, single strategy
    Personality Will I actually stick with this? Patient trader → long-term, low-monitoring setups

    Peter, the trader we’re about to walk through below, lines up as low risk, standard capital, and a patient personality.

    That combination is exactly why DCA becomes his top match, not luck, not a random pick.

    How to Use CG Strategy Picker Step by Step

    Most traders never even get this far.

    They can’t answer one simple question first. Which strategy actually fits me?

    That’s the real problem CG’s Strategy Picker solves, and let’s walk through it with a real profile.

    Meet Peter.

    He wasn’t chasing anything dramatic, just wanted a strategy that actually matched how he trades, not another random call from CT.

    1. Answer the 10 Profile Questions

    Peter opened CG’s Strategy Picker and answered honestly.

    Sideways market outlook, low trading frequency, conservative risk tolerance under 5%, standard capital of around a thousand dollars plus, and monitoring time once a week.

    Ser, that’s kind of the whole point of this quiz, honesty over ego.

    2. Review Your Architecture Match

    Once he hit submit, the Picker returned his match. Top recommendation:

    DCA Strategy at a 99% match score, tagged as automated accumulation over set intervals.

    Grid Strategy came in right under it as a Balanced Option at 96%, mostly because his sideways read fit that style too.

    Peter picked Backtest instead of jumping to Execute, and that’s the smarter move for most beginners.

    Here’s the thing, though.

    A 99% match score means the strategy fits Peter.

    It doesn’t yet mean the strategy survives real market conditions.

    That’s a separate question, and it’s exactly what comes next.

    Research Highlight

    One pattern shows up consistently across CryptoGates’ Grid Playbooks: grid strategies tend to perform best precisely in the conditions where directional strategies struggle most — flat, range-bound markets with no clear trend.

    In one 60-day test, SOL drifted sideways with no meaningful net movement. A grid bot running through that dead zone still fired 146 trades, generated $462.95 in net profit, and outperformed simple buy-and-hold by +10.88%.

    This matters for anyone weighing a “Balanced” match score between DCA and Grid: the deciding factor usually isn’t risk appetite, it’s the trader’s read on market structure. Grid strategies extract value from range-bound noise that DCA and trend-based strategies typically can’t capture.

    View Complete Playbook:

    SOL’s “Institutional Purgatory” — Grid Bot Backtest (Mar–Apr 2026)

    How to Stress Test Your Strategy in CG Strategy Engine

    So Peter carried that same profile into CG’s Strategy Engine, not to guess again, but to see if the DCA setup actually holds up under pressure once the market gets messy.

    SYSTEM ACCESS: CG4.2

    Stop Guessing.
    Stress Test Your Edge.

    The market doesn’t care about your backtest. Our engine simulates 1,000+ “what-if” scenarios to ensure your strategy is built for survival.

    Run Crypto Strategy Engine →
    ROBUSTNESS SCORE
    75+ STRUCTURAL EDGE
    RISK OF RUIN < 1%
    TARGET HIT 92%

    1. Set Your Controls and Run the Simulation

    He kept it close to real:

     Half Kelly position sizing, Normal market regime matching his sideways outlook, starting capital around $2,000, target near $3,500.

    One click on “Test My Strategy” runs thousands of randomized trade sequences instead of one clean backtest.

    That’s the actual stress test, not a static prediction.

    2. Read the Survival Analysis

    Peter’s Robustness Score came back at 94, well above the 75+ professional target.

    Risk of Ruin sat at 1.0%. Target Hit Probability reached 99.0%.

    CryptoGates’ own recommendation confidence read 46.8%, moderate confidence, meaning solid, not a guaranteed lock.

    That’s really the difference between guessing and verifying.

    The Picker told Peter what fits him.

    The Engine told him whether what fits him can actually survive.

    Step-by-Step Process to Choose a Strategy

    Alright, let’s break this down into something you can actually use instead of just thinking about it.

    Strategy Selection Checklist

    • Know your risk tolerance first, not last
    • Check your real available capital, not your dream capital
    • Identify your trading personality honestly
    • Match that profile to one strategy type
    • Test it before you go anywhere near real money

    That’s the whole decision framework. Skip a step and the whole thing gets shaky fast.

    Mistakes Traders Make When Choosing a Strategy

    Here’s where things usually go wrong, and ngl, most of these mistakes repeat themselves across every market cycle.

    Choosing a strategy because it’s trending on CT instead of because it fits you.

    Ignoring capital limitations and running a whale-sized strategy on a shrimp account.

    Using a high-stress, fast strategy when your personality is clearly the patient type. Skipping backtesting entirely because it “feels obvious” that the strategy works.

    And probably the most common one, switching strategies every few weeks without ever collecting enough data to know if the last one was actually failing or just going through a normal drawdown.

    None of these is a market problem.

    They’re all decision problems, and decision problems are fixable.

    REF: VOL-NEUTRAL-2026

    Neutralize Volatility.
    Own the Growth.

    Access systematic playbooks designed to eliminate emotional bias. From Spot HODL frameworks to advanced Grid simulators.

    ◒
    Spot & HODL
    ◈
    DCA Engine
    ▦
    Grid Tactics
    ☯
    Rebalance

    Best Strategy Match Examples

    Seeing this in action makes it click faster than any theory ever could. Let’s look at three quick profiles.

    1. Conservative Beginner

    Low risk, small capital, patient personality.

    Best match:

    DCA or a simple swing strategy. Nothing fancy, just consistent.

    2. Active Mid-Level Trader

    Medium risk, moderate capital, analytical mindset.

    Best match: breakout or momentum strategy, with real stop losses in place.

    3. Advanced Data-Driven Trader

    Higher risk tolerance, larger capital, structured thinking.

    Best match:

    Algorithmic or trend-based systematic trading, built on tested rules, not gut feel.

    How to Validate Your Choice

    Okay, so you’ve picked a strategy that actually fits you.

    Don’t automate it yet.

    That’s the mistake that gets skipped the most.

    Vitalik Buterin
    “In the long run, security matters more than speed. That mindset applies here, too. Rushing a strategy into live trading before it’s proven is how good ideas turn into rekt accounts.”

    Vitalik Buterin, co-founder of Ethereum

    This is basically the whole point of why CG’s tools exist in the first place, verify the thing before you scale it.

    Knowledge Check

    Which trading strategy is generally the best fit for someone with low risk tolerance and limited time to monitor the market?

    Backtest it first.

    Start small once you go live, not big.

    Track both your results and your emotions, because a strategy can look fine on paper and still wreck your nerves in practice.

    Only adjust after you’ve collected enough real data, not after one bad week.

    Choosing a Strategy That Actually Fits You

    At the end of the day, the best crypto trading strategy isn’t the one with the flashiest backtest screenshot.

    It’s the one that matches your risk tolerance, your actual capital, and honestly, your personality too.

    Get those three things aligned, and the strategy stops feeling like a fight against yourself.

    That’s really the whole game.

    Systems over speculation, every time.

    HISTORICAL DATA AUDIT

    Battle-Test Your Strategy
    Before the Market Does.

    Eliminate guesswork with institutional-grade backtesting for DCA, Grid, and Rebalance bots. Real historical data. Real-world results.

    EST. OPTIMIZATION +42% ROI Efficiency
    Start Backtest Now

    Sourced from 5+ Years of Exchange Data

    If you’re still not sure where you land, CG’s Strategy Picker takes maybe two minutes and gives you a starting point instead of a guess.

    And once you’ve got a candidate strategy, running it through the Strategy Engine shows you whether it holds up or whether it was just a lucky backtest.

    Stop guessing.

    Start engineering.

    No signup.

    No credit card.

    Just build at cryptogates.io.

    FAQs

    What’s the easiest crypto trading strategy for a beginner with small capital?

    DCA is usually the easiest starting point. It needs less monitoring and doesn’t punish small accounts with overtrading.

    Both need at least a medium risk tolerance. You’ll need to sit through moderate volatility without panic exiting.

    Yes, always. Backtesting shows whether a strategy actually holds up before you risk a single dollar on it.

  • Best Crypto Trading Strategies for Every Market Condition (🐂 Bull, 🐻 Bear & ↔️ Sideways)

    Best Crypto Trading Strategies for Every Market Condition (🐂 Bull, 🐻 Bear & ↔️ Sideways)

    You bought the dip.

    Then it dipped again. Then again. Sound familiar?

    Here’s the thing.

    Most traders don’t lose because they picked a bad coin.

    They lose because they used a bullish strategy in a bearish market, or tried to grid trade a trend that never stopped running.

    The best crypto trading strategies aren’t universal, they’re situational.

    What works when BTC is ripping will get you rekt in a chop zone.

    A 2025 NFTEvening survey of 1,005 retail crypto traders found 84% lose money and fail within their first year, and 58% lose almost all their money in that first year.
    NFTEvening survey, Nov 2025 – nftevening.com

    Honestly, that’s the part nobody tells beginners.

    The market doesn’t punish you for being wrong about direction.

    It punishes you for using the wrong playbook for the conditions you’re actually in.

    EXECUTIVE SUMMARY
    • The Problem: Traders apply one strategy across every market phase, then wonder why it stops working the moment conditions shift from trend to chop.
    • The Solution: Match your strategy type, trend-following, defensive, or range-based, to the actual market structure you’re trading in right now.
    • The Incentive: Fewer blown accounts, more consistent execution, and a repeatable process you can actually backtest before risking capital.
    • The Risk: Crypto markets shift fast. A strategy that fits today’s regime can become a liability within weeks if you don’t reassess. This isn’t financial advice, it’s a framework to test yourself.

    Understanding Crypto Market Conditions

    Every crypto cycle repeats the same three phases.

    Bull, bear, chop. Most traders can name them.

    Fewer can actually spot which one they’re in right now, and that gap is where money gets lost.

    “Past results don’t equal future returns, so every backtest should be treated as guidance, not a promise.”

    Coin Bureau

    Here’s the thing.

    Price action alone won’t tell you the full story.

    You need volume, momentum, and structure working together before you can call a market condition with any confidence.

    How to Spot a Bull Market

    Higher highs, higher lows, buyers stepping in on every dip.

    That’s bullish structure in its simplest form.

    Volume expands on green candles and shrinks on red ones.

    Bulls are defending hard, and every pullback gets bought fast.

    HISTORICAL DATA AUDIT

    Battle-Test Your Strategy
    Before the Market Does.

    Eliminate guesswork with institutional-grade backtesting for DCA, Grid, and Rebalance bots. Real historical data. Real-world results.

    EST. OPTIMIZATION +42% ROI Efficiency
    Start Backtest Now

    Sourced from 5+ Years of Exchange Data

    RSI holding above the midline for extended stretches is another tell.

    So is price staying glued above key moving averages.

    When breakouts hold instead of faking out, that’s your confirmation.

    Ser, that’s when the bullish crypto strategy playbook comes out.

    How to Spot a Bear Market

    Flip it.

    Lower highs, lower lows, selling pressure that doesn’t let up.

    Support levels break instead of holding.

    Bounces feel weak, and they get sold into almost immediately.

    Momentum indicators stay pinned below neutral.

    Sentiment turns negative fast, and rallies start looking like exit liquidity for anyone still holding on hope.

    This is where a bearish crypto strategy earns its keep, not the one you used three weeks ago during the pump.

    How to Spot a Sideways Market

    Chop.

    No other word for it.

    Price bounces inside a range, testing the same support and resistance zones over and over without committing to a direction.

    Bollinger Bands tighten. Volatility drops.

    Breakout attempts fail and snap right back into the range.

    Honestly, this phase frustrates trend traders the most, but it’s exactly where a sideways crypto strategy, built around range logic instead of direction, starts to shine.

    Best Crypto Trading Strategies for Bull Markets

    When BTC starts printing green candles back to back, the whole vibe on CT shifts.

    Everyone’s suddenly a trading genius.

    But here’s the thing, bull market strategies actually have structure behind them, not just vibes and “send it” energy.

    Trend-following and breakout setups work here because momentum is doing the heavy lifting for you.

    CONFIDENTIAL // RESEARCH
    STRATEGY INTELLIGENCE

    Proven Setups &
    Expert Breakdowns.

    We don’t just show you the data; we engineer and validate high-performance strategies, providing the “Alpha” behind the numbers.

    1. Trend Following Crypto Strategy

    This one’s simple in theory, brutal in execution.

    You ride the trend using moving averages as your guide, entering when price stays above key averages and momentum confirms strength.

    The best crypto trading strategy in a strong uptrend isn’t complicated. It’s disciplined.

    “Trend followers don’t predict tops. They just refuse to fight the direction until structure breaks,”

    CG Research Analyst

    Ser, the hard part isn’t spotting the trend.

    It’s staying in it without panic selling on every 5% pullback.

    Weak hands get shaken out constantly during real bull runs.

    Diamond hands who trust their system tend to capture the bigger moves.

    2. Breakout Trading Strategy Crypto

    Breakouts look exciting on a chart.

    Price coils near resistance, volume builds, then it rips through.

    But not every breakout is real. Fakeouts happen constantly, especially when retail gets baited into buying the top of a liquidity sweep.

    Volume confirmation matters here more than people admit.

    A breakout without volume is probably nothing.

    A breakout with expanding volume and a clean candlestick close above resistance?

    That’s giga bullish, and worth testing before you size in.

    3. Pullback Buying Strategy

    Not every entry needs to be at the breakout.

    Sometimes the smarter move is waiting for the dip on support, using Fibonacci retracement zones and RSI oversold signals to time it.

    This is basically structured BTFD, minus the emotional chaos.

    Which crypto trading strategy is best for a bull market?

    Trend-following and breakout strategies tend to perform best in bull markets, since momentum and volume confirmation work in your favor. Pullback buying can add better entries within that trend.

    Look, buying dips without a plan is gambling.

    Buying dips at confirmed retracement zones with RSI confluence is a strategy.

    The difference matters more than people think.

    You can actually stress test these bull market setups yourself using the CryptoGates Strategy Engine before deploying real capital.

    Verify first. Risk later.

    Best Crypto Trading Strategies for Bear Markets

    Nobody wants to talk about bear markets.

    It’s the part of the cycle where CT goes quiet and the moonboys disappear.

    But here’s the thing, bear markets are where disciplined traders actually separate from the herd.

    The whole game shifts from chasing gains to protecting what you’ve got.

    Crypto trading strategies for bear market conditions aren’t about calling the bottom.

    They’re about risk managed crypto trading, full stop.

    Capital preservation becomes the actual goal, not an afterthought.

    CG STRATEGY ANALYZER

    Confused about
    market outlook?

    Trading without a plan is just gambling. Our strategy architect analyzes your risk tolerance and capital to match you with a proven algorithmic framework.

    PASSIVE DCA Bot
    AGGRESSIVE Grid Pro
    BALANCED Rebalance

    1. Defensive Portfolio Strategy

    When the charts turn red for weeks straight, rotating into stablecoins isn’t cowardice.

    It’s strategy.

    A solid crypto portfolio strategy during downtrends means reducing exposure to high-beta alts and parking capital where it won’t bleed out with every red candle.

    Ngl, this feels boring compared to bull market ape-ins.

    But boring is exactly what keeps your account alive long enough to buy the next cycle’s opportunities.

    2. Short Selling and Advanced Crypto Trading Strategies

    This one’s not for beginners.

    Advanced crypto trading strategies like shorting require tight stop losses, careful position sizing, and a real understanding of trend continuation.

    One bad liquidation cascade against you and it’s game over fast.

    Coinrule’s platform data shows traders who use structured stop-loss and position-sizing rules during backtesting see how their risk controls would have protected capital during major drawdowns before going live.

    Coinrule, “Free Backtesting Platform” data page, Feb 2026

    Honestly, most retail traders shouldn’t be shorting at all.

    But for those who understand the mechanics, it’s one more tool in a bear market playbook that stablecoin-only strategies can’t offer.

    3. DCA Strategy in Strong Assets

    Here’s where patience actually pays.

    Dollar cost averaging into fundamentally strong assets during a downtrend lowers your average entry without requiring you to time the exact bottom, which, let’s be real, nobody consistently does.

    SYSTEM ACCESS: CG4.2

    Stop Guessing.
    Stress Test Your Edge.

    The market doesn’t care about your backtest. Our engine simulates 1,000+ “what-if” scenarios to ensure your strategy is built for survival.

    Run Crypto Strategy Engine →
    ROBUSTNESS SCORE
    75+ STRUCTURAL EDGE
    RISK OF RUIN < 1%
    TARGET HIT 92%

    This is one of the more profitable crypto trading strategies precisely because it removes the emotional guesswork.

    You’re not trying to be a hero.

    You’re just showing up consistently while everyone else is busy panic selling or coping about their bags.

    You can actually simulate this yourself using the CryptoGates DCA Simulator before committing real capital to a downtrend accumulation plan.

    Real Backtest Example

    Strategy: DCA
    Coin: DOT/USDT
    Market Condition: 7-month downtrend, 56% decline
    Objective: Lower average entry into a fundamentally strong asset during sustained weakness

    Key Result: 79 of 80 DCA sessions closed in profit, returning +$380.99, while a spot holder on the same capital sat on a −$617 loss, a $998 gap in outcomes.

    Expert Interpretation: The data here separates disciplined accumulation from panic-driven exits. A trader manually trying to time DOT’s bottom across seven months of grinding downside would likely have capitulated somewhere along the way.

    The bot didn’t need to call the bottom, it just kept buying at defined intervals, letting the averaging mechanism absorb the volatility. This is the practical case for DCA-into-strength during bear conditions: it removes the emotional decision of “is this the bottom” entirely.

    View Complete Playbook: https://cryptogates.io/playbooks/how-a-dca-bot-made-381-while-polkadot-lost-56/

    Best Crypto Trading Strategies for Sideways Markets

    Chop is brutal for trend traders.

    Price goes nowhere for weeks, breakouts fail, and anyone trading like it’s a bull run gets chewed up.

    Crypto trading strategies for sideways market conditions need a completely different mindset.

    Range-based and mean-reversion approaches take over here.

    1. Range Trading Strategy

    Buy near support, sell near resistance, repeat.

    It sounds almost too simple, but that’s the point.

    Range trading works because it respects market structure instead of fighting it.

    Look, the tricky part is patience.

    You’re waiting for price to hit the edges of the range again and again, resisting the urge to chase moves in the middle where the risk to reward just isn’t there.

    2. Grid Trading Strategy

    This is where automation earns its keep.

    Grid trading captures small, repeated profits inside a defined range without needing to predict direction at all.

    The bot just does its job, buying low and selling high within the grid, over and over.

    Backtested grid strategies during extended consolidation phases have historically outperformed manual range trading in execution consistency.

    That consistency is the whole appeal.

    No emotional interference, no missed entries because you stepped away from the charts.

    Real Backtest Example

    Strategy: Grid
    Coin: SOL/USDT
    Market Condition: 60-day sideways drift, post-crash range between $80–$97
    Objective: Extract repeated profit from range-bound price action without predicting direction

    Key Result: Over the 60-day window, the grid bot executed 146 trades and generated $462.95 in net profit, outperforming a buy-and-hold position by 10.88%.

    Expert Interpretation: This backtest illustrates why grid trading is structurally suited to chop. SOL didn’t trend in either direction during the test window, conditions that typically punish trend-followers, but the range itself became the source of profit.

    Each swing between support and resistance triggered a buy-sell cycle, compounding gains that a static holder simply couldn’t access. The result reinforces a core principle of range trading: in sideways markets, volatility is the opportunity, not the risk.

    View Complete Playbook: https://cryptogates.io/playbooks/sol-usdt-grid-bot-backtest-mar-apr-2026/

    3. Mean Reversion Strategy

    Overbought and oversold zones are the bread and butter here.

    When RSI spikes into extreme territory and Bollinger Bands stretch wide, mean reversion traders are watching for that snap back toward the average.

    What is the best crypto trading strategy for a sideways market?

    Range trading and grid trading tend to work best in sideways markets since they profit from repeated price movement instead of a clear trend. Mean reversion adds another layer for catching extremes.

    This isn’t about catching every move.

    It’s about picking off high-probability reversals with confirmation, not just guessing that “it’s gone too far” and hoping.

    You can stress test any of these range-based setups using the CryptoGates Grid Simulator to see how they would’ve performed across real historical chop.

    Which Strategy Fits Which Market?

    Here’s the truth nobody likes admitting.

    The best crypto strategy isn’t a fixed answer.

    It’s a moving target that depends entirely on what phase the market’s actually in. Ser, that’s it. That’s the whole secret.

    Bull market?

    Trend following, breakout trading, pullback buying. Bear market?

    Capital preservation, DCA into strength, careful short setups for those who actually know what they’re doing.

    Sideways market?

    Range trading, grid trading, mean reversion. Match the tool to the condition, not the other way around.

    Quick Match Table

    Swipe to view full data →
    Market Condition Best Strategy Types Core Focus
    Bull Market Trend Following, Breakout, Pullback Ride Momentum
    Bear Market Defensive, DCA, Short (Advanced) Preserve Capital
    Sideways Market Range, Grid, Mean Reversion Capture Volatility

    Look, this isn’t about memorizing a chart.

    It’s about training yourself to ask “what condition am I actually in” before you ask “what trade should I take.”

    Most traders skip straight to the second question.

    That’s kinda where things go wrong.

    Risk Management in Crypto Strategies

    You can have the best crypto trading strategy on the planet and still blow your account.

    How?

    No stop loss. No position sizing. No plan for when things go against you, which, let’s be honest, they eventually will.

    “I’ve watched traders nail the direction and still lose money because they sized in wrong or had no exit plan. Verify first. Risk later. Scale slowly isn’t just a slogan, it’s math,”

    ZAHEER, CEO CryptoGates

    Risk management isn’t the boring part of trading.

    It’s the actual alpha. Anyone can pick a direction.

    Surviving long enough to compound gains over time, that’s the hard part.

    Why Emotional Discipline Beats Technical Skill

    Here’s what actually matters more than your indicator setup.

    Can you follow your own rules when the chart moves against you?

    Most traders can’t. Fear kicks in, they exit early.

    Greed kicks in, they hold too long.

    Market volatility doesn’t cause most losses.

    Emotional reaction to volatility does.

    An academic study on retail trading behavior found a wide majority of retail traders lose money, with figures ranging between 68% and 97% across markets in Europe, the UK, Australia, India, and the US, largely tied to overtrading and emotional decisions.

    Yieldfund research summary, May 2026

    That’s kind of the whole point of backtesting before you go live.

    You’re not just testing whether a strategy works.

    You’re testing whether you can actually sit through the drawdowns without touching the panic button.

    Common Mistakes to Avoid

    Ngl, most of these mistakes aren’t complicated. They’re just repeated.

    Over and over. Cycle after cycle.

    Using a bullish crypto strategy in a bear market is probably the biggest one.

    Traders get comfortable with what worked last quarter and keep running it even after the structure flips.

    Bulls are defending nothing anymore, but the trader’s still buying every dip like it’s still send-it season.

    REF: VOL-NEUTRAL-2026

    Neutralize Volatility.
    Own the Growth.

    Access systematic playbooks designed to eliminate emotional bias. From Spot HODL frameworks to advanced Grid simulators.

    ◒
    Spot & HODL
    ◈
    DCA Engine
    ▦
    Grid Tactics
    ☯
    Rebalance

    Ignoring crypto market trends is another classic.

    Price action tells you what phase you’re in if you actually look. Skip that step and you’re basically trading blind, hoping instead of reading.

    Overtrading during a consolidation phase burns accounts quietly.

    Chop doesn’t reward activity.

    It rewards patience.

    But sitting still feels boring, so traders force entries in the middle of the range where risk to reward is garbage.

    Trading Without Backtesting or Optimization

    Here’s the uncomfortable part.

    Deploying a strategy without testing it first isn’t trading.

    It’s gambling with extra steps.

    You wouldn’t invest in a business without checking if it’s ever made money, right? Same logic applies here.

    “Industry backtesting audits show a large portion of unadjusted backtests contain hidden bias or leakage, causing live results to fall far below reported figures.”
    Blockchain Council, “Backtesting AI Crypto Trading Strategies,” April 2026

    Look, the fix is simple even if it feels tedious.

    Run your setup against historical data first.

    See how it holds up across different regimes, not just the one that made it look good in your head.

    How to Build an Adaptive Crypto Strategy

    The traders who actually survive multiple cycles aren’t the ones with the flashiest setup.

    They’re the ones who adapt.

    An adaptive crypto strategy isn’t one strategy.

    It’s a process for switching between strategies based on what the market’s actually doing.

    That means testing constantly.

    Journaling every trade, win or loss, and being honest about why it worked or didn’t.

    Most traders skip this part because it’s unglamorous. But it’s kinda the whole game.

    Combining Technical Indicators with Sentiment and Trend Analysis

    Technical indicators alone miss half the picture.

    Combine RSI and moving averages with sentiment data, funding rates, and broader macro trend, and suddenly your read on the market gets sharper.

    Here’s the thing.

    None of this needs to be perfect.

    It just needs to be tested, repeatable, and honest about what actually happened last time you ran it.

    You can build and stress test your own version of this process using the CryptoGates Strategy Engine before touching real capital.

    Match the Strategy, Not Just the Market

    Here’s the simple truth.

    There’s no such thing as the one strategy that wins every cycle.

    Bulls reward trend following.

    Bears reward patience and defense.

    Chop rewards range logic. That’s it.

    That’s the whole framework.

    LIVE DATA FEED // UNFILTERED

    The Truth in Numbers.

    Designed for the 10% who require absolute clarity. We strip away the hype to reveal the structural reality of the crypto markets.

    11.6M TOKENS DEFUNCT (2025)
    “The Illusion of the Infinite Pump.” Most assets are designed to fail. We track the ones that don’t.
    ⚠ Shocking Crypto Statistics

    Look, most traders don’t fail because they’re bad at crypto.

    They fail because they keep running yesterday’s playbook in today’s market.

    The traders who actually survive multiple cycles are the ones who ask “what condition am I in” before they ask “what should I buy.”

    CryptoGates built its Strategy Picker exactly for this problem, matching your risk profile and market outlook to a strategy type instead of leaving you to guess.

    Test this setup yourself → cryptogates.io.

    FAQs

    What’s the best crypto trading strategy for beginners?

    Start with DCA or spot buy and hold. Both remove emotional timing decisions and let you build conviction slowly while you learn to read market structure.

    Not really. Trend following works in bulls, defensive strategies fit bears, and range or grid strategies suit chop. Matching the strategy to the condition is what matters most.

    Backtesting shows you how a strategy performed across real historical data, including drawdowns and losses, before you risk actual capital on it.

  • Crypto Rebalancing Bot 📊: Stop Portfolio Drift ⚠️ Before It Hurts Your Returns 💰

    Crypto Rebalancing Bot 📊: Stop Portfolio Drift ⚠️ Before It Hurts Your Returns 💰

    Most traders don’t lose money because they picked the wrong coin.

    They lose because they never look back at their portfolio after buying it.

    You set a 50/50 split between two coins, walk away for a month, and come back to find one coin made up 80% of your holdings without you doing anything.

    That’s not bad luck.

    That’s allocation drift, and it happens to almost everyone who skips the maintenance part of investing.

    Academic research on retail trading behavior found that crypto investors absorb price swings without adjusting their holdings, even on days with extreme price movements, unlike what’s observed with stocks or gold.

    [ScienceDirect, Journal of Financial Economics research]

    A crypto rebalancing bot exists to fix exactly this problem.

    It watches your portfolio and quietly nudges it back toward your target mix, without you needing to check charts every day.

    EXECUTIVE SUMMARY
    • The Problem: Crypto portfolios drift out of balance fast because coins move at wildly different speeds, leaving traders overexposed without realizing it.
    • The Solution: A rebalancing bot automatically resets your allocation back to target, based on rules you set once and let run.
    • The Incentive: Automated rebalancing removes emotional decision-making and tends to enforce a disciplined buy-low, sell-high pattern over time.
    • The Risk: Rebalancing isn’t free. Frequent trades add up in fees, and the wrong threshold setting can do more harm than good. We’ll get into that later.

    What Is Crypto Portfolio Rebalancing

    Rebalancing sounds technical, but the idea is simple.

    You decide on a target mix for your portfolio, say 60% Bitcoin and 40% Ethereum, and rebalancing your asset allocation is just the act of bringing your actual holdings back to that mix whenever it drifts.

    A 1% threshold setting means rebalancing only triggers once an asset’s allocation moves a full percentage point away from its target, which shows how sensitive these settings are to even small market swings.

    [Medium, “Art of Rebalancing” by Sirwan Amini]

    That drift is invisible until you actually check your numbers.

    And most people don’t check often enough.

    Why Allocation Drift Happens

    Drift happens because price is the only thing moving your percentages around.

    You didn’t sell anything. You didn’t buy anything. But if BTC jumps 20% while ETH stays flat, your BTC weight just grew on its own.

    This isn’t a flaw in your strategy. It’s just math.

    Left alone long enough, even a carefully built portfolio turns into something you never intended to hold.

    Manual Rebalancing vs Automated Rebalancing

    Doing this by hand means logging in, checking percentages, calculating trade sizes, and executing orders, ideally before emotions creep in.

    Most people skip it, or they do it inconsistently when the market scares them.

    Look, that’s exactly when you shouldn’t be making decisions.

    Automated rebalancing removes the guesswork and the panic.

    The bot doesn’t care if the market dropped 10% overnight. It just follows the rule you gave it.

    What Is a Rebalancing Bot in Crypto

    A rebalancing bot is software that does one job continuously: keep your portfolio close to the allocation you defined.

    It doesn’t pick coins for you. It doesn’t predict price. It just maintains structure.

    Honestly, that’s the appeal. It’s not trying to be clever.

    It’s trying to be consistent, which is something most human traders struggle with.

    How It Connects to Your Exchange

    The bot connects to your exchange account through an API key, a kind of permission slip that lets it read your balances and place trades.

    You control exactly what it’s allowed to do.

    A properly configured bot should only have read and trade API key permissions.

    Withdrawal access should never be turned on.

    That one setting is the difference between a useful tool and a serious risk if the key is ever compromised.

    SELECTION MATRIX V2.0

    Not sure which
    exchange fits you?

    Bypass the marketing hype. Our matrix cross-references your profile against 50+ institutional metrics—including Proof-of-Reserves and Slippage Models.

    PoR Verified Low Slippage API Ready
    B
    K
    C
    O
    Find My Gateway Analysis Time: < 60s

    Rebalancing Bots vs Other Bot Types

    People often lump all trading bots together, but they solve different problems.

    A grid bot profits from price bouncing inside a range.

    A DCA bot builds a position gradually over time.

    Does a rebalancing bot guarantee profit?

    No. A rebalancing bot manages allocation, not profit. It can improve discipline and reduce emotional trading, but markets can still move against your target mix, and no automated tool removes that risk entirely.

    A rebalancing bot does neither of those things.

    Its only concern is your allocation percentages, not timing entries or directly exploiting volatility.

    Tools like CryptoGates’ Rebalancing Backtest Bot let you simulate this behavior before committing real funds, so you can see how the logic would have played out historically.

    How a Rebalancing Bot Works Step by Step

    Every rebalancing bot, no matter which exchange runs it, follows the same basic four-step loop.

    Once you understand this, every setting you see on a bot dashboard starts to make sense.

    Step What Happens Why It Matters
    1. Set Target Allocation You define what percent each coin should hold This is your “home base” the bot keeps returning to
    2. Set Trigger Rule You choose time-based or threshold-based rebalancing This decides how often the bot acts
    3. Monitor Drift The bot tracks live price changes against your target This is where allocation gaps get spotted early
    4. Execute Trades The bot sells overweight assets, buys underweight ones This is the actual “rebalance” moment

    Step 1 and Step 2 — Setting Allocation and Rules

    This part happens before the bot ever places a single trade.

    You decide your mix first, maybe 60% BTC and 40% ETH, maybe something spread across four or five coins. There’s no universal “right” split here.

    It depends on how much risk you’re comfortable holding in any one asset.

    Once that’s locked in, you choose your trigger. Some traders prefer a calendar-based check, where the bot looks at things every week or month, no matter what.

    Others prefer a percentage-based rule, where the bot only steps in once allocation has actually drifted past a line they’re comfortable with.

    Step 3 and Step 4 — Monitoring and Execution

    Honestly, this single decision shapes almost everything else about how the bot behaves later.

    A loose threshold means fewer trades and less hands-on babysitting.

    A tight one means the bot reacts faster, but it also means more transactions, and more transactions usually mean more fees chipping away at your results.

    Once the rules are set, the bot’s job becomes pretty boring in the best possible way.

    It just sits there, comparing your real holdings against your target percentages, over and over, without getting tired or distracted.

    Here’s the interesting part.

    The bot doesn’t predict anything. It doesn’t try to guess where the price is headed next.

    It simply waits for your rule to be triggered, whether that’s a scheduled date arriving or a deviation limit being crossed.

    CG STRATEGY ANALYZER

    Confused about
    market outlook?

    Trading without a plan is just gambling. Our strategy architect analyzes your risk tolerance and capital to match you with a proven algorithmic framework.

    PASSIVE DCA Bot
    AGGRESSIVE Grid Pro
    BALANCED Rebalance

    When that trigger fires, it sells the coin that’s grown too large a share of your portfolio and uses that money to buy back into whatever’s now underweight.

    That’s the whole mechanic. No emotion, no hesitation, no “just one more day to see if it goes higher.”

    It just does what it was told to do.

    Rebalancing Modes and Triggers

    So, which trigger should you actually pick, time-based or threshold-based?

    There’s no single right answer here.

    It really comes down to how much attention you want to give your portfolio and how much you’re willing to spend on trading fees along the way.

    Look, most beginners just copy whatever setting they saw in a YouTube video.

    That’s not a strategy.

    That’s guessing.

    Time-Based Rebalancing

    Time-based rebalancing ignores how far your portfolio has drifted and acts purely on schedule.

    You might set it to check in weekly, monthly, or quarterly, and when that date arrives, the bot rebalances regardless of whether the drift is small or massive.

    This approach suits people who want predictability over precision.

    You always know when a trade might happen, and you’re not glued to a dashboard wondering if today’s the day.

    The tradeoff is that you could miss a big drift that happens between two scheduled checks, or you could rebalance on a day when the drift barely matters at all.

    Threshold-Based Rebalancing

    Threshold-based rebalancing flips the logic.

    Instead of watching the calendar, the bot watches your allocation percentages directly. It only acts once drift crosses the line you set, whether that’s 3%, 5%, or something tighter.

    But there’s a problem most beginners don’t see coming.

    A tight threshold sounds like it gives you more control, but it can also mean far more trades than you expected, especially during a choppy, sideways market where prices bounce up and down without going anywhere meaningful.

    Each of those small trades still costs a fee.

    Set your threshold too tight, and you can end up paying more in fees than you actually gain from staying “perfectly” balanced.

    How often should a crypto rebalancing bot trade?

    There’s no fixed number. It depends entirely on your threshold or schedule setting, market volatility, and how many coins you’re managing. Tighter thresholds and more coins generally mean more frequent trades.

    This is exactly why testing a setting before running it live matters so much.

    CryptoGates’ Backtesting Lab lets you simulate different threshold levels against real historical price data, so you can see how many trades a setting would have triggered and what that would have cost in fees, before you ever risk a dollar on it.

    Rebalancing Strategies for Different Trader Profiles

    Not every trader should run the same portfolio rebalancing strategy.

    What works for someone holding for years looks nothing like what works for someone trading actively day to day.

    CEO Note:

    “We don’t believe in copying someone else’s settings and hoping for the best. Test what fits your own risk tolerance first. Slow and steady beats fast and reckless every single time.” ==> Zaheer, CEO, CryptoGates

    Long-Term Holders and Periodic Rebalancing

    If you’re in this for years, not weeks, you probably don’t want to be glued to a dashboard tracking every percentage shift.

    A slower rhythm works better here.

    Most long-term holders only glance at their portfolio every few months, while someone actively trading treats it more like a daily check-in.

    That gap in attention isn’t laziness. It’s just a different goal.

    Less monitoring also tends to mean fewer trades, and fewer trades mean lower fees eating into your position over the years.

    Active Traders and Tighter Thresholds

    Active traders want more responsiveness, and they’re usually willing to pay for it through extra trades.

    A threshold-based setup fits this style better than a calendar-based one, since it reacts the moment drift actually happens instead of waiting for a fixed date to roll around.

    But here’s the catch.

    Tighter control also means less predictable costs.

    You can’t always know in advance how many trades a volatile week will trigger, which makes budgeting for fees a bit trickier than it is with a scheduled approach.

    Dual-Coin vs Multi-Coin Rebalancing Bots

    Some bots run on just two coins.

    Others manage five, six, or more at once.

    Neither setup is automatically the smarter choice.

    It depends on what kind of portfolio you’re actually trying to build.

    Most exchange-based rebalancing bots, including Binance’s version, generally require a minimum of around 100 USDT per coin for the bot to function properly.

    Source: CoinSutra, Top Crypto Portfolio Rebalancing Tools

    That number matters more than it sounds.

    The more coins you add to a rebalancing setup, the more total capital you need just to keep every position above the minimum.

    When a Dual-Coin Setup Works Better

    A two-coin bot, something simple like BTC and ETH, keeps the whole thing easy to follow.

    There’s only one ratio to watch, and it’s never confusing why a trade happened.

    This setup tends to suit people just getting started with automated rebalancing.

    Fewer moving parts mean fewer chances to misread what the bot is actually doing.

    When Multi-Coin Diversification Makes Sense

    A multi-coin bot spreads your exposure across several assets at once, which can soften the blow if any single coin has a rough stretch. That spread comes with tradeoffs, though.

    More coins mean more individual minimum balances to maintain, more potential trades firing at the same time, and more total fees stacking up across the whole portfolio.

    It’s not a bad approach.

    It just demands more capital and more attention to run well.

    Key Parameters You Configure in a Rebalancing Bot

    Every rebalancing bot, regardless of platform, comes down to the same small set of settings.

    Get them right, and the bot behaves exactly the way you’d expect.

    Get them wrong, and you’ll see results that confuse you.

    Interactive Checklist: Before Launching a Rebalancing Bot

    • Total investment meets the minimum required per coin
    • Trigger price or starting condition is clearly defined
    • Threshold or time interval matches your trading style
    • You understand what each performance metric actually shows
    • You’ve reviewed the fee structure for your exchange

    Investment Amount and Trigger Price

    Capital requirements catch a lot of beginners off guard.

    A two-coin portfolio with a 100 USDT per-coin minimum means you’re looking at roughly 200 USDT just to get the bot running at all, and that number climbs with every coin you add.

    Trigger price is a separate setting worth understanding early.

    It lets you tell the bot to hold off until a coin hits a specific price before the rebalancing logic even starts, which can help you avoid launching the whole strategy at a price point you’re not comfortable with.

    Performance Metrics to Watch

    Once a bot is live, a handful of numbers tell you whether it’s actually doing its job well.

    Total profit usually reflects your current holdings at today’s price, minus your original investment, minus whatever fees have piled up along the way.

    Alongside that, you’ll typically see your total number of trades and a countdown to the next scheduled rebalance.

    One thing that confuses new users almost every time: if an order doesn’t meet the exchange’s minimum order size, the bot simply can’t complete that trade.

    It’ll keep trying until conditions allow it. That’s not a glitch.

    That’s the exchange protecting against orders too small to process properly.

    Practical Example: Running a Rebalancing Bot

    Theory only takes you so far.

    Watching an actual scenario play out makes the whole mechanic click a lot faster than reading definitions ever could.

    “Rebalancing essentially forces a portfolio to sell strength and buy weakness across different assets, which smooths out overall value as each coin moves at its own pace”

    Pionex, Crypto Rebalancing Bot Guide

    A 60 Percent BTC and 40 Percent ETH Walkthrough

    Picture a portfolio set to a 60% BTC and 40% ETH target, with a 5% deviation threshold.

    Now imagine BTC rallies hard while ETH barely moves.

    BTC’s share of the total portfolio could easily climb past 65%, crossing that threshold line.

    Once it crosses, the bot steps in.

    It sells off a slice of the now-overweight BTC and uses that money to buy more ETH, pulling the ratio back toward the original 60/40 split.

    No checking, no second-guessing, just the rule doing what it was told.

    The Buy Low, Sell High Effect Explained

    This is the part doing the real work quietly in the background.

    Every time a rebalance fires, the bot is selling whatever just went up and buying whatever lagged.

    That’s selling high and buying low, just without anyone needing to decide it in the moment.

    You’re not trying to guess which coin wins next.

    You’re letting price movement itself trigger profit-taking on the winner and reinvestment into the laggard.

    No single rebalance looks dramatic by itself, but stacked over many cycles, that habit adds up.

    Real Backtest Example

    Strategy: Rebalance (SOL/ETH pair)
    Market Condition: Diverging assets — one falling, one rising
    Objective: Test whether rebalancing still adds value when two holdings move in opposite directions
    Key Result: Over 46 days, SOL dropped 12.37% while ETH gained 5.64%. A passive holder of both would have ended up roughly flat. The rebalance bot, however, closed the same window at +1.70% ROI — a 0.11% edge over simply holding.

    Expert Interpretation: This is the buy-low, sell-high mechanic playing out in real market data, not just theory.

    When the bot sold the outperforming ETH slice and used the proceeds to top up the underweight SOL slice, it captured value from the divergence itself rather than requiring either coin to “win.” The margin looks small on paper, but it shows the mechanic works even in a mixed, directionless market — not just in clean trending conditions.

    View Complete Playbook: SOL Crashed 12% — Our Rebalance Bot Still Beat HODL

    Benefits of Using a Rebalancing Bot

    Once it’s configured properly, the advantages of a rebalancing bot are pretty unglamorous on the surface.

    But together, they solve a problem most traders don’t even realize they have until it’s too late.

    Automation and Emotional Discipline

    A bot doesn’t panic when the market drops ten percent overnight. It doesn’t get greedy chasing a coin that’s pumping.

    It just follows the rule it was given, every time, without fail.

    That consistency is worth more than it sounds.

    Rebalancing bots stick to your predefined allocation and triggers without exception, which takes emotional decision-making completely out of the equation.

    You’re no longer fighting your own impulses in the moment. The rule simply runs.

    Risk Control and Return Potential

    Keeping your allocation steady isn’t just discipline for its own sake.

    Letting rebalancing slide for too long can quietly turn a diversified portfolio into a concentrated bet on whatever single coin happens to be running hottest at the time.

    That’s a real risk, not a hypothetical one. But there’s an upside too.

    A consistently applied rebalancing strategy can support stronger long-term returns by systematically taking profit from the outperformers and feeding it back into whatever’s lagging.

    You’re not chasing performance here. You’re collecting it on a schedule.

    LIVE DATA FEED // UNFILTERED

    The Truth in Numbers.

    Designed for the 10% who require absolute clarity. We strip away the hype to reveal the structural reality of the crypto markets.

    11.6M TOKENS DEFUNCT (2025)
    “The Illusion of the Infinite Pump.” Most assets are designed to fail. We track the ones that don’t.
    ⚠ Shocking Crypto Statistics

    Risks, Limitations, and Common Misconceptions

    Rebalancing bots aren’t magic, and they’re definitely not risk-free.

    A handful of mistakes and misunderstandings show up again and again with people new to this.

    Rebalancing on a weekly schedule can cost a typical portfolio over $1,000 a year in fees alone, roughly 20% of starting capital, while shifting to a quarterly schedule on the same portfolio can bring that cost down to around $80 a year.

    Diamond Pigs, How Often Should You Rebalance Your Crypto Portfolio

    That gap alone is reason enough to double-check your threshold math before setting anything too tight.

    Reality Check

    Common belief: Rebalancing only makes sense when at least one asset in the portfolio is holding steady or rising — if everything is falling, there’s nothing to “rebalance into.”

    What CryptoGates research found: In a real backtest where SOL dropped nearly 32%, and ETH collapsed 48% over roughly two months, a passive $1,000 portfolio lost 28.73%. The rebalance bot running the same pair still came out ahead of doing nothing, losing $287 instead of the larger passive drawdown — a smaller loss, not a win, but a measurable one.

    Why it matters: Rebalancing isn’t a strategy that only works when markets cooperate. Even when both assets in a pair are falling, the discipline of selling relative strength and buying relative weakness can soften the damage compared to sitting still. The lesson isn’t “rebalancing guarantees profit” — it’s that the mechanic keeps working, just aimed at loss reduction instead of gain capture, when the whole market turns down.

    View Complete Playbook: SOL −32%, ETH −48% — Our Rebalance Bot Lost $287 and Still Beat Doing Nothing

    Over-Trading and Fee Drag

    This is the single most common mistake people make with these bots.

    Rebalancing too aggressively, on a daily or even weekly basis, rarely makes sense in crypto because transaction costs and short-term price noise quietly cancel out whatever benefit you were chasing.

    Reacting fast feels productive in the moment.

    But frequent trades are exactly what drain a portfolio’s returns over time, even when each rebalance looks tiny on its own.

    The “My Coin Count Is Dropping” Misconception

    New users often panic the first time they notice they’re holding fewer coins of one asset than before. That’s not a loss. That’s the bot doing precisely what it’s supposed to do.

    When one coin’s quantity decreases inside the bot, it’s because another coin’s quantity is increasing at the same time.

    Value is simply shifting between assets, not vanishing.

    What actually matters is total portfolio value, not the raw coin count sitting in any one slot.

    When Does a Rebalancing Bot Make Sense

    Rebalancing isn’t a one-size-fits-all strategy.

    It shines under certain market conditions and quietly works against you in others.

    Best Market Conditions for Rebalancing

    Choppy, sideways, range-bound markets are where rebalancing logic really proves its worth.

    Prices bouncing back and forth without going anywhere meaningful create exactly the kind of repeated drift that threshold rebalancing is built to capture.

    Every swing in one direction hands the bot a small opportunity to sell strength and buy weakness, even when the broader market isn’t trending anywhere in particular.

    Combining DCA With Rebalancing

    DCA and rebalancing tackle two different problems, but stacking them together tends to work well.

    DCA handles steady accumulation over time, while rebalancing keeps whatever you’ve already built from drifting into something you never intended.

    CryptoGates’ DCA Backtest Bot can show how this kind of layered approach would have performed historically, combining steady buying with periodic rebalancing instead of relying on a hunch.

    Knowledge Check

    If a malicious actor changes a transaction in Block #50, what happens to Block #51?

    There’s an honest tradeoff here, too.

    If you’re holding strong conviction in one asset during a long, sustained uptrend, rebalancing means trimming your best performer along the way, which can mean leaving some gains on the table if that asset keeps climbing.

    Rebalancing was never about catching every peak.

    It’s about staying in control of your risk while you’re still in the game.

    How to Set Up a Rebalancing Bot on an Exchange or Platform

    Setting up a rebalancing bot looks intimidating the first time you open the dashboard, but the actual flow is short.

    Connect your account, pick your coins, set your numbers, and let it run.

    Before you connect a single API key, it’s worth running your planned setup through CryptoGates’ Strategy Picker first.

    It won’t place trades for you, but it helps you see whether your intended allocation and threshold combination actually matches your risk profile before you commit real funds to it.

    Account and API Connection Basics

    Your exchange account needs an API key for the bot to function, and this is the one step where caution actually matters.

    Give the bot permission to read your balances and place trades.

    That’s it.

    Withdrawal permission should stay off, always, no exceptions.

    If a key ever gets compromised and withdrawal access is disabled, the worst someone can do is mess with your trades inside the account.

    They can’t move your funds out.

    That one setting is the difference between an annoying inconvenience and a genuine financial disaster.

    Testing Before Going Live

    Wait, here’s where most beginners skip a step they really shouldn’t.

    Jumping straight into a live bot with real money, without ever checking how your chosen settings would have behaved historically, is basically a guess dressed up as a plan.

    Backtesting against past price data shows you something a live launch can’t:

    How many trades a setting would have triggered, what that would have cost in fees, and whether your chosen threshold actually made sense for that asset’s typical volatility.

    CryptoGates’ Backtesting Lab exists specifically for this kind of dry run, letting you stress-test an allocation before any capital is at risk.

    HISTORICAL DATA AUDIT

    Battle-Test Your Strategy
    Before the Market Does.

    Eliminate guesswork with institutional-grade backtesting for DCA, Grid, and Rebalance bots. Real historical data. Real-world results.

    EST. OPTIMIZATION +42% ROI Efficiency
    Start Backtest Now

    Sourced from 5+ Years of Exchange Data

    Advanced Settings and Optimization Tips

    Once you understand the basics, a few smaller adjustments can change how a bot performs without touching your core strategy at all.

    “Recent fee-impact analysis comparing rebalancing frequencies found that monthly rebalancing schedules saw the smallest reduction in trading costs compared to shorter rebalance periods, since fewer trades naturally means less to save on in the first place.”

    HackerNoon, Crypto Portfolio Rebalancing: A Trading Fee Analysis

    Choosing the Right Deviation Threshold

    There isn’t one perfect threshold number that works for every coin or every person.

    A highly volatile altcoin probably needs a wider threshold than something like Bitcoin, simply because smaller, everyday price swings would otherwise trigger constant unnecessary trades.

    The smarter way to think about it is in terms of cost versus benefit.

    A tighter threshold reacts faster to drift, but it also means more trades and more fees chipping away at your results.

    A wider one trades less often, saving on fees, but it lets your allocation drift further before anything happens.

    Finding your own comfortable middle ground usually takes a bit of testing rather than guessing.

    Liquidity and Multi-Exchange Considerations

    Not every coin trades the same way on every exchange.

    Thinner order books mean your trades can move the price slightly against you, which is a hidden cost beyond the visible fee.

    Spreading your activity, or at least picking exchanges known for deep liquidity on the specific coins you’re holding, can reduce this kind of slippage.

    It’s a small detail, but over dozens of rebalances, small details like this start to add up.

    Managing and Adjusting a Live Rebalancing Bot

    A rebalancing bot doesn’t need babysitting, but it’s not something you set up once and forget about forever, either.

    A little ongoing attention keeps it aligned with what you actually want.

    Monitoring Open Positions and Allocation

    Checking in occasionally helps you catch problems early instead of discovering them months later.

    Look at your current allocation against your target, your unrealized profit or loss, and how many trades the bot has executed recently.

    Here’s the thing.

    If you notice the bot is trading far more often than you expected, that’s usually a sign your threshold is too tight for the volatility you’re dealing with.

    It’s worth adjusting before fees quietly stack up further.

    Adding Funds or Updating the Coin List

    Adding more capital to a running bot is something most platforms allow without shutting the whole thing down.

    The bot simply recalculates your allocation based on the new total and adjusts from there.

    Swapping out a coin or changing your target percentages is also possible mid-run, but it’s worth treating carefully.

    Changing the rules partway through resets how the bot measures drift going forward, so it’s not quite the same as starting fresh, but it’s close enough that you should only do it with a clear reason in mind.

    Fees, Costs, and Tax Considerations

    Every single rebalance involves a trade, and every trade has a cost.

    That’s easy to forget when you’re focused on allocation percentages instead of the bill at the end.

    “Trading fee structures, particularly the gap between maker and taker rates, can shift which rebalancing frequency actually makes financial sense for a given coin pair, since frequent small trades pay that fee repeatedly.”

    Pionex, Rebalancing Bot FAQ

    Maker and Taker Fees Impact

    Most exchanges charge slightly different rates depending on whether your order adds liquidity to the order book or takes it away.

    A rebalancing bot typically places market-style orders to execute quickly, which usually lands on the higher taker side of that fee structure.

    Over a handful of trades, this difference looks small.

    Over months of frequent threshold rebalancing, it adds up into something that genuinely eats into your returns if you’re not paying attention to it.

    A Note on Taxable Events

    This part isn’t something we can give blanket advice on, because rules vary so much depending on where you live.

    What’s consistent is the basic mechanic:

    Every rebalance trade is usually a disposal of one asset, which can create a reportable event depending on your local tax framework.

    It’s worth keeping a simple record of every rebalance trade as it happens, rather than trying to reconstruct months of activity later.

    CryptoGates is not a tax advisor, and this section shouldn’t be treated as tax guidance.

    Speaking with a qualified professional in your own country is the only reliable way to know what applies to you.

    Rebalancing Bot vs Other Crypto Trading Bots

    People often lump every trading bot into one category, but a rebalancing bot solves a completely different problem than the others.

    Knowing the difference helps you pick the right tool instead of forcing one bot to do a job it wasn’t built for.

    Swipe to view full data →
    Bot Type Main Job Best Fit For
    Rebalancing Bot Maintains target allocation Long-term portfolio discipline
    Grid Bot Profits from price bouncing in a range Sideways, range-bound markets
    DCA Bot Builds a position gradually over time Steady accumulation, entry timing

    Rebalancing Bot vs Grid Bot

    A Grid bot sets up a ladder of buy and sell orders across a price range and profits every time the price bounces between them. It’s built entirely around one coin’s movement inside a defined channel.

    A rebalancing bot doesn’t care about a single coin’s price range at all.

    Its only concern is the relationship between multiple coins in your portfolio.

    You could run both at once, but they’re answering completely different questions.

    Rebalancing Bot vs DCA Bot

    A DCA bot focuses almost entirely on entry. It buys a fixed amount on a schedule, smoothing out your average cost over time, regardless of where the price happens to be sitting.

    A Rebalancing bot picks up where DCA leaves off. It doesn’t care about your entry price at all. Its whole job is maintaining the relationship between assets you already hold, long after the buying decision is done.

    Used together, one builds your position and the other keeps it from drifting into something you never intended.

    Best Practices for Using Rebalancing Bots Safely

    A few habits separate people who use rebalancing bots well from people who set one up, walk away, and get an unpleasant surprise months later.

    Interactive Checklist: Before You Trust a Rebalancing Bot with Real Capital

    • Start with a smaller amount than you think you need
    • Stick to coins with solid trading volume and liquidity
    • Confirm your API key has no withdrawal permission
    • Review your threshold against actual fee costs, not just gut feel
    • Set a calendar reminder to check in periodically

    Honestly, starting small isn’t about lacking confidence in the strategy.

    It’s about giving yourself room to learn how the bot actually behaves in real conditions before committing serious capital.

    Illiquid, low-volume coins are a separate risk entirely.

    Thin order books mean your trades can fail to fill properly or execute at worse prices than expected, which quietly throws off the exact balance you’re trying to maintain.

    Set a Review Schedule

    A bot that runs unattended for too long can drift away from your actual goals, even while technically working exactly as configured.

    Maybe your risk tolerance changed, or maybe one of your coins isn’t performing the way you expected when you picked it.

    Checking in on a set schedule, monthly or quarterly, whatever fits your style, keeps the bot’s settings honest against your current situation instead of something you configured once and never revisited.

    Is a Rebalancing Bot Right for You

    So, after all of this, does a rebalancing bot actually fit your situation?

    If you’re someone who wants steady, rule-based portfolio management without checking charts every single day, the answer is probably yes.

    It’s not a tool for chasing the next big pump.

    It’s a tool for protecting what you’ve already built while letting discipline do the heavy lifting instead of emotion.

    REF: VOL-NEUTRAL-2026

    Neutralize Volatility.
    Own the Growth.

    Access systematic playbooks designed to eliminate emotional bias. From Spot HODL frameworks to advanced Grid simulators.

    ◒
    Spot & HODL
    ◈
    DCA Engine
    ▦
    Grid Tactics
    ☯
    Rebalance

    The traders who get the most out of these bots aren’t the ones with the tightest threshold or the fanciest multi-coin setup.

    They’re the ones who tested their settings first, understood the fee tradeoffs, and gave the strategy time to actually work the way it’s designed to.

    If you’re ready to see how a rebalancing approach would have performed before risking real capital, CryptoGates’ Rebalancing Backtest Bot lets you run that exact test against historical data, so your first real decision isn’t a guess.

    FAQs
    What is the minimum investment needed for a rebalancing bot to work properly?

    This depends on the exchange and how many coins you’re running, but most platforms need roughly 100 USDT per coin to function. A two-coin bot usually needs around 200 USDT minimum to start.

    Yes, most platforms let you adjust your threshold, schedule, coin list, or invested amount mid-run. Just know that changing the rules resets how the bot measures drift going forward.

    This usually happens with smaller investments. If a buy order doesn’t meet the exchange’s minimum order size, the bot can’t complete it and will keep retrying until conditions allow it.