

 Bitcoin
 Ethereum
 Solana
 TRON
 Zcash
 Hyperliquid
 Dogecoin
 Monero
 Chainlink
 Cardano
 Stellar
 Uniswap
 Sui
 Hedera
 Shiba Inu
 Bittensor
 Ripple USD
 Aster
 Polkadot
 World Liberty Financial
 Render
 Artificial Superintelligence Alliance

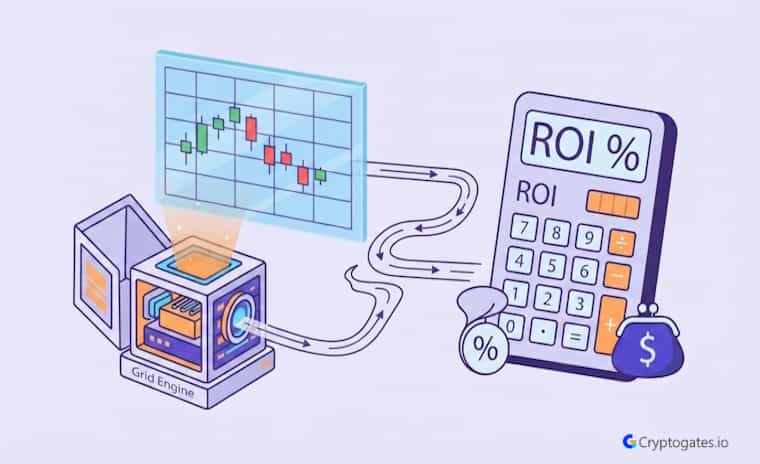
Most traders pick a grid trading strategy the same way they pick a coin. Something looked good on a chart, ser, and they hit go.
Here’s the problem.
A grid trading strategy isn’t one thing. It’s a family of five different approaches, each built for a different kind of market, and using the wrong one is exactly how a “safe” strategy turns into a slow bleed.
This guide skips the bot mechanics you’ve probably already read elsewhere. It’s about the decision layer:
Which grid type fits your market, how to size it, and
How actually to calculate whether it’s working.
CryptoGates built its Strategy Lab around exactly this kind of comparison, so traders stop guessing and start testing.
- The Problem: Traders default to whichever grid type feels familiar instead of matching the strategy to actual market conditions.
- The Solution: A structured framework for choosing arithmetic, geometric, spot, futures, or AI grid strategies based on data, not habit.
- The Incentive: Correctly matched strategy types show measurably better ROI-to-drawdown ratios across ranging markets.
- The Risk: A mismatched grid strategy compounds losses just as systematically as a matched one compounds gains.
What Is a Grid Trading Strategy?
Look,
if you’ve read a general “what is grid trading” guide already, this part will feel familiar on purpose. Because a grid trading strategy isn’t a single mechanic. It’s a decision framework that sits on top of that mechanic.
Here’s the reframe that matters. Every grid trade uses buy-low-sell-high logic within a range.
But which range, which spacing, and which capital structure you choose is where the real strategy lives.
That’s what this guide covers.
According to figures cited by trading platform InvestX, grid strategies have shown reported monthly returns in the 3% to 8% range, though outcomes depend heavily on setup quality and market fit.
That gap between 3% and 8% is basically the difference between a lazy configuration and a tested one.
The Five Grid Trading Strategy Types — Deep Comparison
Most beginners think there’s just “grid trading.”
There isn’t.
There are five distinct strategy types, and picking one because it sounds exciting instead of because the data supports it is the first mistake almost every trader makes.
Honestly, this is where CT tends to get it backwards. People ape into futures grids because leverage sounds fun, then wonder why they got rekt during a trend.
The type you choose should follow your market read, not your mood.
Arithmetic Grid Strategy
An arithmetic grid spaces every level by an equal dollar amount.
If your range is $200 wide with 10 grids, each level sits $20 apart, no exceptions.
The formula is simple: (Upper Bound − Lower Bound) ÷ Grid Count = Spacing.
This works well on assets with a tight, low-price range where percentage moves stay small and predictable. Think stablecoin pairs or majors during quiet consolidation.
Geometric Grid Strategy
A geometric grid spaces levels by a fixed percentage instead.
A 2% spacing setting means each level sits 2% above the last, not $2 or $20.
This matters more than it sounds like it should.
On a wide-range asset like BTC, arithmetic spacing gets weirdly lopsided near the top of the range.
Geometric spacing keeps every level proportionally meaningful, which is why experienced grid traders tend to prefer it for high-price-range assets.
Spot Grid Strategy
Choose a spot when capital preservation outranks upside. You’re trading real assets, no leverage, no liquidation risk hanging over your position.
This is a profile decision more than a technical one. If losing sleep over a margin call sounds miserable, the spot is where you start.
Futures Grid Strategy
Futures grids add leverage, which means bigger theoretical returns and a much shorter runway before things go wrong.
The core mechanics don’t change. The consequences of a bad range absolutely do.
Only run this once you’ve tested a spot version of the same strategy first. Liquidation risk isn’t a footnote here; it’s the whole game.
AI Grid Strategy
This is the one that actually changes the decision-making model. A traditional grid is static. You set the range once, and it holds until you intervene.
An AI grid adjusts.
It reads volatility signals, momentum shifts, maybe funding rate data, and nudges spacing or range boundaries in response.
“Adaptive” is the accurate word here, not “smart,” because it’s still following rules. Just more responsive ones.
“Trading is not about being right or wrong. It’s a probability game.” Mark Douglas, Trading Psychology Author (Source: Trading in the Zone)
That line applies directly here. Choosing a grid type isn’t about picking the “correct” one. It’s about picking the one with better odds for the market you’re actually in.

Not quite. A grid bot is the execution tool that runs the trades. A grid trading strategy is the decision layer above it: which type, which range, which spacing you choose before the bot ever runs.
Arithmetic vs Geometric Grid — Which One Fits Your Market?
Here’s the thing most guides skip. This isn’t really a “which is better” question.
It’s a “which matches your asset’s price behavior” question, and the answer changes depending on the pair.
If your range is under 10% of the asset’s price, arithmetic and geometric spacing look almost identical anyway.
The difference only shows up once you’re working with wide ranges or genuinely volatile assets, and that’s exactly where picking wrong starts costing you.
| Factor | Arithmetic Grid | Geometric Grid |
|---|---|---|
| Spacing Logic | Equal dollar gaps | Equal percentage gaps |
| Best Fit | Tight range, low-price assets | Wide range, high-priced assets |
| Calculation | Simple, fixed | Slightly more complex, scales with price |
Best Market Conditions for Each Grid Strategy Type
A generic “grid trading works in sideways markets” line doesn’t actually help anyone deploy correctly.
Different grid types want different flavors of sideways, and mixing them up is where the strategic mistakes start.
Low volatility, tight consolidation.
This is arithmetic’s home turf. Predictable spacing works because the price isn’t doing anything dramatic between levels.
Wide-range chop on a high-priced asset. Geometric earns its keep here. BTC oscillating across a few thousand dollars needs percentage-based logic, or the spacing gets distorted near the top of the range.
Choppy, uncertain conditions with shifting volatility. This is where AI grid strategies start to matter. Static spacing can’t keep up when the character of the chop keeps changing week to week.
Mild uptrend with patience on your side. A long-biased spot grid fits here, capturing oscillation while still holding some directional exposure.
Honestly, most losses in this game don’t come from a bad grid type. They come from using a decent grid type in the wrong condition and refusing to admit the market changed underneath it.
Real Backtest Example
Strategy: Grid (geometric spacing)
Coin: XRP/USDT
Market Condition: Near-flat, 90-day range ($2.08 → $2.09)
Objective: Extract profit from range-bound chop with no directional bias
Key Result: 875 trades executed, $1,817.91 gross grid profit, $1,387.14 net — a 27.74% return, while a buy-and-hold position over the same 90 days returned just 0.24%.
Expert Interpretation: This is close to a textbook case for tight, low-volatility consolidation — the exact condition where a well-spaced grid earns its keep independent of market direction.
The near-zero net price movement meant buy-and-hold had almost nothing to offer, while the grid’s repeated fills inside a narrow band did the work. It’s a useful reference point for why spacing discipline matters more than market direction in genuinely quiet conditions.
Full backtest: https://cryptogates.io/playbooks/xrp-grid-bot-returned-27-74-in-90-days-while-buy-hold-made-0-24/
How to Set Grid Trading Parameters — The Strategic Framework
This is where traders either build something durable or set themselves up to lose slowly and predictably. Not the range itself. The reasoning behind it.

Ryan Sean Adams, co-host of the Bankless podcast
Choosing the Price Range Strategically
Your range should sit on real support and resistance, not a round number that looks convenient.
Zoom out. Find where the price has actually reversed more than once, not just where it happened to stop last week.
A range that’s too tight breaks on the first real move. Too wide, and you’re waiting weeks for a single grid to fill. There’s a balance in there, and it’s specific to the asset, not a fixed rule you can copy-paste.
Selecting Grid Count — The Trade-off Math
More grids mean more trades, smaller profit per trade, and more fee exposure. Fewer grids mean the opposite on every count.
Here’s a simple way to think about it.
If your total range is $1,000 and you pick 20 grids, each level is $50 apart. Drop that to 10 grids, and each level doubles to $100, fewer fills, but each one is worth more.
Neither is “correct.”
It depends on how active you want the strategy to be and what your fee structure can absorb.
Grid Spacing vs Fee Threshold Formula
Wait,
this part gets skipped constantly, and it’s probably the single most common reason a “working” strategy quietly loses money.
Your spacing has to clear your round-trip fee by a real margin, not just barely.
A rough threshold traders use: spacing should be at least 3 times your round-trip fee percentage.
If your fee is 0.2% round trip, your spacing needs to comfortably clear 0.6%, or you’re running a busy bot that isn’t actually profitable.
Capital Allocation Logic
How much of your total trading capital goes into one grid strategy on one pair? That’s the real decision, not the grid count.

Zaheer - CEO Cryptogates
A common starting point is capping any single grid strategy at 5% to 10% of total trading capital until you’ve got verified performance data behind it.
Not because that number is magic. Because it keeps one bad range from meaningfully damaging your whole portfolio.
Understanding ROI in Grid Trading — Full Breakdown
Most traders check one number. Total profit.
That’s not ROI, and treating it like ROI is how a losing setup gets mistaken for a winning one.
The actual formula looks like this: ROI = (Realized Profit + Unrealized Position Value − Fees) ÷ Capital Deployed.
Notice unrealized value is in there. Ignore that part, and your ROI is basically fiction.
Here’s a quick worked example. Say you deployed $2,000 on a BTC grid strategy. Realized profit after 30 days sits at $85.
Unrealized position value, meaning what your currently held BTC is worth compared to what you paid for it, is negative $40 because the price drifted slightly below your average entry. Fees came to $12.
Realized ROI alone would look like ($85 − $12) ÷ $2,000, or about 3.65%. Total ROI, the honest number, is ($85 − $40 − $12) ÷ $2,000, which comes out closer to 1.65%. Same bot. Same trades.
Very different picture depending on which number you’re looking at.
The mistake that trips up almost everyone: judging ROI without judging drawdown alongside it. A strategy that made $200 but dipped $600 underwater along the way carries a completely different risk profile than one that made $200 smoothly.
The number on the surface can be identical. What happened underneath it wasn’t.
Reality Check
Common belief: many traders assume that if a grid bot is firing trades and generating “grid profit,” the strategy is automatically winning.
What CryptoGates research found: in a live backtest tracking a major-cap grid strategy through a 33% post-ATH drawdown, the bot generated $163.94 in real grid profit across 171 trades — yet total ROI still landed at −21.64%. The grid mechanism itself worked exactly as designed; it was the underlying price collapse below the range floor that erased the gains on paper.
Why it matters: grid profit measures how well the bot executed its logic, not whether the position as a whole made money. A trader who only checks “did my bot trade a lot” without checking unrealized losses on the held asset is looking at half the picture — the same gap this guide’s ROI formula is built to close.
Full backtest: https://cryptogates.io/playbooks/grid-bot-vs-a-33-bnb-crash-what-the-backtest-data-actually-shows/
How to Use a Grid Trading Calculator
A calculator won’t predict the market. What it does is stop you from deploying a setup that was broken from the start, before a single dollar goes live.
Yes, more than most beginners realize. Spacing determines whether your fees eat your profit. Count just determines how often you trade within that same spacing.
What Inputs You Need
Price range, meaning your upper and lower bounds.
Grid count: how many levels sit inside that range.
Order size, or how much capital lands on each level.
Fee rate: your exchange’s actual round-trip cost.
And historical volatility, which tells you roughly how often the price is likely to move between your levels.
Get any one of these wrong, and the output becomes meaningless. Garbage in, garbage out applies here just like anywhere else.
What Outputs You Should Review
Expected profit per cycle tells you what one completed round trip is worth after fees.
Total order count over your test period shows activity level. Fee-adjusted ROI is the number that actually matters, not the gross figure before costs.
Capital efficiency shows whether your money is working hard enough to justify sitting in this strategy instead of somewhere else.
Here’s the uncomfortable stat behind all of this.
Independent testing on automated grid setups has found that a strategy showing 1% daily returns on paper can shrink to roughly 0.2% net after fees and slippage are properly accounted for, an 80% degradation between the backtest and reality.
(Source: TradingView Hub Research)
Worked Example Using a Calculator
Say you’re testing ETH between $2,800 and $3,200, with 8 grids and $1,600 total capital.
That puts $200 per grid level and $50 spacing between each.
Plug in a 0.1% round-trip fee and moderate historical volatility, and a decent calculator should show you something like this:
roughly 6 to 10 completed cycles per week in a ranging market, a fee-adjusted profit per grid of around $1.20 to $1.60, and a projected monthly return somewhere in the low single digits.
Not exciting. That’s kind of the point.
CryptoGates’ Strategy Lab lets you run comparisons like this across different grid types before committing real capital, so the numbers above are a starting point to test against, not a promise.
Common Strategic Mistakes (Not Execution Mistakes)
These aren’t the “forgot to set a stop-loss” mistakes.
Those live elsewhere.
These are the mistakes that happen before the bot even starts running, at the decision level.
Interactive Checklist: Before You Commit to a Grid Type
Pre-Trade Strategy Audit
- Confirm the current market condition actually matches your chosen grid type
- Run the ROI formula with unrealized value included, not just realized profit
- Check drawdown alongside ROI, never look at one without the other
- Run your settings through a calculator before deploying real capital
- Set a rule for when you'll switch or pause if the market regime shifts
Picking arithmetic spacing on a high-volatility asset is a common one.
The spacing gets distorted near the range edges and the strategy quietly underperforms what geometric would’ve done on the same pair.
Judging ROI without drawdown is another.
A strategy can look profitable on the surface while sitting on unrealized losses that never get accounted for until it’s too late to adjust cheaply.
And here’s the one that costs traders the most over time. Not switching grid type when the market regime changes.
What worked during three months of chop can start bleeding the moment the asset finds a real trend, and sticking with the same static setup out of habit is how a decent strategy turns into a slow leak.
How to Choose the Right Grid Strategy for Your Profile
There’s no universal best grid strategy.
There’s only the one that matches your risk tolerance, your experience, and your actual read on the market right now.
Beginner and conservative? Start with a spot arithmetic grid on a liquid major pair.
Simple spacing, no leverage, room to learn without your first mistake being an expensive one.
Comfortable with a volatile asset and want better spacing logic? Geometric grid earns its place here, especially on anything with a wide price range like BTC.
Want something hands-off that adjusts without you babysitting it constantly? AI grid fits that profile, assuming you’ve accepted that “adaptive” still means rule-based, not magic.
Advanced, leverage-literate, and comfortable with liquidation math?
Futures grid, but only after a spot version of the same strategy has already proven itself.

Larry Fink, CEO, BlackRock (Source: 2026 Chairman's Letter)
That logic applies to grid strategy choice too. Picking a type that fits your profile and sticking with it through a proper test period beats chasing whichever grid type had a good week on CT.
How CryptoGates Supports Grid Strategy Selection
Deciding between arithmetic, geometric, spot, futures, or AI isn’t a decision you should be making blind.
CryptoGates’ Strategy Lab lets traders run side-by-side comparisons across grid types before committing capital to any one of them.
The point isn’t picking a “winner” once and forgetting it. It’s testing how each type would’ve performed across different market conditions, ranging, trending, choppy, so the choice reflects data instead of a feeling you had on a Tuesday.
That comparison layer sits above the execution side covered in CryptoGates’ Grid Backtest Bot guide. Strategy selection first. Execution settings after.
Who Should Use Which Grid Strategy
Beginner traders get the most value from a structured spot approach.
Arithmetic, tight range, small capital, nothing leveraged. The goal here isn’t maximum return.
It’s learning how the mechanics actually behave with real money on the line, even if that amount is small.
Intermediate traders, especially ones comfortable reading volatility and range structure, tend to graduate toward geometric spacing or start experimenting with AI-adjusted parameters.
This is where the “which condition fits which type” framework from earlier actually starts paying off.
Advanced traders who understand leverage, liquidation mechanics, and multi-strategy capital splits can combine futures grids with AI adjustment.
That’s not a starting point for anyone. It’s where you end up after a spot grid has already proven the underlying logic works.
A 2026 Traders Union survey of active retail crypto traders found that 63% don’t use stop-loss protections at all, and that same gap in discipline tends to show up in grid deployment too, no defined exit, no plan for what happens if the range breaks.
(Source: Traders Union Research)
Grid Trading Strategy Is a Framework, Not a Guess
A grid trading strategy was never really about the bot.
It’s about the decision that happens before the bot ever runs, which type fits this market, how it’s sized, and whether the numbers actually support the choice or just feel right.
Arithmetic, geometric, spot, futures, AI grid. Five tools, five different jobs. Picking based on data instead of excitement is what separates a strategy that survives from one that quietly bleeds.
ROI without drawdown is half a picture. A calculator before deployment is the difference between testing an idea and gambling on one.
Verify first. Risk later. Scale slowly.
Once you’ve picked your strategy type, CryptoGates’ Grid Backtest Bot guide walks through the execution side, settings, range, and live deployment mechanics.
FAQs
Is a grid trading strategy profitable long term?
It can be, but only when the type matches the market condition and fees are accounted for honestly. Treat it as a tested framework, not a passive income guarantee.
Which grid strategy is best for beginners?
A spot arithmetic grid on a liquid, tight-range pair. It’s the simplest mechanic to understand and carries no leverage risk while you learn.
How often should I switch grid strategy types?
Whenever the market regime clearly shifts, ranging to trending or the reverse. Sticking with a static type out of habit is a common way profitable setups turn into slow losses.