Bitcoin
  Ethereum
  BNB
BNB  XRP
XRP  Solana
  TRON
TRON  Dogecoin
  Hyperliquid
  Zcash
Zcash  Stellar
  Cardano
  Hedera
  Sui
Sui  Shiba Inu
  Bittensor
  World Liberty Financial
  Aster
Aster  Ripple USD
  Polkadot
  Render
  Artificial Superintelligence Alliance
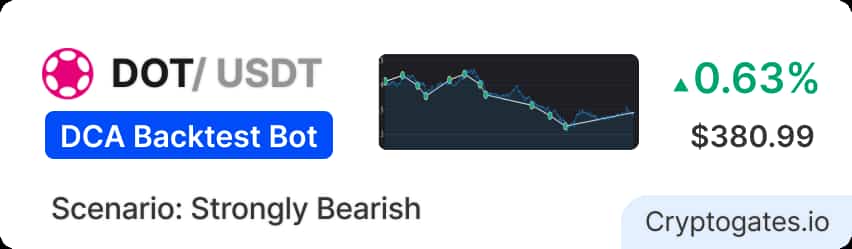
DOT Was Already Bleeding When June Started. It Didn't Stop.
DOT entered June 2025 at $4.077 — already down 49% from its January high of $7.98. The market had been grinding lower for five months. There was no relief in sight.
By December 31, 2025, DOT closed at $1.789. That’s a further −56.1% from the June entry. A spot buyer who entered on June 1 and held through year-end lost $2,288 per $4,077 invested. The trend was structural, not temporary.
The question we wanted to answer: Can a DCA bot generate positive returns in an asset that drops more than half its value over 7 months — without a single meaningful recovery rally?
We ran this backtest on real Binance 1-minute OHLCV data across the full June–December 2025 window to find out. The results challenge almost everything retail investors assume about DCA.
Strategy Parameters
How Each Setting Impacted Performance?
Parameter Impact Summary
| Parameter | Impact | The Logic (Why) |
|---|---|---|
| $400 Base Order | Preserved capital | Low initial exposure |
| Equal DCA Size | Stable averaging | Linear cost reduction |
| 5% DCA Step | Selective triggering | Skips intraday noise |
| 9 DCA Orders | Deep bleed coverage | Survives major dips |
| 3% Take Profit | Frequent TP hits | Optimizes cycle turnover |
151 Orders. $380.99 Net Profit. $4.82 Per Closed Session.
The Math That Matters
💰 Effective Yield on Base Capital
The bot report shows 0.63% ROI — but that’s calculated on total capital deployed across all sessions, not your standing capital. The meaningful number for an investor is different. On a $4,000 base capital, the bot returned $380.99 over 7 months. That’s a 9.52% effective yield on the money you actually committed — or roughly 1.36% per month. Annualized, that projects to approximately 16.3% per year. Caveat: this assumes consistent market conditions across 12 months, which won’t happen.
⚡ The Session Efficiency Picture
79 sessions closed. $380.99 total profit. That’s $4.82 per closed session on average. Some sessions deployed $400 (single order); Session 4 deployed $2,400.80 across 6 orders and returned $68.35. The bot was not generating outsized wins — it was grinding small, consistent profits across a high volume of short cycles. This is the DCA engine working as designed: frequency of winning trades matters more than the size of individual wins.
🛡️ The Fee Reality Check
$45.30 in fees on $380.99 net profit means the fee drag consumed 10.63% of gross earnings. That’s not negligible. At 151 orders across 7 months, the 0.075% rate was defensible — but if this bot had run at a 0.1% or higher fee tier, fees would have consumed a materially larger share of profit. The strategy’s margin is thin enough that the fee rate is a real variable, not an afterthought.
| Variant | DCA Step | TP % | Sessions | Orders | P&L USDT |
|---|---|---|---|---|---|
| A — Eager Deployer | 0.9% | 5% | 5 | 33 | −$1,787.41 |
| B — Aggressive Stacker | 2% | 2% | 80 | 207 | −$2,313.39 |
| C — Patient Sniper ✅ This Playbook | 5% | 3% | 79 | 151 | +$380.99 |
The gap between variants is not minor — it’s existential. Variant A lost $1,787 because its 0.9% step triggered orders on every intraday ripple, ran out of orders by the first major leg down, and locked capital in deep underwater positions with a 5% TP that never triggered on DOT’s shallow bounces. Variant B was even more destructive: the 2% step fired constantly across 207 orders, and with no multiplier discipline, capital was consumed before the trend found any floor.
Variant C’s 5% step did something counterintuitive — it protected capital by refusing to deploy on noise. Fewer orders meant more ammo per meaningful leg down, and 3% TP fired reliably on DOT’s small recovery bounces. Step size wasn’t just a parameter here. It was the difference between a profitable strategy and a $2,300 loss.
What the results are really telling you.
✅ what worked
The 5% DCA step was the single most important parameter in this backtest. It prevented order burn on intraday micro-drops — the noise that destroyed Variants A and B.
Session 4 shows this clearly: 6 orders deployed across $2,400.80 into a genuine multi-day leg down, closing at +$68.35. The bot waited for real movement, then stacked into it. The 3% TP fired reliably on DOT’s short-duration bounce cycles throughout June and July, converting each dip into a closed profit.
⚠️What didn't work
Session 1 context reveals the strategy’s ceiling: when DOT drops only enough to trigger 1 base order and bounces 3%, the profit is $11.39 on $400 deployed — a 2.85% return. After fees, the real yield per single-order session is thin.
The 1 incomplete session (still open as of December 31) represents the strategy’s structural weakness in a sustained downtrend: when DOT kept falling beyond the bot’s 9-order depth, capital locked at lower prices with no exit. A 10th order or wider step would have widened coverage — at the cost of higher capital requirements.
💡 The key insight
DCA bots don’t fight trends. They harvest the bounces within them.
DOT fell 56% over 7 months. The bot made money not by predicting recovery, but by collecting 3% on every short bounce before the next leg down. 79 times. The insight that matters: in a slow bleed, step size controls your survival. A tight step burns your orders into noise and leaves you stranded.
A wide step preserves ammo for real dips, enabling the bot to stay active and profitable even as the underlying asset collapses. The optimal step isn’t a universal number — it’s calibrated to the asset’s average daily swing. For DOT in a bear trend, 5% was the floor of discipline.
🚩 Watch out for - a potential red flag
The 79.31% max drawdown is the number that looks catastrophic. It’s not what you think — it represents the deepest unrealized paper loss on a single session’s deployed capital at peak extension, not your total account. But here’s the real risk: this strategy requires $4,000 of liquid, uncommitted capital.
If you run it with partial funding and can’t fill order 7 or 8 during a deep dip, your average cost basis collapses — and that 3% TP never triggers. The bot breaks silently, not loudly. Always ensure the full $4,000 USDT is liquid and available before running this setup.
🧭 When This Strategy Works Best
Ideal Conditions:
✔ Slow-bleed bearish markets with recurring 3–8% bounce cycles
✔ High-volatility assets with frequent intraday swings of 5%+
✔ Sideways consolidation with no sustained directional trend
✔ Assets with confirmed oscillation behavior, not parabolic trends
🚫 When NOT To Use This Strategy
Avoid when:
❌ Asset is in a confirmed crash with no bounces (drops >15%/week)
❌ Strong bull run — DOT surges 10%+ without triggering any DCA orders
❌ Flat, ultra-low-volatility market — the 5% step never fires
❌ You cannot keep the full $4,000 USDT liquid and uncommitted
📊 Expert Rating
Profitability: ⭐⭐⭐⭐☆
Risk Control: ⭐⭐⭐☆☆
Capital Efficiency: ⭐⭐⭐⭐☆
Beginner Friendly: ⭐⭐⭐⭐☆
Market Adaptability: ⭐⭐⭐☆☆
🏆 Overall Score
8.3 / 10 — Strong Volatility DCA Strategy
✔ Quick Takeaways
✔ A 5% DCA step is not conservative — it’s precision. It preserved capital in a 56% downtrend where tighter steps destroyed two rival variants.
✔ 79 of 80 sessions closed in profit while DOT lost more than half its value — the bot didn’t need recovery to make money.
✔ The 79.31% max drawdown is session-level exposure — not total account loss. Understand the difference before you panic.
✔ Fee drag consumed 10.63% of gross profit across 151 orders — fee tier is a real variable in thin-margin strategies like this.
✔ Variant A (0.9% step) lost $1,787. Variant B (2% step) lost $2,313. One parameter change — step size — was the difference between profit and a $2,300 loss.
✔ Buy & hold returned −$617.32 on the same capital over the same period. The bot returned +$380.99. That’s a $998.31 gap from identical market exposure.
What did spot buy & hold actually return?
The opportunity cost of not running the DCA bot in this 7-month window: $998.31. That’s the difference between +$380.99 and −$617.32 on comparable capital exposure.
The bot didn’t just outperform; it generated profit in a market where holding the asset resulted in one of the sharpest losses of the 2025 alt-season drawdown. The strategy’s edge wasn’t prediction. It was structured.
Before you run this playbook, check these off.
Use this as your go/no-go checklist before deploying this exact parameter set.
🧠 Market Suitability Matrix
| Market Condition | Rating | Strategic Notes |
|---|---|---|
| Sideways / Consolidating | ★★★★★ Excellent | Frequent triggers, consistent exits |
| High Volatility | ★★★★★ Excellent | Deep entries, fast recoveries |
| Mildly Bearish / Slow Bleed | ★★★★☆ Good | Longer cycles, higher drawdown |
| Mildly Bullish / Slow Climb | ★★★☆☆ Moderate | Fewer sessions, lower P&L |
| Strong Bull Run | ★★☆☆☆ Risky | High opportunity cost, idle |
| Strong Bear / Crash | ★☆☆☆☆ Poor | Maximum capital lock, no exits |
| Very Low Volatility | ★☆☆☆☆ Poor | No triggers, deadweight capital |
How to tune this playbook for different scenarios.
Disclaimer: All data sourced from CryptoGates DCA Backtest Bot. Results are historical simulations using Binance 1-minute OHLCV data. Past backtest performance does not guarantee future live trading results. DYOR.
Battle-Test Your Strategy
Before the Market Does.
Eliminate guesswork with institutional-grade backtesting for DCA, Grid, and Rebalance bots. Real historical data. Real-world results.