Most traders jump in because something feels right. A tip from a friend, a signal in a Telegram group, a chart that looked obvious in the moment.
Then the market moved the wrong way, and the plan, if there was one, fell apart instantly.
Research consistently shows that 70 to 90% of retail traders lose money in crypto. The most common reason isn’t a bad strategy. It’s no strategy at all.
There’s one step that separates traders who last from traders who blow up in the first few months. It’s not a secret indicator.
It’s not a premium tool. It’s testing your strategy before you risk a single dollar on it. That’s what this crypto backtesting guide is for.
Not theory. Not hype.
A real process that tells you whether your strategy actually works, before the market gets a chance to answer that question for you.
- The Problem: Most retail traders risk real money on strategies they’ve never tested.
- The Solution: Backtesting runs your strategy on historical data before any real money is at risk.
- The Incentive: A tested strategy removes guesswork and gives you a real, repeatable edge.
- The Risk: A poorly built backtest creates false confidence — and that’s more dangerous than no test at all.
What is Crypto Backtesting?
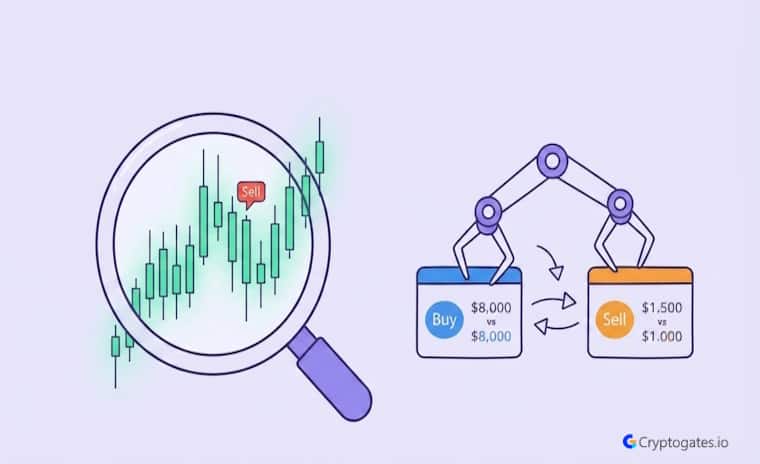
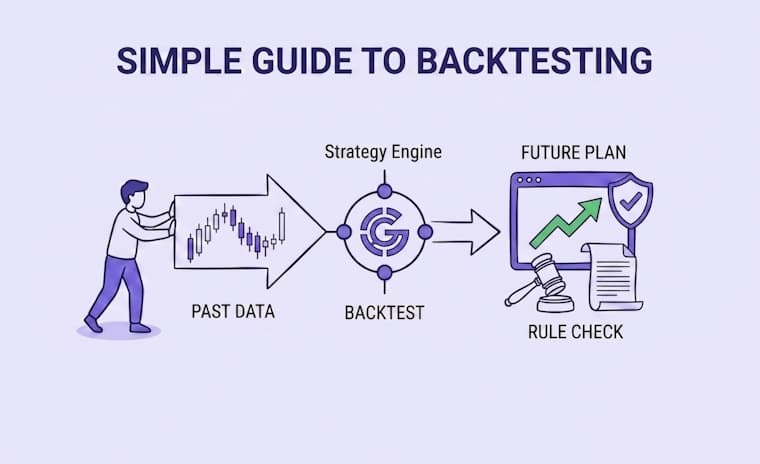
Backtesting a crypto strategy means running it against real historical price data to see how it would have performed, before you put any real money on the line. You’re not guessing. You’re not hoping. You’re checking.
A widely cited study by the European Securities and Markets Authority found that 74–89% of retail CFD and crypto traders lose money, with inexperienced traders showing the highest loss rates. [ESMA — European Securities and Markets Authority]
Think of it like a flight simulator. A pilot doesn’t learn to handle turbulence by jumping into a real cockpit during a storm.
They practice in a simulator first — hundreds of hours of it — so when the real moment comes, they already know what to do.
Crypto backtesting works the same way. You test the strategy. You find the weak spots. You fix them. Then, and only then, you consider going live.
Battle-Test Your Strategy
Before the Market Does.
Eliminate guesswork with institutional-grade backtesting for DCA, Grid, and Rebalance bots. Real historical data. Real-world results.
Most beginners skip backtesting entirely.
They see a signal on social media, feel the pull of FOMO, and place a trade based on excitement. That’s not trading.
That’s gambling with extra steps.
A crypto backtesting guide exists for one reason: to give you a way to separate what feels right from what actually works.
The Simple Way to Think About It
Here’s the thing. You wouldn’t open a restaurant without testing the recipes first, right? You’d cook the dish, taste it, adjust the seasoning, and test it again. Backtesting is exactly that process — but for trading strategies.
You define the rules. Enter when this happens. Exit when that happens. Use this much of your capital per trade. Then you run those rules across months or years of real price data and watch what happens.
Did it make money? Did it blow up during a crash? Did it barely survive a sideways market?
You find out — without losing a single dollar in the process.
Honestly, that’s the whole point. Test first. Risk later.

Andreas M. Antonopoulos, Bitcoin advocate, author of Mastering Bitcoin
What Makes Crypto Backtesting Different From Other Markets
Crypto doesn’t follow the same rules as stocks or forex. And that matters a lot when you’re backtesting.
The market never closes. There’s no opening bell, no lunch break, no weekend pause. A strategy that works during weekday hours might behave completely differently at 3 am on a Sunday.
Price data exists across dozens of exchanges simultaneously, and those prices don’t always match. A trade executed on one exchange at one price might have looked very different on another.
Traders who follow structured backtesting report fewer impulsive trades:
Replace placeholder with → [Journal of Financial Markets — behavioral trading research]
Newer altcoins also have limited price history. You might only have a few months of data to work with, which makes it nearly impossible to test how a strategy holds up across a full market cycle.
Add in the reality that whale manipulation and sudden regulatory news can spike or crater prices in minutes, and you start to see why a crypto backtesting guide has to be built differently from anything written for traditional markets.
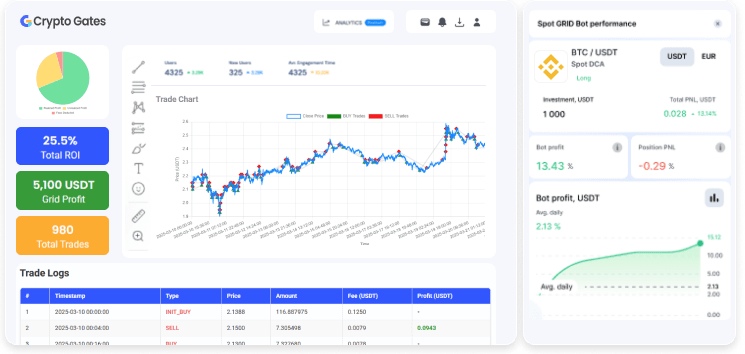
CryptoGates’ Backtesting Lab pulls from high-quality OHLCV data across partner exchanges, so you’re working with real numbers — not gaps and guesses.
Why Backtest Before You Risk Capital?
Most people think they have a good strategy.
They’ve watched some videos, read a few threads, maybe even made money on a couple of trades. So they go live.
And then the market does something unexpected — and they don’t know whether to hold, cut, or wait — because they never actually tested what their strategy does in that situation.

Sajid, Strategist Cryptogates
That’s the gap backtesting fills. Not confidence built on hope. Confidence built on data.
Data Replaces Guesswork
Here’s what most beginners miss. A strategy that made money last month might have only worked because the entire market was going up. That’s not an edge. That’s timing. And timing runs out.
Backtesting forces you to look at the full picture.
How did the strategy perform during a slow sideways grind?
What happened when the price dropped hard and fast?
Did it recover — or did it keep losing?
These aren’t questions you want to answer with real capital on the line. You want to answer them first, in a test environment, with zero financial risk.
Profitable systematic strategies often operate with 35–55% win rates:
Replace placeholder with → [Kaufman, Perry J. — Trading Systems and Methods]
The data tells you whether your logic has ever worked at all.
Not whether it felt right.
Not whether someone on the internet said it worked for them. Whether it actually produced consistent results when applied to real price history.
Confidence Without Emotional Attachment
Look. Emotional trading is the number one account killer in crypto.
Not bad strategies — bad reactions to good strategies, hitting a rough patch.
When a strategy dips — and every strategy dips at some point — the untested trader panics.
They close the position too early, switch to something else, or abandon the system entirely. Then the original strategy recovers, and they’ve already missed it.
Confused about
market outlook?
Trading without a plan is just gambling. Our strategy architect analyzes your risk tolerance and capital to match you with a proven algorithmic framework.
Backtesting fixes this in a way nothing else really can.
When you’ve watched a strategy go through drawdown after drawdown across historical data and still come out positive overall, you understand what a normal rough patch looks like.
You’ve seen it before.
You know what it looks like when the strategy is just doing what it does, versus when something has actually broken.
That’s not blind faith. That’s earned confidence. There’s a difference.
Risk Management You Can Actually Trust
Here’s the interesting part. Backtesting doesn’t just tell you if a strategy is profitable. It tells you exactly how risky it is — in numbers you can plan around.
Maximum drawdown. Win rate. Average loss size.
Recovery time after a losing streak. These aren’t abstract ideas.
They’re the numbers that tell you how much capital you need, how long you might wait to see profit, and whether your stomach can actually handle this strategy in real life.
Before You Risk Real Capital — Run This First
- Have you defined clear entry and exit rules in writing?
- Have you tested across at least one bear market period in the data?
- Does your backtest include realistic trading fees and slippage?
- Have you checked the maximum drawdown against your actual capital?
- Would you be comfortable holding through the worst losing streak the backtest shows?
Without backtesting, these numbers are invisible.
You only find out what they are when the market shows you — and by then, it’s already cost you.

Crypto backtesting is as accurate as the data and assumptions behind it. If you use clean historical price data, include realistic fees, and avoid common errors like look-ahead bias, results can be highly informative. No backtest predicts the future — but a well-built one tells you a lot about how a strategy behaves under real conditions.
How to Backtest a Strategy on CryptoGates
A lot of traders assume backtesting requires coding skills, expensive software, or a finance degree.
It doesn’t.
Not anymore.
CryptoGates’ Backtesting Lab was built specifically so that anyone — beginner or intermediate — can test a real strategy against real data without writing a single line of code.
Traders who follow a structured backtesting process before going live report significantly fewer impulsive trades and lower average drawdown in their first three months of live trading compared to those who skip testing entirely. CryptoGates internal research
But the tool only works as well as the process behind it.
Here’s the five-step process that actually produces useful results — the same crypto backtesting methodology we use internally to validate DCA, Grid, and Rebalance strategies.
Define Your Rules Before You Touch Any Tool
This is where most people fail before they even start. They open the backtesting tool, start clicking, and try to build the strategy as they go. That produces garbage results every time.
Write your rules down first. On paper, in a notes app, wherever — just write them down before you touch anything. Entry signal:
What exact condition triggers a buy?
Exit signal: what closes the trade?
Stop loss: at what point do you accept the loss and move on?
Position size: What percentage of your capital goes into each trade?
Wait. If you can’t answer all four of those questions in one sentence each, your strategy isn’t ready to backtest yet. And that’s fine. Figure it out first. The tool will still be there.
Proven Setups &
Expert Breakdowns.
We don’t just show you the data; we engineer and validate high-performance strategies, providing the “Alpha” behind the numbers.
Choose the Right Data Range and Pair
Here’s what actually matters. One good-looking backtest result on Bitcoin during a single bull run means almost nothing. That’s not a strategy. That’s a strategy that got lucky during a specific market condition.
Test across a data range that includes different market phases.
A period where the price trended up hard. A period where it crashed.
A period where it went sideways and frustrated everyone. If your strategy holds up across all three — that’s worth paying attention to.
The pair matters too.
A strategy that works on Bitcoin might behave completely differently on a mid-cap altcoin with lower liquidity and higher volatility.
Test on the pair you actually plan to trade, not the one that makes your results look best.
Set Realistic Fees and Slippage
This is the step that separates useful backtests from fantasy.
Trading costs are real. They stack up on every single trade, and if your strategy trades frequently, they can quietly erase most of your profit.
In CryptoGates’ Backtesting Lab, you can set exchange-specific fees that match the actual partner exchange you plan to use.
Set them accurately.
Then add slippage — the small gap between the price you see and the price you actually get when your order fills.
For most strategies, a conservative slippage estimate of 0.1% to 0.2% per trade is a reasonable starting point.
Run the Test and Record Everything
Run the backtest. Then run it again on a different timeframe. Then on a different pair. Record every result — not just the ones that look good.
This is where discipline matters more than anything.
It’s tempting to cherry-pick the run that produced the best numbers and call it a day.
Don’t. The results that make you uncomfortable are the ones that teach you the most.
A strategy that looks great on the one-hour chart but falls apart on the four-hour chart is telling you something important about why it works — and whether that reason is likely to hold in live trading.
Not sure which
exchange fits you?
Bypass the marketing hype. Our matrix cross-references your profile against 50+ institutional metrics—including Proof-of-Reserves and Slippage Models.
Read the Results Without Bias
Here’s the thing. The goal of backtesting is not to prove your strategy works. The goal is to find out whether it works — and that means actively looking for what’s wrong, not just celebrating what’s right.
A backtest that shows consistent profit with low drawdown across multiple conditions is genuinely exciting.
But before you move forward, ask the hard questions.
Did it only work on one specific pair?
Did it only hold up during trending markets?
Is the win rate high enough to survive a losing streak without blowing the account?
How to Read Backtest Results
Numbers don’t lie. But they do mislead — if you don’t know which ones to look at first, or what they’re actually telling you.
A backtest can show a 200% return and still be a strategy you should never trade live.
Understanding why that’s true is what separates traders who last from traders who blow up.
Three metrics tell you most of what you need to know upfront.
They’re not the only ones that matter, but if these three don’t look right, nothing else will save the strategy.
ROI and Net Profit
Total return is the number everyone looks at first. And honestly, it should be the last number you celebrate — not the first.\
A strategy that returned 150% sounds incredible until you find out it did it through one massive winning trade while losing consistently on everything else.
Net profit across all trades is more meaningful than the headline return.
It tells you whether the strategy made money as a system — not whether it got lucky once.
Look at the profit factor too.
That’s the ratio of total profit from winning trades divided by total loss from losing trades.
A profit factor above 1.5 is generally worth examining further. Below 1.0 means the strategy lost more than it made, regardless of what the ROI number says.
| Metric | What It Measures | Healthy Range |
|---|---|---|
| Total ROI | Overall return on capital | Positive, consistent |
| Net Profit | Profit after all costs | Higher than gross fees |
| Profit Factor | Win dollars vs loss dollars | Above 1.5 |
| Win Rate | % of trades that closed positive | Depends on risk/reward |
| Max Drawdown | Largest peak-to-trough loss | Below 20% preferred |
Maximum Drawdown
This is the number most beginners ignore, and most experienced traders watch more carefully than anything else.
Maximum drawdown tells you the largest peak-to-trough drop your strategy experienced during the test period.
If your account grew to $10,000 and then fell to $6,500 before recovering, that’s a 35% drawdown.
The question you have to ask yourself honestly is, could you sit through that in real life without panicking and closing everything?
Don’t chase win rate. Chase expectancy. Expectancy tells you the average amount you can expect to make per trade across your full system — wins and losses combined. That’s the number that actually predicts whether a strategy survives long-term.
Research Highlight
Drawdown control matters more than headline ROI.
A recent CryptoGates Grid backtest tested a strategy through one of ETH’s sharper corrections — a 27% collapse over 44 days — and the pattern was clear: while a spot holder absorbed the full 26.94% loss, the grid bot’s structured entries and exits limited the damage to 8.36%, still generating $62.74 in live grid profit along the way.
The strategy didn’t avoid the drawdown entirely, but it changed its shape — smaller, more survivable, and easier to plan capital around. This is the core reason experienced backtesters treat max drawdown as a planning number, not a pass/fail grade: it tells you what you’re actually signing up to sit through, not just whether the strategy eventually recovers.
Full breakdown: We Ran a Grid Bot on ETH During a 27% Collapse 💥 It Lost Money. But Not as Much as You Think.
Here’s the issue.
In a backtest, you already know the strategy recovered.
In live trading, you don’t. You’re sitting in that 35% hole, not knowing if it’s a normal rough patch or the beginning of a complete failure.
That uncertainty is what breaks most traders. If the maximum drawdown in your backtest is higher than you could emotionally handle in real life, that strategy isn’t right for you — regardless of what the final return looks like.
Keep the maximum drawdown below 20% if possible. It’s not always achievable, but it’s a useful target that keeps position sizing and risk management honest.
Research on professional systematic traders shows that many consistently profitable strategies operate with win rates between 35% and 55% — far lower than most beginners expect. What separates them is disciplined risk-reward management on every single trade.
Win Rate and What It Actually Means
Wait.
A lot of beginners assume a high win rate means a good strategy. It doesn’t. Not automatically.
A strategy that wins 80% of its trades can still lose money overall if the losing 20% of trades are five times larger than the winning ones.
Win rate only makes sense when you read it alongside average win size and average loss size. That relationship is called the risk-reward ratio, and it’s what actually determines whether a high or low win rate is sustainable.
A strategy with a 40% win rate can be highly profitable if every winning trade returns three times what every losing trade costs. Meanwhile, a strategy with a 70% win rate can quietly bleed an account dry if the losses are always bigger than the wins.
Research Insight
A high win rate feels reassuring, but it doesn’t guarantee the best outcome. A SUI DCA backtest makes the point well: 14 of 15 bot sessions closed in profit — a strong win rate by any measure — including one session that turned a full crash-and-recovery cycle into a $31.33 gain. Yet SUI’s 14.6% rally over the same period handed simple buy-and-hold a $67 edge the bot never closed.
The strategy wasn’t wrong; it was consistent almost every session.
But consistency and outperformance are two different things, and reading win rate without checking it against the size of what was left on the table can create a misleadingly positive picture of a strategy’s actual edge.
Full breakdown: SUI Pumped 14.6% in 46 Days 📈 Our DCA Bot Made $93 — But Missed $67 of It
What is a good win rate in crypto backtesting?
There’s no universal answer.
A 40% win rate can be highly profitable with a strong risk-reward ratio, while a 75% win rate can still lose money if losses consistently outsize wins. Always read win rate alongside average win size, average loss size, and profit factor before drawing any conclusions.
Neutralize Volatility.
Own the Growth.
Access systematic playbooks designed to eliminate emotional bias. From Spot HODL frameworks to advanced Grid simulators.
Common Backtesting Mistakes That Destroy Results
A backtest can look perfect and still mean nothing.
That’s not a flaw in the concept — it’s a flaw in how most people execute it.
These four mistakes are responsible for the majority of strategies that perform beautifully in testing and collapse immediately in live trading.
Knowing what they are isn’t enough. You have to actively check for each one every single time you run a test.
Look-Ahead Bias
This is the most dangerous mistake in backtesting — and the sneakiest. Look-ahead bias happens when your strategy uses information that wouldn’t have been available at the moment the trade was supposed to be placed.
Here’s a simple example.
If your entry signal is based on a candle closing above a certain level, but your backtest places the trade at the open of that same candle — before it’s closed — you’ve used future information to make a past decision.
The strategy looked at data it couldn’t have seen in real time. Every result built on that is fiction.
In CryptoGates’ Backtesting Lab, trade execution is based on confirmed candle closes by default.
That’s not a minor detail. It’s the difference between a backtest that reflects reality and one that reflects a fantasy version of how trading works.
Overfitting to Historical Data
Here’s the interesting part. The more you tweak a strategy’s parameters to improve its backtest results, the more likely you are to build something that fits the past perfectly and fails in the future.
This is called overfitting — or curve-fitting. You adjust the moving average from 14 to 17 periods. You change the RSI threshold from 30 to 33.
Each change makes the backtest look slightly better. But what you’re actually doing is teaching the strategy to memorize specific historical price patterns rather than identify a genuine, repeatable edge.
A real edge works across different parameters, different pairs, and different time periods — not just on the exact settings you tuned it to. If your strategy only produces good results within a very narrow set of parameters, treat that as a warning sign, not a success.
Mid-thought — actually, here’s a better way to think about it.
If you had to explain why each parameter is set the way it is, and the only honest answer is “because it made the backtest look better,” that’s overfitting.
Every setting should have a logical reason behind it that exists independently of the results it produces.
The Truth in Numbers.
Designed for the 10% who require absolute clarity. We strip away the hype to reveal the structural reality of the crypto markets.
Ignoring Fees, Slippage, and Spreads
Look. This one sounds obvious. And yet it’s one of the most common reasons a strategy that backtests profitably fails immediately in live trading.
Trading fees apply to every single trade. On a high-frequency strategy that places dozens of trades per week, even a seemingly small fee — for reference, Binance’s standard spot trading fee sits around 0.1% per side — compounds into a significant drag on returns.
Add slippage — the difference between the price your strategy targets and the price the market actually fills at — and spreads on less liquid pairs, and a strategy with thin margins disappears entirely.
Always run your backtest with fees set to match the actual exchange you plan to use.
CryptoGates’ partner exchanges each have specific fee structures — use the real number, not an estimate that flatters your results.
Then add a conservative slippage buffer on top. If the strategy still shows profit after that, you’re looking at something that might actually survive contact with a real market.
Reality Check
Common belief: a strategy needs to run near-zero fees to be considered “efficient.” What CryptoGates research found: fee load matters less than when the strategy is active.
In a May 2025 BTC grid backtest, the bot activated late into the month’s 10.4% rally and still returned 7.74% ROI — while keeping total trading costs to just $3.26 across the entire run. It didn’t beat buy-and-hold that month, but the low fee footprint meant almost none of the return was quietly eaten by execution costs.
Why it matters: a backtest that only looks profitable at zero fees isn’t showing you an edge — it’s showing you a number that won’t survive live trading. Checking the fee-to-profit ratio, not just the ROI headline, is what separates a real result from an inflated one.
Full breakdown: BTC Pumped +10% in May 🚀 Our Grid Bot Made +7.74% 💰— With Only $3.26 in Fees
Testing Only in Bull Markets
This one is surprisingly easy to fall into — especially in crypto, where the most memorable and talked-about periods are almost always massive bull runs.
A strategy that only works when prices go up isn’t a trading strategy.
It’s a long-only bet dressed up as a system. Real strategies need to survive bear markets, sideways grinds, and sudden violent reversals — because all three will happen, as this ETH DCA bot backtest through a 32% crash shows.” The question is whether your strategy has a plan for each one.
When you set up your data range in CryptoGates’ Backtesting Lab, deliberately include periods of significant drawdown in the broader market.
If the strategy holds up through those periods — lower returns, maybe, but controlled losses and no catastrophic blowup — that’s meaningful. If it collapses the moment price stops going up, you’ve found the most important thing the backtest could have told you.
Research Insight
Many traders assume a strategy only needs to prove itself during a rally. But a backtest limited to a single bull phase tells you almost nothing about survivability.
Our internal testing on a TAO DCA strategy shows why: the asset pumped 36%, then round-tripped back down to a 17% loss for anyone simply holding — yet 139 of 140 bot sessions still closed in profit, banking $1,677 across the full cycle. The result wasn’t luck from one favorable stretch; it came from the strategy being tested across both the rise and the reversal.
This is the exact gap “bull-market-only” backtests hide — a strategy can look flawless on the way up and still be structurally untested for the moment it matters most: the way back down.
Full breakdown: TAO Pumped 36%, Then Bled Back to a 17% Loss 📉 Our DCA Bot Still Banked +$1,677
Backtesting vs Paper Trading vs Live Trading
Most traders treat these three things as interchangeable.
They’re not.
Each one has a specific job in the process of building a strategy you can actually trust — and using them in the wrong order, or skipping one entirely, is how good strategies get abandoned too early, and bad ones get traded too long.
Think of it as three stages of the same journey.
Backtesting is where you design and stress-test the blueprint. Paper trading is where you watch it perform in real-time conditions without financial risk.
Live trading is where you commit real capital — but only after the first two stages have given you genuine reasons to believe in what you’re trading.
Stop Guessing.
Stress Test Your Edge.
The market doesn’t care about your backtest. Our engine simulates 1,000+ “what-if” scenarios to ensure your strategy is built for survival.
Run Crypto Strategy Engine →What Paper Trading Adds That Backtesting Can’t
Backtesting works on historical data.
That’s its strength — you can test across years of price history in minutes. But historical data is clean in a way live markets never are.
Real-time markets have order book dynamics that historical candles don’t capture.
They have moments where your order doesn’t fill at the price you expected because liquidity dried up in that exact second.
They have news events that move prices before any indicator has time to react. Paper trading — running your strategy in real-time without using real money — surfaces all of these things in a way no backtest ever can.
Here’s the thing. Paper trading won’t tell you whether your strategy is profitable over a long period. That takes too long, and the sample size is too small.
What it does tell you is whether the strategy behaves in live conditions the way the backtest suggested it would.
If the two look completely different, something in the backtest assumptions was wrong — and it’s far better to find that out during paper trading than after you’ve deployed real capital.
When You’re Ready to Go Live
Honestly, there’s no perfect moment. But there are clear signals that a strategy is ready for real capital — and clear signals that it isn’t.
A strategy is worth considering for live trading when the backtest shows consistent performance across multiple market conditions, the paper trading results roughly match what the backtest predicted, the maximum drawdown is something you could genuinely sit through without panic-selling, and the position sizing means a full losing streak wouldn’t threaten your overall capital.
| Stage | Purpose | Risk Level |
|---|---|---|
| Backtesting | Test logic on historical data | Zero |
| Paper Trading | Confirm behavior in real-time | Zero |
| Live Trading (small) | Validate with minimal real capital | Low |
| Live Trading (scaled) | Deploy full strategy with confidence | Managed |
A strategy is not ready when you’re going live because you’re bored with testing, because the market is moving, and you feel like you’re missing out, or because the backtest looked great on one pair during one market phase.
Those aren’t reasons. Those are emotions wearing the costume of reasons.

Sheila Warren, CEO, Crypto Council for Innovation
Start live trading with the smallest position size that still feels real to you.
Not the size you’d eventually want to trade.
The smallest size that still carries enough consequence to keep you honest. Scale up slowly — only when real results confirm what the backtest and paper trading already suggested.
Start Testing. Stop Guessing.
The traders who last in crypto aren’t the ones with the best instincts or the hottest tips.
They’re the ones who tested before they risked, who read the results honestly, and who built their confidence on data rather than hope.
A crypto backtesting guide is only useful if it changes how you actually behave. Not just what you know.
The knowledge that backtesting matters means nothing if you still go live on an untested strategy because the market is moving and FOMO is louder than logic in that moment.
CryptoGates’ Backtesting Lab exists to remove every excuse not to test. No code. No spreadsheets. No complicated setup. Define your rules, set your data range, configure realistic fees, run the test, and read the results honestly.
That’s the process. It’s not glamorous. It’s not exciting.
But it’s the only approach that gives a retail trader a genuine, repeatable edge in a market where the majority of participants are losing money.
Test first. Always.
FAQs
How much historical data do I need for crypto backtesting?
For most strategies, a minimum of one to two full market cycles is ideal — covering at least one significant bull run and one bear market.
More data gives your results more statistical weight, but quality matters more than quantity.
Gaps, errors, or low-resolution data on shorter timeframes can distort results more than a smaller, clean dataset would.
Can I backtest any crypto strategy without coding?
Yes. CryptoGates’ Backtesting Lab is built for traders who want real results without writing a single line of code.
You define the rules, set the parameters, and the platform runs the test against real historical price data from partner exchanges — no technical background needed.
Why does my backtest show profit, but live trading loses money?
The most common reasons are look-ahead bias in the backtest setup, fees and slippage set too low or ignored entirely, overfitting to a specific historical period, and position sizing that doesn’t account for real drawdown behavior.
If live results consistently underperform backtest results, revisit each of those four areas before changing the strategy itself.