Bitcoin
  Ethereum
  BNB
BNB  XRP
XRP  Solana
  TRON
TRON  Hyperliquid
  Dogecoin
  Zcash
Zcash  Cardano
  Stellar
  Hedera
  Sui
Sui  Shiba Inu
  Bittensor
  World Liberty Financial
  Aster
Aster  Ripple USD
  Polkadot
  Render
  Artificial Superintelligence Alliance
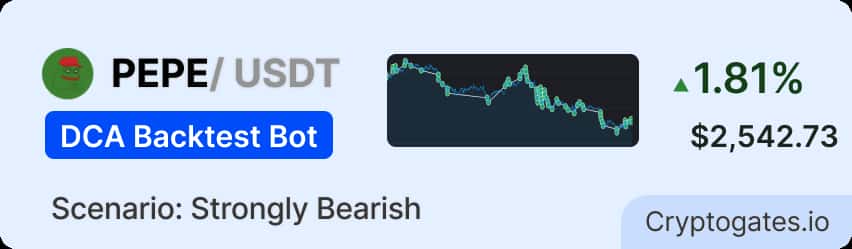
PEPE Was Dying. Slowly. On Purpose.
PEPE hit its all-time high of $0.00002803 on December 9, 2024 — then began one of the most calculated, relentless distribution bleeds of the entire cycle.
By March 31, 2025, it had fallen to $0.0000072. That’s a 64% wipeout in 112 days — not from a panic crash, but from sustained whale exits and fading retail attention. Every mini-pump got sold. Every “bounce” lasted hours, not days.
Spot holders who bought at the open and held to the end lost $704.79 on every $1,100 invested. The question wasn’t whether PEPE would recover — it was whether a DCA bot could extract profit from the carnage before recovery ever came.
The question we wanted to answer: Can a properly staged DCA bot generate consistent profit during a sustained 64% memecoin bleed — entirely through accumulate-and-scalp mechanics, without ever needing a trend reversal?
We ran this backtest across 112 days of real Binance 1-minute OHLCV data to find out.
Strategy Parameters
How Each Setting Impacted Performance?
Parameter Impact Summary
| Parameter | Impact | The Logic (Why) |
|---|---|---|
| 300 USDT Base Order | Low initial exposure | Capital preserved for DCA layers |
| 3% DCA Step | Weekly trigger frequency | Matches PEPE's slow-bleed rhythm |
| 14 Max Orders | Full bleed coverage | Survives 40%+ drawdowns without stopping |
| 1.2x Multiplier | Back-weighted capital | Heavier buys at deeper discounts |
| 2.5% Take Profit | 99 TP hits fired | Catches dead-cat bounces reliably |
265 Trades. $2,542.73 Profit. $25.68 Per Closed Session.
The Math That Matters
💰 Real Yield on Strategy Capital:
The bot reports 1.81% ROI on total deployed capital — but that’s the wrong number to anchor on. On the 5,000 USDT strategy budget, the bot returned $2,542.73. That’s a 50.85% return in 112 days on committed capital. Monthly equivalent: ~13.6% per month. Annualized projection: ~163% per year — though that figure assumes similar market oscillation, which cannot be guaranteed.
⚡ The Multiplier Effect:
99 sessions at an average of $25.68 profit each — that’s the engine. But Session 7 tells the real story: 10 DCA orders fired across 12 days of sustained bleed, deploying $7,793.45 total, returning $182.86. That single session captured the deepest accumulation zone of January 2025. The 1.2x multiplier meant capital deployed at the bottom was the largest — exactly the mechanic it was designed to trigger.
🛡️ Fee Drag — Honest Assessment:
$105.56 in fees across 265 orders is not trivial. Fee drag consumed 4.15% of gross profit. At higher fee rates (0.1%+), that number would cross 5.5%. The 0.00075 (0.075%) rate here is the Binance maker rate with BNB discount — this strategy requires that rate. At retail 0.1% taker fees, recalibrate your expectations accordingly.
| Variant | DCA Step | TP % | Sessions | Orders | P&L USDT |
|---|---|---|---|---|---|
| A 🐢 Too Tight | 1.5% | 1.9% | 9 | 25 | -$2,212.33 |
| B 💀 Knife-Catcher | 5% | 5% | 4 | 21 | -$2,155.57 |
| C 🎯 Playbook This Playbook | 3% | 2.5% | 99 | 265 | +$2,542.73 |
Strategy A filled all 5 orders in the first week of the bleed, then sat idle for 3 months holding a bag it couldn’t sell.
Strategy B waited for 5% dips, which happened, but not cleanly enough for 10 orders to ever stack, leaving capital stranded and sessions never closing.
Strategy C’s 3% step hit real accumulation zones repeatedly across the full 112-day grind. The difference between winning and losing here wasn’t skill — it was order count and step calibration.
What the results are really telling you.
✅ what worked
The 3% DCA step matched PEPE’s actual oscillation depth during the slow bleed. Session 7 — the most stressful session of the backtest — deployed 10 orders across 12 days and returned $182.86 when the dead-cat bounce finally hit.
The 1.2x multiplier concentrated the heaviest capital at the lowest prices, and the 2.5% TP was loose enough not to miss bounces but tight enough to fire on mini-pumps. 99 TP hits in 100 sessions is near-perfect execution.
⚠️What didn't work
Session 1 incomplete remains open at the backtest end; this is the unavoidable tail risk. When a session opens near the end of the backtest window, and PEPE never bounces 2.5% before March 31, the position stays open. In a live deployment, that session would still be holding unrealized loss.
The 93.12% max drawdown is the honest cost of running 14 DCA orders into a 64% declining asset — this bot demands psychological discipline that most retail traders underestimate.
💡 The key insight
DCA bots don’t need the market to go up. They need the market to breathe.
PEPE fell 64% over 112 days — but it didn’t fall in a straight line. There were daily oscillations, brief relief pumps, and micro-recoveries.
The bot didn’t care about the trend. It cared about the 2.5% bounce after the 3% dip. That happened 99 times. The optimal DCA configuration for a slow bleed isn’t about catching the bottom — it’s about sizing your step to match the coin’s actual daily volatility range, so your bot fires often enough to compound small wins before the big recovery ever arrives.
🚩 Watch out for - a potential red flag
The 93.12% max drawdown is not your account balance dropping 93%. It means one open session had 93.12% of that session’s capital deployed in unrealized loss at peak exposure. In practice: Session 7 deployed $7,793 across 10 orders and was underwater for 12 days before the TP hit.
If you panic-closed that session manually, you’d have locked in a $500+ loss on the bot’s single most profitable session. The 93.12% figure is normal for this structure — but it requires you to have the full $5,000 liquid, leave the bot alone during drawdown, and never intervene emotionally. Never deploy this strategy without confirming the complete $5,000 budget is committed and untouched.
🧭 When This Strategy Works Best
Ideal Conditions:
✔ Slow bearish bleeds with consistent mini-pumps (exactly this backtest)
✔ High-oscillation markets with 3–8% daily swings
✔ Sideways/consolidating markets where price chops without direction
✔ Any memecoin in a post-ATH distribution phase with recurring dead-cat bounces
🚫 When NOT To Use This Strategy
Avoid when:
❌ The asset is in a straight-down crash with zero bounces (orders fill, nothing exits)
❌ Strong bull run where PEPE rarely dips 3% before surging higher (bot sits idle)
❌ Very flat market with sub-1% daily range (no triggers fire, capital sits dead)
❌ You cannot leave the full $5,000 committed and untouched for weeks at a time
📊 Expert Rating
Profitability: ⭐⭐⭐⭐☆
Risk Control: ⭐⭐⭐☆☆
Capital Efficiency: ⭐⭐⭐⭐☆
Beginner Friendly: ⭐⭐⭐⭐☆
Market Adaptability: ⭐⭐⭐☆☆
🏆 Overall Score
8.7 / 10 — Elite Slow-Bleed DCA Configuration
✔ Quick Takeaways
✔ PEPE fell 64% in 112 days. The bot closed 99 of 100 sessions in profit anyway.
✔ The 3% DCA step matched PEPE’s actual bounce rhythm — not too tight, not too wide.
✔ The 1.2x multiplier deployed the most capital at the cheapest prices — by design.
✔ Session 7 alone returned $182.86 — deploying $7,793 across 10 orders during the deepest dip.
✔ 93.12% max drawdown is session-level exposure, not total account loss — don’t panic-close.
✔ Fee drag was 4.15% of profit — real, but manageable at the 0.00075 Binance rate.
✔ Spot buy-and-hold returned −$704.79 in the same period. This bot returned +$2,542.73 — a $3,247.52 difference.
What did spot buy & hold actually return?
The opportunity cost of not running this bot: $3,247.52.
That’s the gap between making $2,542.73 and losing $704.79 on the same asset in the same period. The bot didn’t just outperform — it ran in the opposite direction of the underlying asset. PEPE was in freefall. The bot was compounding.
Before you run this playbook, check these off.
Use this as your go/no-go checklist before deploying this exact parameter set.
🧠 Market Suitability Matrix
| Market Condition | Rating | Strategic Notes |
|---|---|---|
| Slow Bleed / Post-ATH Distribution | ★★★★★ Excellent | This is exactly what this backtest tested — and it dominated. |
| High Oscillation / Choppy Sideways | ★★★★★ Excellent | Frequent 3% swings fire sessions continuously; TP hits compound fast. |
| Mildly Bearish / Slow Decline | ★★★★☆ Good | Sessions fire and close; deeper drawdown per session, but still profitable. |
| Mildly Bullish / Slow Climb | ★★★☆☆ Moderate | Bot fires less often; single-order sessions dominate; lower capital efficiency. |
| Strong Bull Run / Fast Uptrend | ★★☆☆☆ Risky | PEPE pumps past 2.5% without dipping 3% first — bot sits idle, opportunity cost high. |
| Strong Bear / Crash (−50%+ fast) | ★☆☆☆☆ Poor | All 14 orders fill rapidly; TP never hits; capital locked at massive unrealized loss. |
| Very Low Volatility / Flat Market | ★☆☆☆☆ Poor | 3% step never triggers; bot idles; full capital dead weight. |
How to tune this playbook for different scenarios.
Disclaimer: All data sourced from CryptoGates DCA Backtest Bot. Results are historical simulations using Binance 1-minute OHLCV data. Past backtest performance does not guarantee future live trading results. DYOR.
Battle-Test Your Strategy
Before the Market Does.
Eliminate guesswork with institutional-grade backtesting for DCA, Grid, and Rebalance bots. Real historical data. Real-world results.