Bitcoin
  Ethereum
  Solana
  TRON
TRON  Hyperliquid
  Dogecoin
  Zcash
Zcash  Cardano
  Stellar
  Hedera
  Sui
Sui  Shiba Inu
  Bittensor
  World Liberty Financial
  Aster
Aster  Ripple USD
  Polkadot
  Render
  Artificial Superintelligence Alliance
One coin was on fire. The other was drowning. The bot didn't care.
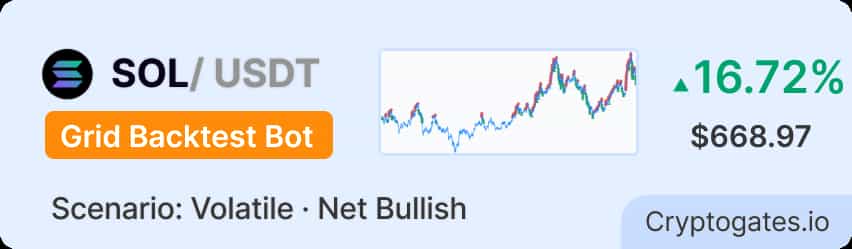
SOL entered March 10, 2026, at $94.95 — already showing signs of weakness in what had been a choppy altcoin market.
By April 25, SOL had closed at $83.20. That’s a $11.75 drop per coin, a −12.37% hit for anyone holding spot.
Meanwhile, ETH moved the other way. It opened at $1,992.97 and closed at $2,105.43 — a clean +5.64% gain over the same 46-day window.
This is the textbook “narrative rotation” scenario. Capital rotating out of one Layer-1 and into another. For a 50/50 portfolio holder, these moves partially cancel out — but which asset falls harder determines your outcome.
The Question: Does actively rebalancing between two diverging assets help or hurt?
We ran this backtest across the full 46-day window on real Binance 1-minute OHLCV data to find out.
SOL (50% target)
ETH (50% target)
Strategy Parameters
How Each Setting Impacted Performance?
Every parameter was working against the worst-case scenario here — one asset in freefall, one on a run. March showed exactly where each setting earns its keep.
Parameter Impact Summary
| Parameter | Impact | The Logic (Why) |
|---|---|---|
| 50/50 Allocation | ⚖️ Softened SOL loss | ETH gains partially offset SOL crash |
| 2% Ratio Threshold | 🔄 Triggered 1 timely rebalance | Caught allocation drift at $81.02 SOL |
| By Coin Ratio Logic | 📐 Systematic, not emotional | Rebalanced on drift, not gut feel |
| No Time Rebalance | 🛡️ Eliminated unnecessary swapsg | Kept fee drag at $1.02 total |
| 0.1% Fee / Conversion | 💰 Locked in gains cleanly | Crystallized $1,016.97 final value |
2 swaps. $1.02 in fees. +$16.97 in profit.
📝 The math that matters
💰 The Real Monthly Yield
$16.97 net profit on $1,000 capital is a 1.697% effective monthly yield. Annualized over a 46-day basis, that projects to roughly 13.46% annually — conservative, realistic, and without leverage.
The bot reports 1.70% ROI. The annualized figure (based on the actual 46-day window × 365/46) gives a better sense of compounding potential: approximately 13.5% per year if this market condition repeated consistently. It won’t always repeat — but the structural math is sound.
⚡ Fee Efficiency
$1.02 in fees consumed 5.67% of gross profit ($17.99 before fees). That’s a meaningful bite for just 2 swaps — driven primarily by the $1.00 initial entry fee on a $1,000 position. The actual rebalancing swap cost just $0.02. At 0.1% per trade, the fee structure is efficient, but entry size matters.
🛡️ The Edge Over HODL
The rebalancing edge of +0.11% ($1.10 in absolute terms) looks small. It is small. But it’s on the right side of the line. In a scenario where SOL dropped 12.37%, buying more SOL on March 13 at $81.02 was a bet on mean reversion — and that bet narrowly paid off.
Here comes our A/B/C strategies quick comparison:
| Variant | Threshold | Trades | ROI % | P&L (USDT) |
|---|---|---|---|---|
| AThis Playbook | 2% | 2 | 1.70% | 16.97 |
| B | 2% | 2 | 1.70% | 16.97 |
| C | 5% | 1 | 1.69% | 16.90 |
Variants A and B produced identical results — the 30-minute time trigger in B added no additional trades because the 2% ratio threshold wasn’t crossed again. Variant C (5% threshold, 1 trade) earned $0.07 less, because the single rebalancing event in Variant A happened to capture a favorable entry at $81.02 SOL.
The gap is tiny. The more important observation: even the most passive variant (C) still beat HODL at +1.69%. In a divergent market, rebalancing adds value regardless of threshold — because mean reversion between paired assets is structural, not coincidental.
What the results are really telling you.
✅ what worked
The single rebalance on March 13 fired at $81.02 SOL — near the local low for the period. The bot sold ETH (which was appreciating) to buy SOL (which had dipped) at precisely the moment the 2% drift threshold was crossed.
That $19.93 SOL purchase recovered as SOL partially stabilized before the month-end conversion.
⚠️What didn't work
SOL’s −12.37% decline was not fully recovered by close. Every dollar the bot allocated to SOL at rebalance ($19.93 at $81.02) was still sitting on a loss at April 25 ($83.20 close). The recovery was partial, not full.
The $61.85 loss on the SOL allocation far exceeded the $28.20 gain on ETH. The rebalancing edge of +0.11% over HODL is real — but it masked the fact that the strategy was managing a losing position the entire period. If ETH had also declined, this playbook would have looked very different.
💡 The key insight
Rebalancing earns its edge when assets diverge and then partially converge — not when one asset trends uninterrupted in one direction.
SOL and ETH are both Layer-1 smart contract platforms. They share macro market correlation. When one dramatically underperforms the other, mean reversion pressure builds — capital eventually rotates back. The rebalancer systematically positions itself to capture that rotation before it happens.
The takeaway: This strategy is not about predicting direction. It’s about being structurally positioned on both sides of a correlated pair, buying dips automatically, and letting the market’s natural oscillation generate returns.
The real danger is not divergence. It’s permanent decoupling. If SOL had fundamentally broken down — a protocol failure, a regulatory event — no amount of mean reversion would have rescued the position.
🚩 Watch out for - a potential red flag
The −12.37% SOL price decline was manageable here because ETH’s +5.64% gain cushioned the blow. That cushion will not always exist.
If both assets decline simultaneously (the March 2025 BTC/ETH scenario), this strategy struggles — rebalancing between two falling assets just redistributes losses. The +0.11% edge in this playbook was entirely dependent on ETH holding positive.
Furthermore, with only 2 swaps over 46 days, the strategy’s “activity” was minimal. A longer bearish period for SOL with no ETH recovery would have left capital stranded in a depreciating asset with no mechanism to exit.
Before deploying: verify that your paired assets have genuine historical mean-reversion behavior. If one is experiencing a structural narrative breakdown — not temporary volatility — reduce that asset’s allocation weight or widen the rebalance threshold before running live.
Overall Performance Score, Strengths and Limitations
Solid Divergent-Market Edge
The strategy delivered positive ROI in a scenario where the passive holder barely broke even. +1.70% over 46 days with $1.02 in fees is an efficient outcome — but the margin over HODL (+0.11%) leaves little room for error in worse conditions.
🧭 What this strategy does well
- Positive ROI while SOL dropped 12.37%
- Outperformed HODL in a genuinely adverse condition
- Minimal fee drag — only 2 swaps in 46 days
- Single rebalance fired near the local SOL low
🚫 What went wrong this month
- +0.11% edge over HODL is thin — conditions need to align
- SOL position still underwater at close ($83.20 vs $81.02 entry but $94.95 original open)
- Low swap count means strategy is sensitive to timing of the single rebalance event
- Both-assets-falling scenario would produce significant losses
Quick Takeaways
- Diverging assets are this strategy’s best friend — mean reversion is the engine
- Fewer swaps = lower fees, but also fewer opportunities to capture dips
- The 2% threshold triggered precisely once, near a local low — timing was favorable
- ETH’s gain was the hidden safety net; remove it and results deteriorate sharply
- Positive rebalancing edge (+0.11%) is real but narrow — verify market conditions before every deployment
How did passive HODL compare?
If you had simply bought $1,000 of SOL and ETH on March 10 at $94.95 and $1,992.97 respectively and held, here’s how it compares:
This month, doing absolutely nothing would have outperformed active rebalancing by $1.40. That’s the honest result. It doesn’t mean rebalancing is a bad strategy, it means March 2025 was the wrong market condition for it.
A strategy that beats its benchmark 7 months out of 12 can still lose to it in specific months. Understanding which months those are and why is exactly what this playbook is for.
Before you run this playbook, check these off.
Use this as your go/no-go checklist before deploying this exact parameter set.
🧠 Market Suitability Matrix
| Market Condition | Rating | Strategic Notes |
|---|---|---|
| Both assets sideways / choppy | ★★★★★ Excellent | Constant drift triggers, consistent mean reversion |
| One asset dips, then recovers | ★★★★★ Ideal | Systematic dip-buying at its most effective |
| Both assets in a mild bull market | ★★★★☆ Good | Trim winners, fund laggards before they recover |
| One asset strongly outperforms | ★★★☆☆ Moderate | Continuously selling winner into strength; drag builds |
| Both assets are in steep decline | ★★☆☆☆ Risky | Redistributing losses; no winning asset to harvest |
| One asset in the structural breakdown | ★☆☆☆☆ Poor | Buying a fundamentally broken asset all the way down |
| Highly correlated assets | ★☆☆☆☆ Poor | Choose moderate correlation to capture spreads. |
How to tune this playbook for different scenarios.
Disclaimer: All data sourced from CryptoGates Rebalance Backtest Bot. Results are historical simulations using Binance 1-minute OHLCV data. Past backtest performance does not guarantee future live trading results. DYOR.
Battle-Test Your Strategy
Before the Market Does.
Eliminate guesswork with institutional-grade backtesting for DCA, Grid, and Rebalance bots. Real historical data. Real-world results.