Bitcoin
  Ethereum
  BNB
BNB  XRP
XRP  Solana
  TRON
TRON  Dogecoin
  Hyperliquid
  Zcash
Zcash  Stellar
  Cardano
  Hedera
  Sui
Sui  Shiba Inu
  Bittensor
  World Liberty Financial
  Aster
Aster  Polkadot
  Ripple USD
  Render
  Artificial Superintelligence Alliance
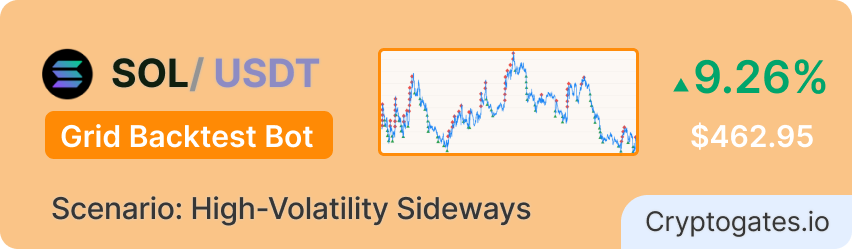
SOL crashed 73%. Then it went nowhere. The grid printed anyway.
SOL entered March 2026 at $84.35 — deep in the aftermath of a 73% crash from its $295 ATH. By April 30, it closed at $83.00. A two-month drift to essentially nowhere.
For a spot holder, this was the worst kind of market: not a crash, not a recovery. Just dead weight.
The grid bot didn’t care. While holders watched SOL oscillate between $80 and $97 for 60 days, the bot fired 146 trades — extracting $462.95 in net profit from the same price action that rewarded patient holders with nothing.
The Question
Can a well-placed grid bot beat a market that goes nowhere? This two-month backtest on SOL/USDT answers it — with 5,000 USDT deployed, 20 grids, and a manually set $80–$97 range targeting SOL’s confirmed post-crash consolidation zone.
Strategy Parameters
How Each Setting Impacted Performance?
Grid bots aren’t complex — but the relationship between parameters and outcomes is. In this 8-week backtest, every setting had a direct fingerprint on the final result.
The range placement was the master key. Everything else amplified or limited what that key unlocked.
Parameter Impact Summary
| Parameter | Impact | The Logic (Why) |
|---|---|---|
| Manual Range $80–$97 | ✅ Ideal zone placement | SOL stayed inside range |
| 20 Grids | ⚖️ Balanced frequency | Enough levels, not too thin |
| Arithmetic Spacing | 🔄 Consistent profit cycles | Equal spacing, equal gains |
| $250 Grid Size | 💰 Healthy capital per level | Liquid fills, no missed orders |
| 3% Profit/Grid | 📈 High per-trade capture | Matches SOL volatility band |
| 0.08% Fee (OKX) | ✅ Minimal fee drag | Lower than Binance 0.1% |
146 trades. $598.58 grid profit. $3.17 per completed cycle.
💰 The Bottom Line:
This strategy delivered $462.95 net profit on $5,000 capital over two months — a 9.26% total yield. The bot reports a 183.60% annualized ROI, but treat that as a ceiling, not a target. It assumes perfect compounding across every month, which markets won’t give you.
⚡ Efficiency or Idle Capital?
The 72.65% grid efficiency is healthy — it means active capital was put to real work inside the $80–$97 range. Unlike setups where most capital sits idle, this grid had SOL oscillating through its levels throughout the full 8 weeks.
The final portfolio shows $1,430.58 in cash USDT and 48.47 SOL in base quantity. A portion of capital naturally remains deployed as open buy orders — this is expected grid mechanics, not stranded capital.
🛡️ The Fee Advantage:
Total fees paid: $30.53 on $598.58 gross profit — a fee drag of 5.1%. That’s higher than a low-frequency grid but completely reasonable for 146 trades over 60 days. The OKX rate of 0.08% per trade saved approximately $14 compared to running the same setup on Binance at 0.1%.
Here comes our A/B/C strategies quick comparison:
| Variant | Range | Grids | Trades | Grid Profit | ROI % |
|---|---|---|---|---|---|
| A | Manual | 10 | 62 | $637.43 | 10.65% |
| B | Manual | 50 | 564 | $633.59 | 9.01% |
| CThis Playbook | Manual | 20 | 146 | $598.58 | 9.26% |
Variant A’s 10-grid setup produced the highest gross profit ($637.43) with the fewest trades (62) — but each grid step was $1.70 wide, meaning price had to swing more between fills. Variant B maxed trade frequency at 564 but paid more in fees and diluted capital per level down to $100.
Test C hits the sweet spot: 20 grids at $250 per level — enough frequency to capture the $80–$97 oscillation without over-diluting capital or over-paying fees. That’s why it’s the playbook.
What the results are really telling you.
✅ What Worked
Deploying at the mid-range ($88.50) — not at the top — was the decisive call. This split capital equally across buy orders below and sell orders above entry, activating both sides of the grid from day one.
On March 1 alone, the bot fired a rapid sell sequence: $85.02, $85.89, $86.76, $87.65, $88.54 — five completed cycles in the opening hours. Each SOL sell at a 3% profit target above the buy price netted approximately $3.17 after fees.
That’s the grid working at full speed: SOL oscillating, every swing a completed cycle.
⚠️ What Didn't Work
SOL closed at $83.00 on April 30 — near the bottom of the grid range. This means active buy orders from the $80–$84 zone accumulated SOL that hadn’t yet triggered sell orders by backtest end.
The result: $1,430.58 sits as cash USDT and 48.47 SOL as base quantity — capital still working, but not yet realized as profit. The $462.95 net profit figure is realized only; unrealized P&L would push the actual portfolio value to $5,462.95.
This isn’t a loss — but it is deferred profit that requires SOL to stay above entry prices to fully close.
💡 The Key Insight
Grid bots don’t need a coin to go up. They need it to move.
SOL’s 73% crash created the perfect setup condition: a coin with high average daily swing ($2–$5) trapped inside a confirmed consolidation band. The $80 floor had real structural demand (FTX unlock absorption data), and $97 acted as a supply ceiling. This wasn’t a guess — it was a zone.
Deploying at mid-range ($88.50) rather than the range top prevented the catastrophic outcome seen in a previous SUI setup, where top-range deployment left the bot fully long in a depreciating asset.
The lesson: identify your range structurally first, then deploy at the center. That single decision determines whether the grid works from day one or waits for a recovery that may never come.
🚩 Watch Out For — A Potential Red Flag
SOL closed at $83.00 — inside the range, but near the bottom. If the next move is a break below $80, the bot shifts into full accumulation mode: all capital deployed as open buy orders with no sells triggering. You’d hold 48+ SOL with no remaining USDT to buy lower.
This grid’s downside scenario isn’t a total loss — it’s capital lock. $5,000 USDT becomes $5,000 worth of SOL at whatever price it falls to. Recovery requires SOL to bounce back above your average buy price before any realized profit is possible.
Always confirm SOL is above $82 (within 2–3% of the lower boundary) before running this exact parameter set. If SOL is trading below $80, do not deploy — the entire premise of the $80 demand floor as a structural support needs revalidation first.
Overall Performance Score, Strengths and Limitations
Structurally Sound — Deployed at the Right Altitude
9.26% over two months on a coin that went nowhere. Spot holders earned zero. Mid-range deployment and SOL's $2–$5 daily swing did the work.
🧭 STRENGTHS
- 9.26% two-month return vs. buy & hold's −1.62% — an +10.88% delta advantage
- Mid-range deployment activated both buy and sell orders immediately
- 72.65% grid efficiency — capital worked consistently throughout
- Low max drawdown of 5.87% — controlled downside exposure
- OKX 0.08% fee rate kept drag to 5.1% of gross profit
🚫 LIMITATIONS
- $462.95 is realized profit only; $1,430.58 USDT + open SOL positions remain in play
- SOL closed near range bottom ($83) — next drop below $80 risks capital lock
- Manual range requires structural analysis before every new deployment
- $80 demand floor thesis must be re-confirmed before running again
- Breaks entirely in a sustained downtrend below $80
Quick Takeaways
✔ Mid-range deployment is non-negotiable. Entering at the top of the range means the bot goes immediately long in a depreciating asset. Always deploy at the midpoint.
✔ Structure beats timing. The $80 demand floor wasn’t a guess — it had FTX unlock absorption data behind it. Find the zone first, then deploy.
✔ Sideways markets are grid territory. Buy & hold earned −1.62%. The grid earned +9.26%. The difference is the bot turning oscillation into income.
✔ OKX saves real money at volume. 0.08% vs. 0.1% sounds small — over 146 trades on $250 allocations, it saved ~$14 in fees.
✔ Realized vs. unrealized matters. The final portfolio value includes open SOL positions. Always distinguish what’s cash-realized from what’s still at market risk.
What did spot buy & hold actually return?
If you had simply bought $5,000 of SOL on March 1 at $84.35 and held through April 30, here’s how it compares:
Grid profit of +$462.95 minus buy & hold’s −$81.00 = a $543.95 advantage over two months. The bot didn’t need SOL to recover. It made money while SOL drifted sideways and holders watched their portfolio shrink.
Before you run this playbook, check these off.
Use this as your go/no-go checklist before deploying this exact parameter set.
🧠 Market Suitability Matrix
| Market Condition | Rating | Strategic Notes |
|---|---|---|
| Sideways / Consolidating | ★★★★★Excellent | Exactly this backtest — grid fires on every oscillation |
| High Volatility | ★★★★★Excellent | Wider swings, faster cycling, maximum profit capture |
| Mildly Bearish / Slow Bleed | ★★★★☆Good | Price stays in range; accumulation builds, profit deferred |
| Mildly Bullish / Slow Climb | ★★★☆☆Moderate | Price drifts toward upper boundary; fewer return cycles |
| Strong Bull Run | ★★☆☆☆Risky | Price exits range above $97; bot stops participating entirely |
| Strong Bear / Crash | ★☆☆☆☆Poor | Price falls below $80; full capital locked in SOL, no sells |
| Very Low Volatility | ★☆☆☆☆Poor | Daily swing below $1; no triggers, deadweight $5,000 |
March–April 2026 was a High-Volatility Sideways scenario. The result — +9.26% vs. buy & hold’s −1.62% — is exactly what this matrix predicts.
The grid worked because SOL oscillated. The moment that changes — a sustained break in either direction — the calculus flips entirely.
How to tune this playbook for different scenarios.
Disclaimer: All data sourced from CryptoGates Grid Backtest Bot. Results are historical simulations using OKX 1-minute OHLCV data. Past backtest performance does not guarantee future live trading results. DYOR.
Battle-Test Your Strategy
Before the Market Does.
Eliminate guesswork with institutional-grade backtesting for DCA, Grid, and Rebalance bots. Real historical data. Real-world results.