Author: Zaheer Babar

  • Perfect Range 📏, Weak Results? How Many Grids 📊 to Use in Grid Trading 🎯

    Perfect Range 📏, Weak Results? How Many Grids 📊 to Use in Grid Trading 🎯

    You spent an hour finding the perfect range.

    Support looks clean, resistance keeps rejecting price, and the chart screams chop.

    Then you type a number into the grids box, hit run, and honestly, that one number ends up mattering more than the range did.

    Nearly 9 in 10 individual derivatives traders ended a full year in the red in a large regulator study.

    Source: SEBI

    Most traders never stop to ask how many grids to use in grid trading.

    They copy whatever a fren posted on CT, or they leave the default and hope. That’s a coin flip dressed up as a strategy.

    Same range.Same coin. Same capital.

    Change only the grid count, and the results can look like they came from two different bots.

    EXECUTIVE SUMMARY
    • The Problem: Most grid bot users pick a grid count by guesswork, so a solid range still gives weak or fee-heavy results.
    • The Solution: Treat grid density as one testable lever and compare a few values side by side.
    • The Incentive: You find the balance between fill frequency and fees before real money is on the line.
    • The Risk: Backtests use past data, so a count that fit one range can misfire when volatility shifts.

    How Many Grids to Use in Grid Trading: What Grid Density Really Controls

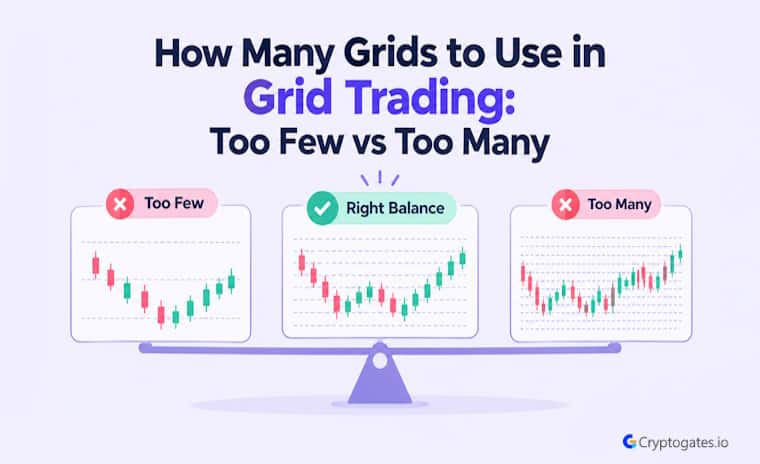
    Grid density is just how many buy and sell levels your grid bot places inside your range.

    Squeeze more levels in, and each step gets smaller.

    Spread fewer levels, and each step gets wider.

    Swipe to view full data →
    Grid Count Spacing Between Levels Order Size Per Level
    Fewer grids Wider Larger
    Moderate grids Balanced Balanced
    Many grids Tighter Smaller

    Sounds simple.

    It isn’t, because that one choice changes trade frequency, order size, and fee impact all at once.

    1. Grid Count vs. Grid Spacing

    Think of it like a staircase.

    Fewer steps mean each one is tall.

    More steps means lots of little ones.

    Your bot earns when the price walks up or down those steps, so step size decides how much movement counts as a trade.

    Small wiggles trigger fills on a tight grid and slip right past a wide one.

    Real Backtest Example

    Strategy: Grid bot, three grid counts tested side by side
    Coin: NEAR/USDT
    Market Condition: 45-day window, same range and capital for every variant
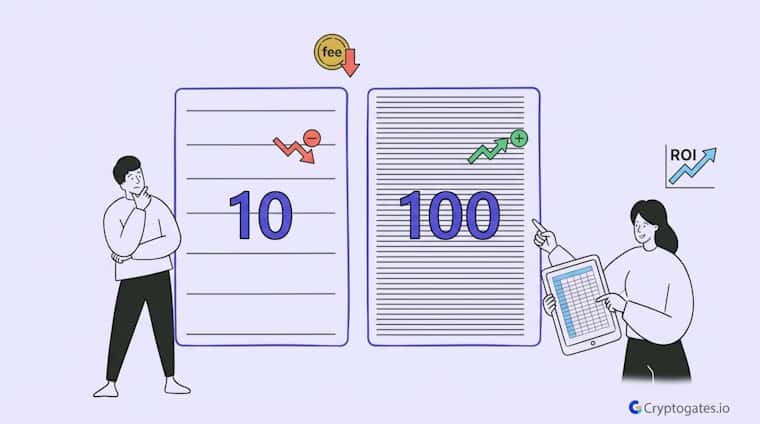
    Objective: Isolate grid count as the only variable: 20 vs. 45 vs. 80 grids.
    Key Result: The 45-grid setup returned +17.18% ROI and was the only variant to beat buy & hold. Both the sparse 20-grid and dense 80-grid versions trailed it.
    Expert Interpretation: Neither extreme won. The sparse grid left fills on the table, and the dense grid gave the edge back somewhere between thinner orders and fees. The middle setting captured enough cycles without over-slicing capital, which is why grid count is worth testing rather than guessing.

    20 Grids, 45 Grids, 80 Grids: Only One Beat Buy & Hold on NEAR

    Here’s the part beginners miss.

    Your capital gets sliced across every level, so tighter spacing also means smaller orders.

    More action, thinner slices.

    2. Why Sideways Markets Put Density in the Spotlight

    In a strong trend, grids get run over.

    Price leaves the range, the bot stops doing its job, and you’re a bagholder waiting for a comeback.

    Sideways action is different.

    Price keeps tagging the same zones, which is exactly what a grid feeds on, since grid trading is designed for prices that fluctuate within a specific range.

    SYSTEM ACCESS: CG4.2

    Stop Guessing.
    Stress Test Your Edge.

    The market doesn’t care about your backtest. Our engine simulates 1,000+ “what-if” scenarios to ensure your strategy is built for survival.

    Run Crypto Strategy Engine →
    ROBUSTNESS SCORE
    75+ STRUCTURAL EDGE
    RISK OF RUIN < 1%
    TARGET HIT 92%

    So in chop, density decides how much of that back and forth you actually capture.

    Set it too sparse and price can wiggle right through a whole… well, you get the idea.

    Set it too tight, and you’re trading noise.

    Fair enough, but which mistake costs more?

    Let’s break that down next.

    Too Few Grids: Missed Fills and Idle Capital

    A sparse grid feels calm. Few orders, few trades, not much to watch.

    Interactive Checklist

    • Price swings back and forth many times without filling a single order
    • Long stretches pass with no trades at all
    • Each fill pays well, but fills show up rarely
    • Most of your capital sits in cash, waiting for a level to get hit
    • Your bot lags plain holding even though the range stayed intact

    But calm can also mean your money is just sitting there while price does laps around it.

    1. Wide Spacing, Fewer Trades, Slower Compounding

    Here’s the interesting part.

    Each fill on a wide grid usually earns more, and that feels great.

    But price has to travel farther to trigger the next order, so smaller swings just pass right through.

    Look at a choppy range, and you’ll see price loop through the same zone a dozen times while a sparse grid sits there doing nothing.

    Research Insight

    Grid bots earn from repetition, and repetition needs a market that keeps revisiting the same zones. Our SUI test showed this clearly.

    Strategy: Grid bot
    Coin: SUI/USDT
    Market Condition: 38 days of volatile chop, with two full crash-and-recover cycles
    Objective: See how much back-and-forth movement a grid can capture when price ends the window almost where it started.
    Key Result: SUI fell about 7.1%, yet the bot fired 1,759 trades and closed at +7.46% ROI. That beat buy & hold by $861.59.
    Expert Interpretation: The range did the heavy lifting. Price kept crossing the same levels, and the grid harvested each pass. Density only pays when the market gives it swings to capture.

    SUI Fell 7% in 38 Days: Our Grid Bot Fired 1,759 Trades and Banked +7.46%

    Fewer grids mean fewer trades.

    Well, usually.

    It depends on how choppy the range is. Either way, compounding needs repeated cycles, and fewer cycles tend to mean slower growth.

    Total profit can end up lower than a denser setup even when every single trade looked healthy.

    2. When a Sparse Grid Still Makes Sense

    A smaller account can run into minimum order sizes, and a denser grid may not even be possible.

    Higher fee tiers change the math too.

    On a calm pair with slow swings, extra levels might never get touched anyway.

    How many grids is best for a grid trading bot?

    There’s no single best number. It depends on your range width, volatility, capital, and fees, so test a few grid counts side by side and compare the balance between profit and trading cost.

    Sparse also means less to babysit, which suits anyone who’d rather touch grass than stare at charts.

    It’s not the villain.

    It’s a trade-off, and you should pick it on purpose.

    Too Many Grids: Fee Drag and Noise Trading

    Dense grids feel productive.

    Trades pile up, the log scrolls forever, and it looks like the bot is printing.

    Sound familiar?

    The most active traders in a landmark study earned about 6.5 points less per year than the market, and the gap came from costs and poor timing.

    Source: Barber and Odean, Journal of Finance

    But activity isn’t the same as edge.

    1. Tiny Orders and Thin Profit per Level

    Your capital gets sliced into many small pieces.

    Each order is small, and each profit per level is small too.

    Fees then take a bite out of both sides of every round trip.

    When the profit per level is thin, a fee that looks harmless starts eating a big share of it.

    CG STRATEGY ANALYZER

    Confused about
    market outlook?

    Trading without a plan is just gambling. Our strategy architect analyzes your risk tolerance and capital to match you with a proven algorithmic framework.

    PASSIVE DCA Bot
    AGGRESSIVE Grid Pro
    BALANCED Rebalance

    Honestly, this is the part people skip.

    Trade count goes up while net gain per trade goes down.

    Degen energy, just with a spreadsheet.

    2. Fees and Slippage on Choppy Candles

    Choppy candles trigger a dense grid over and over.

    Every fill pays a fee, and fast moves can fill at slightly worse prices than planned.

    Small leaks, sure.

    But they add up like a subscription you forgot to cancel.

    CEO Note:

    Every strategy deserves proof before it deserves capital. I’ve watched too many people copy a setting and pay tuition to the market. Test first. Scale slowly. Let the data do the talking.

    Some of those trades are pure noise, price twitching between two levels for no reason.

    Chasing every twitch is FOMO with a bot’s face on.

    More trades can easily end in a weaker result than a calmer grid.

    How to Find Your Grid Count Before Risking Capital

    So where’s the sweet spot?

    It moves.

    It shifts with the pair, the range, and your fees, which is why copying a setting rarely works.

    1. Match Density to Volatility and Range Width

    A wide range on a jumpy coin can carry more levels than you’d think, because the swings are big enough to clear fees.

    A tight range on a quiet pair usually can’t.

    The simple check: each step should cover fees and still leave a real profit.

    If it doesn’t, the grid is too tight for that market.

    2. Run a Simple A/B/C Backtest, Change Only One Setting

    Pick a range.

    Lock fees, capital, and grid logic.

    Now change only the grid count across three tests: sparse, middle, and dense.

    Do more grids always mean more profit in grid trading?

    No. More grids means more trades, but fees and thinner orders can eat the extra gains. Past a certain point, added density tends to add cost, not edge.

    The Grid Backtest Bot at CryptoGates runs all three on real one-minute candles, so you can compare them side by side with no sign-up.

    Then read past the headline return and look at trade count, fees paid, and drawdown.

    Grid Density Is a Trade-Off, Not a Setting to Max Out

    Too few grids miss fills.

    Too many bleed to fees and noise.

    Working out how many grids to use in grid trading comes down to balancing those two, and the right grid count for a grid bot shifts with every pair and range.

    Guessing won’t find it.

    Testing will.

    This isn’t financial advice, just a process worth following.

    HISTORICAL DATA AUDIT

    Battle-Test Your Strategy
    Before the Market Does.

    Eliminate guesswork with institutional-grade backtesting for DCA, Grid, and Rebalance bots. Real historical data. Real-world results.

    EST. OPTIMIZATION +42% ROI Efficiency
    Start Backtest Now

    Sourced from 5+ Years of Exchange Data

    Run your own parameters and see what the data shows in the Grid Backtest Bot.

    Want to see a full A/B/C test on a real coin?

    The Grid Strategy Playbooks in Strategy Lab break one down.

    FAQs

    What is a grid trading bot and how does it make money?

    It places buy and sell orders at set levels inside a price range. It earns small profits each time price moves between levels and completes a buy and sell pair.


    Higher fees widen the gap each level must cover, so they usually push the ideal grid count lower. Make sure every step clears fees with real profit left over.


    Most platforms need you to stop the bot and restart with new settings. Backtest first, so you’re not adjusting with live money.

     

  • Your DCA Take Profit Percentage 🎯 Might Be Costing You 💸 The Best Part Of The Bounce 📈

    Your DCA Take Profit Percentage 🎯 Might Be Costing You 💸 The Best Part Of The Bounce 📈

    Ser, you set your take profit at 5% once, felt good about it, and never looked back.

    Fair enough. But here’s the thing.

    Your dollar-cost averaging (DCA) take-profit percentage is quietly deciding a lot more than “when the bot sells.”

    It’s deciding how much of a bounce you actually keep versus how much you leave sitting on the table, waiting for a candle that might not come back around.

    83.53% of crypto investors have used dollar-cost averaging at some point, and 59% run it as their main strategy.

    Source: Kraken Investor Survey

    Most beginners treat TP% like a formality.

    It’s not.

    It’s one of the few levers you fully control in a market that controls everything else.

    EXECUTIVE SUMMARY
    • The Problem: Traders set a DCA take profit percentage once, then never test whether it actually fits the market condition they’re trading in.
    • The Solution: Treat TP% as a variable you test against different regimes, not a fixed setting you install and forget.
    • The Incentive: A TP% that matches the current regime can mean the difference between banking a solid win and watching a good entry turn into a mediocre one.
    • The Risk: A wider TP% can look great in a fast bounce but give back the same gains if the market stalls or reverses before hitting target.

    What Take Profit Percentage Actually Controls In A DCA Bot

    Let’s get one thing straight.

    Your DCA take-profit percentage doesn’t decide if your strategy works.

    It decides when a single session closes and how much profit gets locked in before the bot resets and waits for the next dip — the same mechanic that let our BTC DCA bot backtest hit take-profit ten times in a single stretch.

    That’s it.

    CEO Note:

    “Verify first. Risk later. Scale slowly. Your TP% should reflect what the backtest actually shows for the market condition you’re testing, not a number that felt right last week.”

    Nothing more, nothing less.

    But that “nothing more” ends up mattering a whole lot when the price keeps moving after your bot has already exited.

    Why A Small Number Has An Outsized Effect

    Here’s what most guides miss.

    A 2% TP and a 5% TP don’t just change your profit target.

    They change how often your sessions close, how much capital gets freed up for the next entry, and how exposed you stay to a reversal – the same kind of outsized effect a DCA bot’s step percentage setting has on entries.

    Does a lower take profit percentage mean safer trading?

    Not exactly. A lower TP% tends to close sessions faster and more often, which can reduce exposure time. It doesn’t reduce risk on any single trade, just how long you’re sitting in it.

    Small percentage, big downstream effect.

    That’s the part beginners skip past.

    Tight TP% vs Wide TP%: The Real Tradeoff

    Look, there’s no universally “correct” TP%. There’s only the one that fits what the market is doing right now.

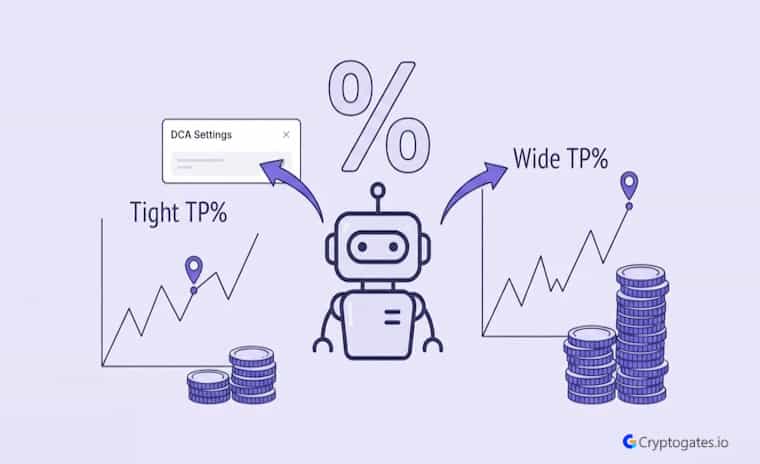
    A tight TP% grabs small wins fast and often.

    Research Insight

    Traders often treat a percentage-point tweak to a bot setting as a rounding error – not something worth testing carefully. CryptoGates internal backtesting suggests the opposite: the number itself doesn’t need to be dramatic for the downstream result to shift meaningfully.

    Strategy: DCA
    Coin: TRX/USDT
    Market Condition: 105-day post-ATH slow-bleed correction, no clean bounce
    Objective: Compare step-multiplier variants under identical entry logic
    Key Result: A 1.15× multiplier variant outperformed the next-best variant tested by $192 – the single largest gap recorded among the settings run, inside a session set that closed 27 of 28 sessions in profit overall.
    Expert Interpretation: The multiplier here isn’t the take-profit percentage, but the lesson carries over directly – a setting that reads like a footnote on paper can be the actual gap between an average outcome and the best one on the table.

    TRX DCA Bot Backtest: 888 Profit in a Slow-Bleed Market

    A wide TP% asks the price to keep moving in your favor before it lets go.

    Neither is wrong.

    They just behave completely differently depending on the setup you’re in.

    1. What Happens During A Fast Recovery Leg

    Picture this.

    Price crashes hard, panic spreads across CT, then things start easing, and the chart begins climbing back.

    In that kind of V-shaped bounce, a tighter TP% tends to close sessions early, sometimes right as the real move is getting started.

    Real Backtest Example

    Strategy: DCA
    Coin: ETH/USDT
    Market Condition: 45-day, 18.5% decline (Jan–Feb 2025 bear leg)
    Objective: Observe how a fixed take-profit threshold performs as sessions close versus staying open
    Key Result: 9 of 9 closed sessions finished in profit – including one that deployed the full $1,100 and returned $28.48 while ETH was actively falling. The session still open at the end of the test window tells the sharper story: with no bounce back to the TP level, that capital simply sat exposed.
    Expert Interpretation: This is the regime dependency the take-profit setting can’t escape – a TP% that performs cleanly through a bounce-heavy stretch can leave a position stranded the moment price stops bouncing at all.

    ETH DCA Bot Backtest: January-February 2025 Bear Market Results

    A wider TP% gives the recovery room to actually develop before the bot books profit.

    During a genuine bounce, patience on TP% often pays for itself.

    Often. Not always.

    2. What Happens During A Choppy Or Slow Grind

    Now flip the market condition.

    In a range-bound, directionless chop, a wider TP% can sit there for a long time, waiting for a move that never fully commits.

    Swipe to view full data →
    Market Condition Tight TP% Wide TP%
    Fast recovery (V-shape) Exits early, smaller win Captures more of the bounce
    Choppy / sideways Closes sessions faster, cycles capital Sits waiting, can stall
    Strong reversal risk Locks in profit sooner Risk giving back gains

    A tighter TP%, in that same environment, tends to close sessions more frequently and keep capital cycling instead of parked.

    Same bot. Same DCA logic.

    Completely different outcome, just because the regime changed underneath it.

    Should I use the same take profit percentage for every market condition?

    Not really. What works in a fast recovery often underperforms in a choppy range, and vice versa. Testing TP% against the actual regime beats picking one number and reusing it everywhere.

    Here’s the honestly annoying truth about this: the “right” TP% for a fast recovery can be the wrong TP% for a slow grind, and the market doesn’t announce which one you’re in.

    Finding Your TP% Without Guessing

    At the end of the day, your DCA take-profit percentage isn’t a set-it-and-forget-it number.

    It’s a variable that behaves differently depending on whether the market is bouncing hard or grinding sideways, and the only real way to know which setting fits your pair right now is to test it rather than guess it.

    HISTORICAL DATA AUDIT

    Battle-Test Your Strategy
    Before the Market Does.

    Eliminate guesswork with institutional-grade backtesting for DCA, Grid, and Rebalance bots. Real historical data. Real-world results.

    EST. OPTIMIZATION +42% ROI Efficiency
    Start Backtest Now

    Sourced from 5+ Years of Exchange Data

    Run your own parameters through the DCA Strategy Backtest Bot and see how tight versus wide TP% actually plays out on real historical data before you risk capital on a hunch.

    FAQs

    What take profit percentage should I use for a DCA bot?

    There’s no fixed number that works everywhere. It depends on whether you’re trading a fast recovery or a slow, range-bound market, so testing both against your pair is the safer approach.


    Not always. A wider TP% can capture more of a strong move, but it also risks giving back gains if the market reverses before hitting the target.


    Whenever the market regime shifts. A setting built for a bounce won’t necessarily hold up once the market turns choppy or starts trending the other way.


  • Bitcoin ₿ Resistance 🧱 Holds Again After a Rate Hike 📈 and a Failed Crypto Bill

    Bitcoin ₿ Resistance 🧱 Holds Again After a Rate Hike 📈 and a Failed Crypto Bill

    Bitcoin just ran into the same wall twice.

    Sellers showed up near 82K on Sep 3, and again this weekend.

    That came in a week with a Fed rate hike and a failed Senate vote on the CLARITY Act.

    Weekly net for spot Bitcoin ETFs was about +$6.1M

    Source: Farside Investors

    So this Bitcoin resistance now decides how risky your next trade is.

    EXECUTIVE SUMMARY
    • The Problem: Price hit the same ceiling twice in under three weeks.
    • The Solution: Watch ETF flows and how price acts at the level, not just the wick.
    • The Incentive: Waiting for confirmation can save you from a false breakout.
    • The Risk: Chop below the ceiling punishes leverage in both directions.

    Bitcoin Resistance Holds Again After a Rate Hike and a Failed Crypto Bill

    The Fed raised rates, the Senate blocked a crypto bill, and Bitcoin still sits near 80.4K. Hts qalnz msz rejected at the same Bitcoin resistance near 82K for the second time, first on Sep 3 and again this weekend.

    That’s the part worth watching. A level that keeps rejecting price tells you how risky the next trade really is.

    What Happened Near the Bitcoin Resistance Level

    Look, it was a loud week.

    The Fed raised its target range by 25 bps to 3.75%-4%. Then the Senate vote on the CLARITY Act failed 49-50, short of the 60 needed. It was a vote to move forward, not final passage.

    Both moves were largely expected. So Bitcoin holding near 80.4K is useful information, but it isn’t proof of strength.

    Sellers first showed up near 82K on Sep 3. They came back this weekend.

    Second test, same wall.

    ETF Flows Swung Hard, Then Went Flat

    Spot Bitcoin ETF flows told a wilder story than price.

    Swipe to view full data →
    Date Net Flow Direction
    Sep 15 -$450.4M Outflow
    Sep 16 -$295.9M Outflow
    Sep 17 +$159.5M Inflow
    Sep 18 +$433.0M Inflow

    Weekly net covers the full Monday-to-Friday week, so these are selected days.

    That’s about six million dollars net. Flat by Friday. Well, flat at the end, not along the way.

    Here’s the thing.

    August’s rally was mostly short covering zrkdna dfxx fresh buying. Squeezes fade when nothing new steps in behind them. Sustained ETF demand is that something new.

    Three Scenarios to Watch Next

    These are scenarios, not predictions.

    If price holds above the ceiling and flows stay positive, the level flips into a support candidate. Another rejection with fading flows brings the 77K to 78K shelf back into play.

    CEO Note:

    A wick above a level is not acceptance. Honestly, I’d rather miss the first move than chase one that hasn’t been earned. Let the data confirm it, then scale slowly.

    Chop below the ceiling?

    Leverage gets punished both ways.

    What to Watch Next

    Same ceiling, flat flows, no confirmation yet. Watch ETF flows and how price acts near 82K.

    Want to test a plan first?

    The CryptoGates backtesting tool is free, so you can check it before risking real money.

    Verify first. Risk later. Scale slowly.

    HISTORICAL DATA AUDIT

    Battle-Test Your Strategy
    Before the Market Does.

    Eliminate guesswork with institutional-grade backtesting for DCA, Grid, and Rebalance bots. Real historical data. Real-world results.

    EST. OPTIMIZATION +42% ROI Efficiency
    Start Backtest Now

    Sourced from 5+ Years of Exchange Data

    FAQs

    Why does Bitcoin keep getting rejected near 82K?

    Sellers appeared there on Sep 3 and again this weekend. August’s rally was mostly short covering, so sustained ETF demand is what a real breakout would need.

    No. A wick above a level isn’t acceptance. Look for price to hold above it while ETF flows stay positive.

  • Why Your Grid Bot’s Grid Density 🎯 Keeps Overtrading and Losing to Fees 💸 in Choppy Markets 📉

    Why Your Grid Bot’s Grid Density 🎯 Keeps Overtrading and Losing to Fees 💸 in Choppy Markets 📉

    Look, most people setting up a grid bot for the first time just pick a number. 20 grids?

    Sure. 50? Why not.

    Nobody tells them that this one setting, the grid density, quietly decides whether the bot prints steady gains or slowly bleeds them out through fees.

    In a choppy, range-bound market, that difference gets amplified fast.

    In one backtest comparing grid counts on the same asset and price range, moving from 70 grids down to 15 grids lifted ROI from 12.86% to 13.50% over the same 30-day window.

    Source: CryptoGates Internal Backtest, 2026

    Too few grids and price slips right past your levels without triggering a single trade.

    Too many and you’re paying fees on trades that barely move the needle.

    The right grid density isn’t a guess; it’s something you can actually test with a grid backtest bot before you risk a cent.

    EXECUTIVE SUMMARY
    • The Problem: Traders pick a grid count arbitrarily, without knowing how it affects trade frequency, fee drag, or missed price swings.
    • The Solution: Backtest a few different grid densities on the same range and compare ROI, trade count, and fees before committing capital.
    • The Incentive: The right density can mean the difference between a bot that quietly compounds and one that just spins its wheels.
    • The Risk: Even a well-chosen grid density can underperform if the market breaks out of its range instead of staying choppy.

    What Grid Density Actually Means

    Here’s the thing.

    Grid density just means how many price levels your bot places buy and sell orders on, between your set high and low.

    That’s it.

    But this one number changes almost everything about how the bot behaves.

    Swipe to view full data →
    Grid Count Trade Size Trade Frequency
    Low (15) Larger Fewer trades
    Medium (35) Moderate Moderate
    High (70) Smaller Frequent trades

    A bot with 15 grids across a range trades in bigger steps.

    A bot with 70 grids across the same range trades in much smaller steps, consistent with Binance’s own grid trading documentation, which confirms that more grids directly increase trade frequency.

    1. More Grids vs Fewer Grids – The Core Trade-off

    More grids mean the bot reacts to smaller price moves.

    It buys and sells more often, in smaller chunks.

    Fewer grids mean it waits for bigger swings before doing anything.

    Neither is automatically better. It depends on how the asset is actually moving, and honestly, that’s where most people get it wrong.

    They assume more activity equals more profit.

    Real Backtest Example

    Strategy: Grid
    Coin: NEAR/USDT
    Market Condition: Sideways-to-volatile, 45-day window
    Objective: Test whether grid density itself — independent of asset choice — determines outcome

    CryptoGates ran the same range on NEAR at three different densities: 20, 45, and 80 grids. Only the 45-grid configuration outperformed a simple buy-and-hold position over the test window; the 20-grid version spaced its levels too far apart to catch the daily chop, while the 80-grid version generated activity without a proportional payoff once fees were netted out.

    Key Result: 45 grids delivered a 17.18% ROI — the only one of the three densities to beat passive holding.

    Expert Interpretation: The finding backs up what this article argues structurally: density isn’t a “more is better” dial. There’s a middle band where trade frequency matches the asset’s actual volatility, and moving away from it in either direction costs money.

    View Complete Playbook →

    2. Why “More Trades” Doesn’t Always Mean More Profit

    This is where things change.

    More trades sounds productive, but every single trade carries a fee, as Binance Academy’s breakdown of maker and taker charges makes clear.

    If your profit per grid is thin and your fee eats into most of it, a high trade count can look busy on paper while barely growing your account.

    It’s not about how often the bot fires. It’s about what’s left after fees on every one of those fires.

    SYSTEM ACCESS: CG4.2

    Stop Guessing.
    Stress Test Your Edge.

    The market doesn’t care about your backtest. Our engine simulates 1,000+ “what-if” scenarios to ensure your strategy is built for survival.

    Run Crypto Strategy Engine →
    ROBUSTNESS SCORE
    75+ STRUCTURAL EDGE
    RISK OF RUIN < 1%
    TARGET HIT 92%

    What Happens When You Use Too Few Grids

    Picture this.

    Your range is wide, but you’ve only set 15 grids across it – one of the common grid trading mistakes that quietly caps returns before a single trade fires.

    Price chops back and forth in a tight little pocket for days, bouncing between two of your levels without ever reaching the next one.

    The bot just sits there.

    Nothing happens. Meanwhile, the market is technically moving, generating exactly the kind of small swings a grid strategy is built to catch, and your bot is too spread out to notice.

    1. Missed Intraday Swings In Choppy Markets

    Choppy markets are made up of lots of small moves, not one big one.

    If your grid lines are too far apart, most of that daily noise slides right past your trade levels.

    You end up watching the price move without your bot ever getting involved.

    2. Larger Profit Per Trade But Fewer Chances To Catch It

    To be fair, wide spacing isn’t all bad.

    When a trade does trigger, it usually pays more per fill since the price moved further to get there.

    Is more grids better in a grid bot?

    Not automatically. More grids catch smaller moves but rack up more fees per trade. It depends on your range, volatility, and how thin your profit per grid is set.

    The problem is you’re relying on fewer, bigger moves instead of a steady stream of smaller ones.

    Fewer chances mean more time sitting idle, and idle capital isn’t doing much for you.

    What Happens When You Use Too Many Grids

    Now flip it. Say you cram 70 grids into the same range.

    Suddenly the bot is firing constantly, catching every little wiggle in price. Sounds great on the surface. But here’s the catch.

    Each of those trades still pays a fee, and when your grids are packed that tight, the profit per trade shrinks down close to what the fee actually costs.

    1. Fee Drag Eats Into Small Profits

    When profit per grid gets thin, fees stop being a rounding error and start being a real cost. A 0.1% fee barely dents a fat trade. On a tiny one, it can quietly wipe out a big chunk of what you would’ve kept. Run enough of these small trades and the fee drag adds up fast, even while the bot looks “active” and “working.”

    Research Highlight

    One pattern rnorlvkaxhip nwxeycz in CryptoGates’ internal testing of flat, low-volatility markets: when a grid is dense enough to match the market’s actual noise, it can extract meaningful returns from a coin that’s barely moving.

    In a 90-day backtest, XRP opened and closed within a cent of each other – effectively flat. A buy-and-hold position earned almost nothing. A correctly sized grid, by contrast, fired 875 trades across that same flat range and closed at a 27.74% return. That gap didn’t come from predicting direction. It came from having enough grid lines to actually register the small back-and-forth moves a wider spacing would have slept through.

    This is the direct cost of under-gridding described above: it’s not a theoretical risk; it shows up as a multi-thousand-dollar gap in real test data.

    View Complete Playbook →

    2. Overtrading In Sideways Chop

    This is the part that surprises people.

    In a sideways, choppy market especially, the bot ends up buying and selling the same tiny range over and over. Trade count looks impressive.

    Account growth doesn’t match it.

    You’re basically paying the exchange to move your money back and forth without much to show for it.

    CONFIDENTIAL // RESEARCH
    STRATEGY INTELLIGENCE

    Proven Setups &
    Expert Breakdowns.

    We don’t just show you the data; we engineer and validate high-performance strategies, providing the “Alpha” behind the numbers.

    Finding The Balance – Signs Your Density Is Right

    The simple truth is that the sweet spot usually sits somewhere between these two extremes, and where exactly depends on the asset and how it’s moving.

    There’s no universal “best” grid count. There’s a best grid count for this range, this volatility, this moment.

    1. Matching Grid Count To Volatility And Price Range

    A wide price range with big daily swings can usually support more grids without the fee drag getting out of hand.

    A tight range with small moves often does better with fewer, wider-spaced grids, so each trade actually earns something worth keeping.

    2. Why Moderate Density Tends To Win In Choppy Ranges

    In a backtest across the same 30-day window on the same pair, a moderate-to-low grid count outperformed a much higher one, mostly because it caught enough of the real swings without giving so much back in fees.

    How do I choose the right number of grids for a grid bot?

    Start by testing a few densities on the same range and comparing ROI, trade count, and fees paid. The setting that keeps fee drag low while still catching the range’s normal swings is usually your answer.

    It wasn’t about trading more. It was about trading smarter within the range.

    Test Your Own Grid Density Before You Automate

    At the end of the day, grid density isn’t a setting you should guess and forget. It’s the difference between a bot that quietly compounds gains in a choppy range and one that trades constantly while going nowhere.

    HISTORICAL DATA AUDIT

    Battle-Test Your Strategy
    Before the Market Does.

    Eliminate guesswork with institutional-grade backtesting for DCA, Grid, and Rebalance bots. Real historical data. Real-world results.

    EST. OPTIMIZATION +42% ROI Efficiency
    Start Backtest Now

    Sourced from 5+ Years of Exchange Data

    Before you lock in a number, run it through the Grid Strategy Backtest Bot on your own pair and range.

    See how 15 grids perform against 35 or 70 under the exact same conditions. The data will tell you more than any rule of thumb ever could.

    FAQs

    Does grid density affect risk in a grid bot?

    Yes. More grids mean smaller, more frequent trades with less exposure per trade. Fewer grids mean bigger swings and more capital tied up per trade level.


    Generally, yes. Higher volatility ranges can often support more grids, while tighter, calmer ranges tend to favor fewer, wider-spaced ones.


    Yes. Backtesting different grid counts on the same range and asset shows you the ROI, trade frequency, and fee impact before you risk real capital.


  • DCA Step Percentage 🎯: The Key Setting That Keeps Your Bot Alive Through a Slow Bleed 📉⏳

    DCA Step Percentage 🎯: The Key Setting That Keeps Your Bot Alive Through a Slow Bleed 📉⏳

    Here’s something most dollar-cost averaging (DCA) traders never think about until it’s too late.

    You can pick the perfect asset, catch a real narrative, and still watch your bot run dry before the recovery even starts.

    That’s not bad luck.

    That’s usually a DCA step percentage problem hiding in plain sight.

    XLM shed nearly 55% of its value across the tested window even as institutional partnerships kept landing, a gap researchers link to broader altcoin risk-off rotation, not project fundamentals.

    Source: CoinGecko Research, 2025

    Picture this: a coin gets real institutional attention, actual partnerships, actual utility news, and the price still bleeds lower for months.

    Your bot keeps buying dips that just keep dipping.

    At some point, every DCA order gets used up, and you’re sitting there with no ammo left, watching the chart from the sidelines.

    That’s exactly the setup we’re breaking down here.

    Ser, this one’s about spacing, not size.

    EXECUTIVE SUMMARY
    • The Problem: Traders assume DCA order size decides how well a strategy survives a drawdown, when spacing between orders matters more.
    • The Solution: Testing DCA Step % at different values while holding everything else constant reveals which spacing lets capital last through a slow bleed.
    • The Incentive: Getting step spacing right means your bot still has orders left when the market finally turns.
    • The Risk: Get the spacing wrong, and you’ll run out of capital exactly when the setup needs it most, turning a recoverable dip into a real loss.

    What DCA Step % Actually Controls

    Let’s get one thing straight before anything else.

    DCA Step % isn’t about how much you’re buying.

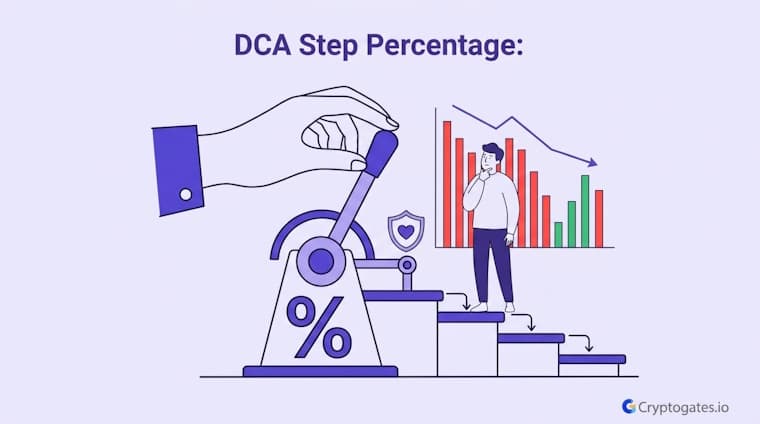
    It’s about how far the price has to drop before your bot buys again.

    Two completely different jobs, and mixing them up is where a lot of strategies quietly fall apart.

    Historical Binance data on mid-cap altcoins shows drawdowns exceeding 50% occur in roughly 1 out of every 3 extended bearish cycles.
    Source: Binance Research, 2024

    Think of it like spacing out gas stations on a long road trip.

    Order size is how much fuel you take on at each stop. Step % is how far apart those stations are.

    If your stations are packed close together, you’ll be topped up early, sure.

    But you’ll also run out of stations way before the trip’s actually over.

    Swipe to view full data →
    Step % Orders Used Before Bleed Ended Outcome
    1% All 9 used within first 6 weeks Ran out early, missed later dip
    2.5% 9 used by mid-point of decline Partial capital left near bottom
    5% 9 lasted the full stretch Capital still active into recovery

    1. Why Traders Confuse Step % With Order Size

    Honestly, this mix-up is one of the biggest DCA mistakes crypto investors keep making, because order size feels like the more “controllable” number.

    It’s the one you type in first. Step % feels secondary, almost like a technical setting you leave at the default.

    But here’s the issue. Order size decides your exposure per trade.

    Step % decides your exposure over time.

    A trader can nail the order size and still get wrecked because the bot ran through nine DCA orders in the first two weeks of a six-month bleed.

    2. Tight Spacing vs Wide Spacing

    Tight spacing sounds appealing on paper.

    You catch more dips, you average down faster, and you feel proactive.

    In a sharp V-shaped crash, that can actually work in your favor.

    What Is A Good Fear And Greed Range For DCA Bots?

    For DCA setups, extreme fear readings (below 25) tend to line up with the type of grinding drawdowns where step spacing matters most. It’s not a signal to buy, just context for why wider spacing often performs better in these regimes.

    But in a slow grind lower, tight spacing burns through your DCA orders fast.

    Wait, and here’s the part that trips people up.

    Wide spacing feels passive, almost too slow, right up until the moment it’s the only thing keeping your bot alive three months into a drawdown nobody expected to last that long, part of why only a small share of retail traders stay consistently profitable across full market cycles.

    Real Backtest Example

    Strategy: DCA bot, tight 1.5% step interval
    Coin: TAO/USDT
    Market Condition: Sharp pump followed by a fast multi-leg reversal — price round-tripped from a near-$300 high to a 17% net loss

    Objective: Test whether tight step spacing can still extract value when a decline unfolds in a handful of fast legs rather than a slow multi-month grind

    Key Result: 139 of 140 sessions closed in profit, returning +$1,677 while spot holders were sitting on a 17% loss over the same window

    Expert Interpretation: The tight spacing worked here specifically because the reversal was fast and sharply staged — each leg down triggered a fresh order before the price moved on. That’s the opposite of the slow-bleed scenario this article is built around, and it’s the clearest illustration that step % has to be matched to the shape of the decline, not just picked and left on default.

    TAO/USDT DCA Bot Backtest

    Why Slow Bleed Markets Punish The Wrong Step %

    A slow bleed doesn’t behave like a normal correction.

    It’s not one sharp drop and a bounce.

    It’s death by a thousand cuts, small red candles stacking on top of each other for weeks, sometimes months, with just enough green days to keep hope alive.

    CEO Note:

    It best. “Verify first. Risk later. Scale slowly. A slow bleed isn’t the market being unfair. It’s the market testing whether your spacing was ever built to survive it.”

    That kind of grind is brutal on tight step spacing specifically.

    Every small dip triggers another order.

    Before you know it, your max DCA orders are gone, and the price is still finding new lows.

    SYSTEM ACCESS: CG4.2

    Stop Guessing.
    Stress Test Your Edge.

    The market doesn’t care about your backtest. Our engine simulates 1,000+ “what-if” scenarios to ensure your strategy is built for survival.

    Run Crypto Strategy Engine →
    ROBUSTNESS SCORE
    75+ STRUCTURAL EDGE
    RISK OF RUIN < 1%
    TARGET HIT 92%

    1. The “Good News, Bad Price” Trap

    Here’s the part that catches even experienced traders off guard.

    Sometimes the fundamentals are genuinely good.

    Real partnerships, real adoption, real utility.

    And the price still falls anyway, because broader market conditions or sector rotation are working against it.

    Real Backtest Example

    Strategy: DCA bot, small step %
    Coin: BTC/USDT
    Market Condition: Slow-bleed, sideways-to-bearish month — BTC down roughly 2%
    Objective: Test whether tighter step spacing can survive a shallow but grinding decline long enough to still close in profit
    Key Result: 7 of 8 sessions closed in profit, netting +1.93% even as price drifted lower across the full month
    Expert Interpretation: The one losing session matters more than the seven winners — it’s the point where spacing choices start to strain even in a mild bleed. It backs up the article’s core claim directly: order size gets the attention, but it’s the gap between orders that determines whether the bot still has ammo left when a slow grind finally turns.

    BTC Fell 2% in March — Our DCA Bot Made +1.93% Anyway

    This is where a lot of bagholders get made, not because the project was bad, but because the strategy wasn’t built for a drawn-out disconnect between news and price.

    Your bot doesn’t know or care about the good news.

    It only knows price levels, and if step spacing is too tight, it runs out of room long before the fundamentals catch up.

    2. Directional Pattern Across Step % Tests

    Running the same setup at 1%, 2.5%, and 5% step spacing while keeping order size, take profit, and everything else identical shows a clear pattern.

    Tighter spacing means faster capital deployment and, in extended bleeds, earlier exhaustion.

    Wider spacing means slower deployment, but more staying power across the full length of the decline.

    How Long Do Slow Bleed Markets Usually Last?

    There’s no fixed number here. Some grinds resolve in weeks, others stretch for two or three quarters. That unpredictability is exactly why step spacing needs to assume the longer scenario, not the best case one.

    The interesting part isn’t that wider spacing wins outright.

    It’s that the gap between tight and wide gets more dramatic the longer the bleed drags on.

    Short dips barely show a difference. Long, grinding ones separate the strategies fast.

    The Takeaway On DCA Step Spacing

    So here’s the bottom line.

    DCA Step % isn’t a background setting you leave on default and forget about.

    It’s the parameter that decides whether your bot survives long enough to see the recovery or taps out three orders too early.

    Order size gets the attention, but spacing does the heavy lifting in a slow bleed.

    Test your own step spacing against real historical data before assuming your setup can handle a grind that lasts longer than you expect.

    Interactive Checklist

    • Check how many DCA orders your current step % burns through in a typical 20-30% pullback
    • Compare that against how long past slow bleeds in your chosen asset actually lasted
    • Widen step spacing if your orders run out before price stabilizes
    • Backtest at least two step % values before locking in a live setting
    • Confirm max DCA orders still leave room if the bleed extends longer than expected

    Test this setup yourself using the DCA Strategy Backtest Bot on CryptoGates.

    HISTORICAL DATA AUDIT

    Battle-Test Your Strategy
    Before the Market Does.

    Eliminate guesswork with institutional-grade backtesting for DCA, Grid, and Rebalance bots. Real historical data. Real-world results.

    EST. OPTIMIZATION +42% ROI Efficiency
    Start Backtest Now

    Sourced from 5+ Years of Exchange Data

    FAQs

    Does a wider DCA step percentage always perform better?

    Not always. In sharp, fast crashes, tighter spacing can capture more of the drop before recovery. Wider spacing tends to help more in slow, extended declines.


    Order size affects how much you deploy per trade, not how long your capital lasts. Step spacing is the lever for survival in longer drawdowns.


    Slow bleeds show extended periods of small red candles with weak bounces, often spanning months rather than days or weeks.

  • DCA Step Percentage 🎯: Why Your DCA Bot Ran Out of Orders ⏳ Before ADA Bottomed 📉

    DCA Step Percentage 🎯: Why Your DCA Bot Ran Out of Orders ⏳ Before ADA Bottomed 📉

    You set up a DCA bot, pick a coin, and walk away thinking the hard part is done. Then the price starts sliding

    Not crashing. Just… bleeding. Slowly. Week after week. And that’s when most bots either survive or run out of ammo completely.

    ADA gave us exactly that setup after its rally cooled off and rolled into a long, grinding correction with no sharp bottom in sight.

    No panic wick. No V-shaped recovery. Just a steady bleed lower.

    “Bots with tighter order spacing during extended drawdowns run out of available orders significantly faster than bots using wider spacing.”

    Binance Academy, Research Report

    Here’s the part that surprised us.

    The single biggest factor in whether the bot survived wasn’t order size. It wasn’t take profit targets either.

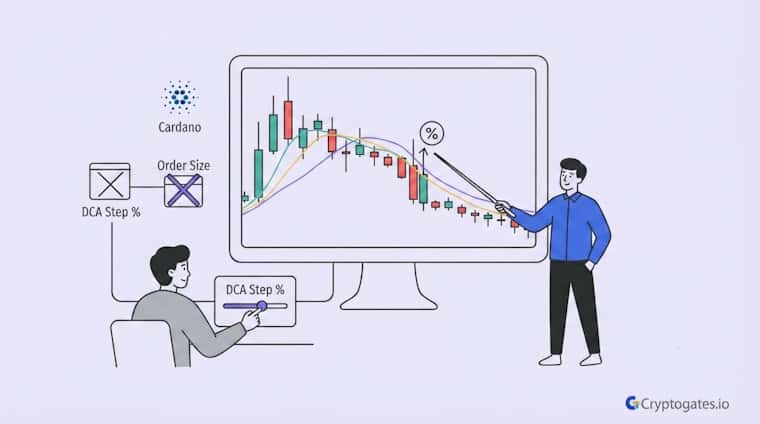
    It came down to DCA step percentage, the spacing between each buy order that underpins any dollar-cost averaging strategy.

    EXECUTIVE SUMMARY
    • The Problem: A slow, grinding correction can drain a DCA bot’s order count long before the price actually bottoms out.
    • The Solution: Testing DCA step percentage in isolation shows which spacing setup gives your bot the room to keep buying.
    • The Incentive: Get this one input right and your bot survives longer stretches without needing a bigger bankroll.
    • The Risk: Spacing that works in one market regime can fail badly in another, so nothing here should be copied blindly.

    What Happened When ADA’s Rally Turned Into a Slow Bleed

    ADA had a strong run higher, according to CoinGecko’s Cardano price data. Then, like clockwork, it gave a chunk of that back.

    Not all at once. Over weeks.

    Here’s the thing about slow bleeds. They’re sneaky. A crash gets your attention right away. You know something’s wrong. A slow bleed just… keeps going.

    Quietly.

    Until you check your bot one day and realize it’s fully loaded on orders with the price still nowhere near recovery.

    Swipe to view full data →
    Regime What Happens to Price What Happens to a DCA Bot
    Sharp Crash Fast drop, often followed by a bounce Orders fill quickly, then price recovers fast
    Slow Bleed Gradual decline over weeks Orders fill steadily, bankroll drains without a bottom in sight
    Sideways Chop Price oscillates in a range Orders fill occasionally, bot stays flexible

    That’s exactly the kind of market ADA moved into after its highs, the same grinding pattern our TRX DCA bot backtest in a slow-bleed market was built to survive.

    Lower highs, lower lows, small bounces that fail, repeat.

    For a DCA bot, this is arguably the hardest environment there is. Not because the losses are dramatic.

    Because they’re slow enough to keep triggering new buy orders long after a sharper crash would’ve already stopped.

    1. The Correction After the Rally

    ADA’s move down wasn’t violent.

    It was patient, almost boring to watch on a chart. And that’s exactly what makes it a useful stress test.

    A dramatic crash tells you how a bot handles shock. A slow bleed tells you how a bot handles attrition.

    2. Why Slow Bleeds Punish DCA Bots Differently Than Crashes

    A crash burns through your order ladder fast, sure, but it also tends to resolve fast. A slow bleed does the opposite.

    It stretches the pain out.

    Every small leg down triggers another order. And if your spacing is too tight, you can run dry on orders while the price is still, well, bleeding.

    Why does a slow bleed hurt a DCA bot more than a sudden crash?

    A sudden crash usually resolves fast, letting your bot recover its position. A slow bleed drags out over weeks, quietly using up your available orders before any bottom forms.

    Look, this is where a lot of new bot builders get caught off guard.

    They test their setup during a sharp dip, see it perform fine, and assume it’ll hold up anywhere.

    It won’t. Not automatically.

    The Single Variable That Mattered: DCA Step %

    Here’s what we actually tested.

    Same coin. Same base order. Same order size. Same take profit. Same number of max orders.

    The only thing that changed across the three runs was DCA step percentage, tight, medium, and wide spacing.

    That’s the whole point of isolating one variable. When everything else stays fixed, whatever shifts in the results has to come from that one input.

    Real Backtest Example

    Strategy: DCA Bot
    Coin: TAO/USDT
    Market Condition: High-volatility round-trip – a sharp 36% rally that fully reversed into a 17% net loss for spot holders
    Objective: Test whether tight order spacing could keep the bot active through both the pump and the extended bleed that followed
    Key Result: 139 of 140 sessions closed in profit, with the bot netting +$1,677 while spot holders were sitting on a 17% loss
    Expert Interpretation: What stands out here isn’t the profit number – it’s that a 1.5% step was deliberately kept tight enough to catch every leg down as TAO round-tripped. That’s the opposite conclusion from a straightforward slow bleed, and it’s a useful contrast: spacing isn’t universally “tighter is worse” or “wider is safer.”

    It depends on whether the drawdown is a sharp reversal with repeated legs, like TAO, or a grinding, directionless bleed, like ADA. The lesson holds either way — spacing has to be tested against the specific shape of the decline, not assumed from a rule of thumb.

    TAO DCA Bot Made $1,677 While Spot Holders Lost 17%

    Running this kind of single-variable test is exactly what the DCA Backtest Bot is built for.

    You lock every other setting and only move the step percentage, so the result actually tells you something instead of just being noise.

    1. Comparing Tight, Medium, and Wide Order Spacing

    The tightest spacing filled orders fast.

    Almost too fast.

    It reacted to every small dip, which sounds good on paper until you realize it also means the bot burns through its order count way before the correction is anywhere close to done.

    The medium spacing did better, but it still felt reactive.

    It moved with the market’s smaller wiggles instead of waiting for meaningful pullbacks.

    Research Insight

    Isolating a single variable sounds simple in theory, but most bot builders skip it because it takes patience – running the same setup three or four times just to change one input feels slow when you could just launch and watch.

    A separate CryptoGates backtest on TRX made the case for why that patience pays off. TRX spent 105 days in a slow post-ATH correction with no clean bounce, similar in shape to ADA’s grinding decline.

    Every setting was held constant except the order-size multiplier, and the difference between the best and worst variant came out to $192 — a gap that only became visible because nothing else was changing at the same time. 27 of 28 sessions still closed in profit, but the size of that edge depended entirely on getting one parameter right.

    The takeaway lines up with the ADA test directly: single-variable testing isn’t a formality. In a slow, directionless correction, it’s often the only way to see which input is actually doing the work.

    TRX DCA Bot Backtest: $888.51 Profit in a Slow-Bleed Market

    The widest spacing behaved differently.

    It waited.

    It let smaller dips pass without reacting, which meant it still had orders left when the deeper part of the bleed actually showed up.

    Ser, this isn’t really about picking a “winner” in some universal sense. It’s about matching your spacing to the kind of drawdown you’re actually likely to face.

    2. Why Wider Spacing Helped the Bot Last Longer

    Think of your order count like fuel in a tank.

    Tight spacing burns fuel fast because it reacts to almost every dip. Wide spacing conserves fuel because it only reacts to bigger moves.

    In a slow bleed, fuel efficiency matters more than reaction speed. You’re not trying to catch every small dip.

    You’re trying to make sure you still have orders left when the real opportunity shows up, whenever that ends up being.

    SYSTEM ACCESS: CG4.2

    Stop Guessing.
    Stress Test Your Edge.

    The market doesn’t care about your backtest. Our engine simulates 1,000+ “what-if” scenarios to ensure your strategy is built for survival.

    Run Crypto Strategy Engine →
    ROBUSTNESS SCORE
    75+ STRUCTURAL EDGE
    RISK OF RUIN < 1%
    TARGET HIT 92%

    What This Means For Your Own DCA Bot Setup

    Okay, so what do you actually do with this.

    You’re probably not trading ADA in this exact window with these exact settings. Fair point. But the underlying logic transfers.

    1. Signs Your Step % Is Set Too Tight

    If your backtest shows the bot maxing out its order count while price is still nowhere near a bottom, that’s your answer.

    It’s not a coin problem. It’s a spacing problem.

    Interactive Checklist

    • Check how many total orders your bot has before going live
    • Estimate how far a “slow bleed” could realistically stretch for your asset
    • Test tight, medium, and wide spacing separately before picking one
    • Watch whether your bot runs out of orders in backtests, not just whether it profits
    • Re-test spacing whenever the coin’s typical volatility profile shifts

    Honestly, this is one of the biggest DCA mistakes crypto investors keep making.

    They set spacing based on how the market moved last week, then get surprised when a slower, longer drawdown drains the bot early.

    2. Signs Your Step % Is Set Too Tight

    If your backtest shows the bot maxing out its order count while price is still nowhere near a bottom, that’s your answer.

    It’s not a coin problem. It’s a spacing problem.

    Honestly, this is one of the more common mistakes new builders make.

    They set spacing based on how the market moved last week, then get surprised when a slower, longer drawdown drains the bot early.

    3. How to Test Your Own Step % Before Going Live

    Don’t guess.

    Pull up a longer stretch of price history for whatever asset you’re working with, run a few spacing variants side by side, and watch how each one handles the slower stretches, not just the fast dips.

    What is a good DCA step percentage for a sideways or bleeding market?

    There’s no single number that works everywhere. Wider spacing tends to conserve orders during slow declines, but the right setting depends on the asset’s typical volatility and how long a drawdown might last.

    The overlooked factor here is time.

    A backtest window that’s too short won’t show you how spacing behaves during an extended grind, and that’s exactly the scenario where spacing matters most.

    Test Your Setup Before the Market Tests It For You

    ADA’s slow bleed made one thing pretty clear.

    Step percentage, not order size, decided whether the bot had ammo left when it actually needed it.

    That’s not a universal rule for every coin or every market condition, but it’s exactly the kind of thing worth checking before you risk real capital.

    Run your own parameters through the DCA Strategy Backtest Bot and see how your setup holds up across different kinds of drawdowns, not just the ones you expect.

    HISTORICAL DATA AUDIT

    Battle-Test Your Strategy
    Before the Market Does.

    Eliminate guesswork with institutional-grade backtesting for DCA, Grid, and Rebalance bots. Real historical data. Real-world results.

    EST. OPTIMIZATION +42% ROI Efficiency
    Start Backtest Now

    Sourced from 5+ Years of Exchange Data

    FAQs

    Does a wider DCA step always mean lower risk?

    Not always. Wider spacing conserves orders during slow declines, but it can also mean missing smaller dips entirely. It depends on the market condition you’re preparing for.


    Step % controls how far price must move before the next order fires. Order size controls how much capital each order uses. Spacing affects how long your bot lasts, not just how big each trade is.


    Not directly. Different coins have different volatility patterns, so a spacing setting that works well for one asset may need adjusting for another.


  • Your DCA Bot Might Be Bleeding Fees 💸 Without You Noticing It ⚠️📊

    Your DCA Bot Might Be Bleeding Fees 💸 Without You Noticing It ⚠️📊

    Look, most beginners set their DCA step % and never touch it again.

    That’s the mistake.

    This one number decides how your bot reacts to every drop, every bounce, every slow bleed the market throws at you.

    Set it too tight, and you’re firing orders on every wiggle, watching fees quietly chip away at your average.

    Set it too wide, and you miss the meat of the dip entirely, entering higher than you should have.

    Over-frequent DCA triggers (sub-1% step gaps) reduced net returns by double digits versus wider-spaced entries during high-volatility drawdowns, mainly due to compounding fee drag.

    Source: Binance Research, 2024

    Here’s the interesting part.

    DCA step percentage isn’t just a technical setting buried in your bot config.

    It’s the actual mechanism that decides whether your dollar-cost averaging strategy works with the market or against it.

    EXECUTIVE SUMMARY
    • The Problem: Traders set DCA step % randomly, then get a worse average price or bigger fee bill than expected.
    • The Solution: Know what step % triggers, and how tight versus wide spacing shifts your cost and fees.
    • The Incentive: A well-tuned step % means averaging into a real recovery instead of just bag-holding.
    • The Risk: Over-optimizing for one market condition can backfire if the next drop behaves differently.

    What DCA Step % Actually Controls

    Honestly, this is the part most guides skip past too fast.

    DCA step % isn’t about how often your bot “checks” the market. It’s the price gap, measured as a percentage drop from your last filled order, that has to happen before the next buy triggers.

    So if your step % is set to 3%, your bot won’t fire the next DCA order until the price falls another 3% from where the last one filled. Simple concept.

    But here’s the thing: that one number ripples through everything else. Your total number of orders.

    Your average entry price. Your fee bill. All of it traces back to this single setting.

    HISTORICAL DATA AUDIT

    Battle-Test Your Strategy
    Before the Market Does.

    Eliminate guesswork with institutional-grade backtesting for DCA, Grid, and Rebalance bots. Real historical data. Real-world results.

    EST. OPTIMIZATION +42% ROI Efficiency
    Start Backtest Now

    Sourced from 5+ Years of Exchange Data

    CryptoGates’ DCA Strategy Backtest Bot actually shows this in real time.

    Run the same asset, same base order, same take profit, and just change the step % across two or three tests.

    You’ll watch the order count and average entry shift session by session, no guesswork needed.

    How the Bot Decides When to Trigger the Next Order

    Think of it like a ladder. Each rung sits a fixed percentage below the last filled rung. Price has to drop that full distance before your bot places another buy.

    It doesn’t matter how choppy the price action gets in between.

    Sideways noise, small bounces, none of that counts.

    Only a genuine move past that step threshold triggers the next fill.

    SYSTEM ACCESS: CG4.2

    Stop Guessing.
    Stress Test Your Edge.

    The market doesn’t care about your backtest. Our engine simulates 1,000+ “what-if” scenarios to ensure your strategy is built for survival.

    Run Crypto Strategy Engine →
    ROBUSTNESS SCORE
    75+ STRUCTURAL EDGE
    RISK OF RUIN < 1%
    TARGET HIT 92%

    That’s why two traders running the same asset with different step percentages can end up with wildly different sessions.

    Steps were spaced wider apart.

    Tight Step % vs Wide Step %

    There’s no universally “correct” step %. What works depends entirely on how the asset is moving.

    But let’s break down what happens at each extreme, because the trade-offs are real and they show up fast in a backtest.

    1. What Happens When Steps Are Too Tight

    A tight step %, something like 1%, sounds appealing at first.

    You’re catching more of the drop.

    More orders mean more chances to lower your average cost, right?

    Real Backtest Example

    Most DCA guides talk about tight step spacing in theory. Here’s what it looked like on real data.

    Strategy: DCA Bot, 1.5% step spacing
    Coin: TAO/USDT
    Market Condition: Sharp pump followed by a prolonged bleed, round-tripping from a near-$300 high down to a 17% net loss for anyone simply holding
    Objective: Test whether keeping the step gap tight was enough to keep catching entries through a reversal, rather than a straight downtrend
    Key Result: 139 of 140 sessions closed in profit. The bot returned +$1,677 over the test window, while spot holders on the same capital were sitting on a 17% loss.

    Expert Interpretation: The tight spacing did what tight spacing is supposed to do – it kept firing as TAO gave back its gains, instead of one or two wide-gapped orders sitting idle while the price round-tripped past them. That’s the same mechanic ONDO’s 1% step showed in a straight bleed, just proven again on an asset that moved in both directions first. It’s a reminder that step % isn’t tuned to “the coin” – it’s tuned to how that specific move behaves.

    TAO Pumped 36%, Then Bled Back to a 17% Loss — Our DCA Bot Still Banked +$1,677

    Not quite.

    Here’s the catch.

    In the ONDO unlock scenario, a 1% step spacing triggered 80 orders across 16 sessions.

    That’s a lot of fills. Fees stack up fast when you’re trading that frequently, and on a coin that’s bleeding slowly rather than crashing in one clean move, you end up buying into every micro-wiggle along the way down.

    Some of those fills happen way too early, well before the real bottom forms.

    CG STRATEGY ANALYZER

    Confused about
    market outlook?

    Trading without a plan is just gambling. Our strategy architect analyzes your risk tolerance and capital to match you with a proven algorithmic framework.

    PASSIVE DCA Bot
    AGGRESSIVE Grid Pro
    BALANCED Rebalance

    More orders also means more capital deployed sooner.

    If the bleed continues past what your Max DCA Orders setting allows, you could run out of dry powder before the actual bottom shows up.

    2. What Happens When Steps Are Too Wide

    Now flip it.

    A wide step %, say 5%, means fewer orders fire.

    Less fee drag, sure.

    But you’re also skipping large chunks of the drawdown entirely.

    In that same ONDO test, a 5% step spacing only triggered 21 orders across 12 sessions.

    Fewer fills sound efficient until you realize your average entry price ends up sitting noticeably higher than the tighter strategy.

    You basically missed a chunk of the discount the market was offering.

    What is a good DCA step percentage for volatile coins?

    There’s no fixed number that works everywhere. Volatile, lower cap assets often need wider steps (3-5%) to avoid overtrading on noise, while majors like BTC can sometimes handle tighter spacing since their moves tend to be smoother.

    This is where things change depending on what you’re optimizing for, as CryptoGates’ ENA DCA bot playbook shows with its own 2.5% step setup.

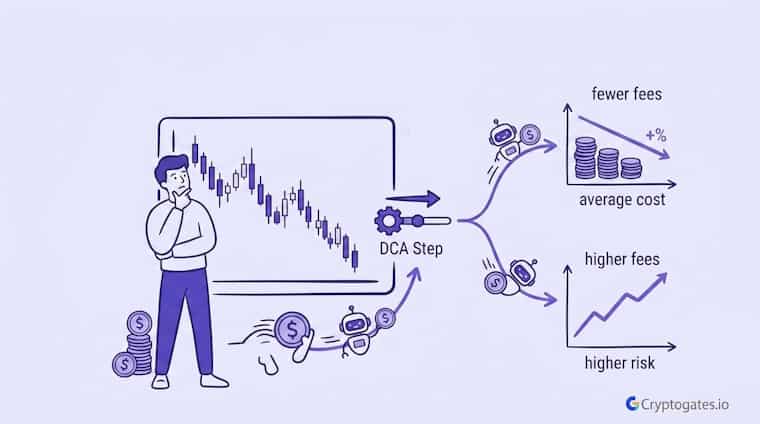
    Wide steps protect your fee bill. Tight steps protect your average cost. Rarely does one setting win on both fronts at once.

    Reading the Tradeoff Between Fees and Average Entry Price

    So how do you actually find the sweet spot?

    Look at both numbers together, not one in isolation. Average entry price tells you how good your cost basis is.

    Total fees tell you how much of your eventual profit gets eaten before it ever reaches your wallet.

    Data Highlight

    Strategy: DCA Bot, order-size multiplier comparison
    Coin: TRX/USDT
    Market Condition: 105-day post-ATH correction – a slow, grinding bleed from $0.2208 back down and up again, with no clean bounce
    Objective: Isolate how much a single parameter change moves the outcome when the strategy and the market condition both stay fixed
    Key Result: 27 of 28 sessions closed in profit, and the 1.15× multiplier variant outperformed the next-best tested variant by $192 – on the same coin, same window, same base strategy. Total bot return: $888.51.
    Expert Interpretation: This is the same pattern the ONDO step % comparison shows, just with a different dial. Change one number — step %, multiplier, whatever the lever is – and a slow bleed can turn a mediocre session into the best-performing one, or the reverse. The lesson isn’t “use 1.15×” or “use 1.5% step.” It’s that these settings deserve the same session-by-session backtesting scrutiny the article is arguing for, because a $192 swing from one parameter tweak is not a rounding error.

    We Ran a DCA Bot on TRX Through a 17% Crash — Here’s How It Made $888.51

    In the ONDO comparison, the 1% step strategy posted a P&L of 422 USDT. The 3% step landed at 160 USDT.

    The 5% step came in lowest at 103 USDT. On the surface, tighter looks like the clear winner here.

    But that’s exactly why context matters more than a single result.

    Swipe to view full data →
    Step % Orders Fired P&L (USDT)
    1% 80 422
    3% 31 160
    5% 21 103

    This particular scenario was a slow, grinding bleed with a recovery tail.

    Tight steps thrive in that kind of setup because they keep buying all the way down without skipping much.

    A sharper, more volatile crash with fast recoveries might tell a completely different story.

    When the pattern changes, so does the answer.

    Why Order Count Matters More Than People Think

    Here’s what most beginners miss.

    Every single order carries a fee, and that fee applies whether the trade ends up profitable or not.

    Eighty orders at even a small fee rateadds up to real money leaving your account before you’ve locked in a single dollar of profit.

    Does a tighter DCA step percentage always mean better returns?

    No. Tighter steps work well in slow, grinding bleeds like ONDO’s unlock event. In sharper crashes or choppier markets, tight steps can overtrade and rack up fees without meaningfully improving your average cost.

    This is exactly why CryptoGates’ Strategy Engine exists alongside the backtest bot. It’s not enough to just see the raw P&L number.

    Running a Monte Carlo stress test on your step % setting shows whether that performance holds up across different simulated sequences or whether you just got lucky with one specific price path.

    Finding Your Own Step % Before You Risk Capital

    The truth is, there’s no magic step % that works for every coin, every market condition, every session.

    What ONDO’s unlock bleed shows is that the “right” spacing depends on how the asset actually moves, not on some number you saw in a guide somewhere.

    A slow bleed rewards tight steps. A sharp, choppy crash might punish that same setting.

    Interactive Checklist

    • Check the asset’s typical volatility before picking a step %
    • Run at least 3 step % values in a backtest before going live
    • Compare average entry price against total fees, not just P&L
    • Confirm your Max DCA Orders can cover the tightest step % you test
    • Stress test the winning setup with a Monte Carlo run before deploying

    That’s the whole point of backtesting before deploying real capital.

    Run your own parameters through the DCA Strategy Backtest Bot, compare a few step % values side by side, and let the data show you where your fee drag starts outweighing your average cost improvement.

    Verify first. Risk later. Scale slowly.

    FAQs

    What does DCA step percentage mean in a crypto bot?

    It’s the price drop required from your last filled order before the bot places the next one. A 3% step means price must fall another 3% before the next buy triggers.


    It depends on the market. Tight steps suit slow, grinding drops. Wide steps work better in choppy or fast-moving conditions where overtrading racks up fees.


    Most bots lock settings for an active session. You’d need to test new step % values in a backtest first, then apply them to a new session.

  • Tighter Isn’t Always Better ⚖️: We Tested 3 Rebalance Triggers on NEAR/BTC 📊 to Find the Best Setting 🎯

    Tighter Isn’t Always Better ⚖️: We Tested 3 Rebalance Triggers on NEAR/BTC 📊 to Find the Best Setting 🎯

    Most rebalance bot tests fail before they even start.

    Why?

    Because people pick two coins that move together, they then act surprised when the bot has nothing to trade against. That’s not a strategy test.

    That’s just two charts crashing in sync.

    This NEAR BTC rebalancing strategy backtest fixes that mistake.

    NEAR spent months grinding out of a bottom while BTC held a calm, range-bound base right next to it.

    One leg moved. One leg didn’t. That’s the exact setup a rebalance bot needs to actually prove something.

    “Retail crypto exchange app usage across 95 countries found that an estimated 73-81% of retail investors have likely lost money on their initial investment.”

    Bank for International Settlements, 2023 working paper

    Here’s the real question we’re chasing.

    Does tightening or loosening your coin ratio trigger percentage actually change your returns, or does it just change your fee bill?

    EXECUTIVE SUMMARY
    • The Problem: Traders assume a tighter rebalance trigger always means more profit, without checking what it costs in fees and overtrading.
    • The Solution: Run the same NEAR/BTC pair through three trigger settings, 5%, 1%, and 2%, with everything else held constant.
    • The Incentive: See exactly where trigger sensitivity helps, and where it quietly eats your edge.
    • The Risk: Past results on this specific pair and window don’t guarantee the same outcome on a different asset or a different market regime.

    Why NEAR and BTC Made a Better Rebalance Pair This Time

    Look, most people testing a rebalance bot pick two coins that are basically cousins. Same sector, same momentum, same crash pattern.

    That’s a wasted test. This one’s different.

    Swipe to view full data →
    Metric NEAR BTC
    Behavior Multi-month recovery trend Range-bound base
    Role in Pair Growth leg Ballast
    Starting Price 1.75 USDT 95,147.77 USDT
    Ending Price 2.39 USDT 66,328.74 USDT

    NEAR bottomed early and then ran for close to four months straight.

    BTC, over that same stretch, mostly chopped sideways in a tight range.

    That gap between “one asset trending hard” and “one asset barely moving” is exactly the condition a rebalance bot is built to exploit, the same divergence dynamic our BTC/ETH rebalance bot backtest had to navigate when the two legs split hard in opposite directions.

    1. What “Divergent Trend” Means for a Rebalance Bot

    In simple terms, a rebalance bot follows the core portfolio rebalancing principle of selling the winner and buying the laggard every time the ratio drifts too far from the target.

    If both assets move together, there’s nothing to sell high and buy low.

    Divergence is the fuel. Without it, the bot just sits there collecting fees for no reason.

    2. The Setup – 4,000 USDT, 50/50 Split, Over a Four-Month Window

    Same capital across all three tests. Same 50/50 NEAR/BTC split. Same start and end point.

    Same 0.1% exchange fee.

    The only thing that changes between Test A, Test B, and Test C is the coin ratio trigger percentage, the same threshold setting covered in CryptoGates’ rebalancing bot guide. That’s the whole point: isolate one variable and let the data speak.

    The Single Variable – Coin Ratio Trigger %

    Here’s the setup. Three tests, one pair, one variable. Test A uses a 5% trigger. Test B uses a 1% trigger. Test C uses a 2% trigger.

    Interactive Checklist:

    • Same 4,000 USDT starting capital across all three tests
    • Same NEAR/BTC 50/50 allocation
    • Same Binance 0.1% fee structure
    • Same January to June window
    • Only the coin ratio trigger % changes

    Everything else, capital, split, fees, window, stays frozen.

    This is the part most backtests skip, and it’s the part that actually matters.

    1. Test A – Conservative (5% Trigger)

    Test A waits for a 5% drift before it does anything. That means fewer trades. Only 47 rebalances over the whole window. Fewer fees are eating into the account too.

    But here’s the issue.

    A trigger this loose risks sleeping through NEAR’s early legs, the exact moves that mattered most when the asset was still cheap.

    Data Highlight

    One pattern emerges across CryptoGates’ parameter-density tests, and it echoes in this NEAR/BTC rebalance trigger comparison: the most aggressive setting is rarely the best-performing one.

    Strategy: Grid Bot
    Coin: NEAR/USDT
    Market Condition: Choppy, range-bound six-week period
    Objective: Compare 20, 45, and 80 grid density settings on identical NEAR price action to find whether more grids mean more profit.

    Key Result: The 80-grid setup executed 633 trades — nearly double the 362 trades of the 45-grid version – yet returned $5.38 less in profit.

    Expert Interpretation: More trade frequency doesn’t compound into more edge once it overshoots the asset’s real swing size; past a certain density, added trades add fee drag. It’s the same mechanism visible in Test B’s 166-trade rebalance run above — activity and performance move independently, not together.

    20 Grids, 45 Grids, 80 Grids: Only One Beat Buy & Hold on NEAR

    2. Test B – Aggressive (1% Trigger)

    Now flip it.

    A 1% trigger means the bot fires constantly, chasing every small wobble in the ratio. Sounds smart on paper, more responsiveness, more captured swings.

    But wait. This is where things change.

    Why Overtrading Hurts Even in a Winning Setup

    166 trades.

    That’s the number for Test B. Compare that to 47 for Test A and just 8 for Test C. Every single one of those 166 trades pays Binance’s standard 0.1% spot trading fee. Even at 0.1%, that adds up fast when you’re rebalancing almost every other day.

    Real Backtest Example

    CryptoGates ran the exact same “isolate one variable” methodology on NEAR itself – this time testing DCA step percentage instead of a rebalance trigger, with the same principle: does tighter spacing actually mean more profit, or just more fees?

    Strategy: DCA Bot
    Coin: NEAR/USDT
    Market Condition: Volatile round-trip – NEAR crashed over 30%, then recovered to close nearly flat.

    Objective: Test 2%, 3%, and 4% DCA step settings against identical capital and take-profit rules to isolate the effect of step size alone.

    Key Result: The 2% step – the tightest, most “responsive” setting – produced the lowest profit of the three at $75.53, while the 3% step landed the best result at $283.23.

    Expert Interpretation: The same pattern shows up here as in the rebalance trigger test above — the tightest setting fired too often relative to the asset’s real volatility, spreading capital across shallow moves instead of letting each entry matter. Matching parameter spacing to actual swing depth mattered more than simply increasing responsiveness.

    NEAR DCA Bot Backtest: 3% Step Strategy Made $283 in a Flat-But-Wild Market

    Does a tighter rebalance trigger always mean better returns?

    Not necessarily. A tighter trigger increases trade frequency and fee drag. In this test, the most aggressive 1% trigger actually produced the lowest return of the three variants.

    The chart might look active and “engaged,” but activity isn’t the same as performance.

    Test B ended with the lowest ROI of the three, 0.96%, proof that a tighter trigger doesn’t automatically mean a better outcome.

    The Results – Did Trigger Sensitivity Actually Produce a Profit Difference?

    Here’s what the numbers actually showed.

    Test A landed 1.33% ROI with 47 trades.

    Test B landed 0.96% ROI with 166 trades.

    Test C, the middle ground at 2%, landed the best result at 1.07%…

    “Binance charges a standard 0.1% spot trading fee for regular users, on both sides of a trade.”

    Source: Binance official fee schedule

    Wait, actually look closer. Test A beat Test C here too. The “optimized” 2% setting didn’t win outright; it landed in between, which honestly isn’t what most people expect going into a test like this.

    1. Reading the Numbers – ROI, Trades, and Fee Impact Side by Side

    Swipe to view full data →
    Test Trigger % Trades ROI % Total P&L
    A (Conservative) 5% 47 1.33% 53.09 USDT
    B (Aggressive) 1% 166 0.96% 38.26 USDT
    C (Optimized) 2% 8 1.07% 42.95 USDT

    Trade count and ROI don’t move together in a straight line.

    More rebalancing didn’t mean more profit. Less rebalancing, in this specific window, actually came out ahead.

    2. The HODL Benchmark Comparison

    Here’s the part most Rebalance fans don’t want to hear.

    The benchmark HODL strategy over this same window returned 3.01%. Every single rebalance variant, A, B, and C, trailed it. That’s a negative rebalancing edge across the board, meaning active management underperformed just holding the two assets untouched.

    SYSTEM ACCESS: CG4.2

    Stop Guessing.
    Stress Test Your Edge.

    The market doesn’t care about your backtest. Our engine simulates 1,000+ “what-if” scenarios to ensure your strategy is built for survival.

    Run Crypto Strategy Engine →
    ROBUSTNESS SCORE
    75+ STRUCTURAL EDGE
    RISK OF RUIN < 1%
    TARGET HIT 92%

    That doesn’t mean rebalancing is useless.

    It means this specific divergence pattern, a slow multi-month grind rather than a sharp back-and-forth chop, favors patience over intervention.

    What This Test Actually Proves About Trigger Ratio %

    The simple truth is that trigger sensitivity matters, but only within a range.

    Push it too tight and fees start eating whatever edge the strategy might have had. Loosen it too much, and you risk missing the moves that justified running a bot in the first place.

    1. When a Tighter Trigger Makes Sense

    A 1% style trigger tends to make more sense in choppier, faster back-and-forth conditions, and on exchanges with lower fees.

    If the ratio is swinging hard multiple times a week, catching those swings early can outweigh the fee cost. That wasn’t quite the case here.

    2. When a Looser Trigger Wins

    A 5% style trigger works better when one asset is on a slow, grinding trend like NEAR was here.

    Does rebalancing always beat holding assets separately?

    No. In this test, a simple HODL benchmark of 3.01% outperformed all three rebalance variants, which ranged from 0.96% to 1.33% ROI.

    Fewer interventions, fewer fees, and the bot isn’t whipsawed by short-term noise along the way.

    Verify Your Own Trigger % Before You Automate It

    So where does that leave things?

    A tighter trigger isn’t automatically better, and a looser one isn’t automatically safer. This test showed a 5% trigger outperforming both a 1% and 2% setting on a slow, trending divergence pair, while the HODL benchmark quietly beat all three anyway, a gap worth checking on your own pair with the Spot Strategy Backtest Bot.

    That’s not a reason to abandon rebalancing. It’s a reason to test it on your own pair, your own window, and your own fee structure before trusting a single number.

    CEO Note:

    A trigger percentage that worked on one pair in one market regime isn’t a rule. It’s a data point. verify first, risk later, scale slowly.

    Run your own parameters and see what the data shows on the Rebalance Strategy Backtest Bot before you automate anything with real capital.

    HISTORICAL DATA AUDIT

    Battle-Test Your Strategy
    Before the Market Does.

    Eliminate guesswork with institutional-grade backtesting for DCA, Grid, and Rebalance bots. Real historical data. Real-world results.

    EST. OPTIMIZATION +42% ROI Efficiency
    Start Backtest Now

    Sourced from 5+ Years of Exchange Data

    FAQs

    What is coin ratio trigger percentage in a rebalance bot?

    It’s the drift threshold that tells the bot when to act. Once your asset ratio moves past that percentage, the bot sells the winner and buys the laggard to restore balance.


    Not based on this test. A 1% trigger produced 166 trades and the lowest ROI, while a 5% trigger with fewer trades landed the highest ROI in the same window.


    Not in this specific case. The HODL benchmark returned 3.01%, ahead of all three rebalance variants tested here.

  • How to Research a Crypto Project 🔍 Before Investing: Fundamentals 📊, Tokenomics 💰

    How to Research a Crypto Project 🔍 Before Investing: Fundamentals 📊, Tokenomics 💰

    You found a project.

    The chart looks decent, the Telegram is loud, and some anon on CT is already calling it the next 100x gem.

    Feels exciting, right?

    Here’s the problem.

    Most people never actually learn how to research a crypto project before investing; they just borrow someone else’s conviction and hope it works out. That’s not research. That’s gambling with extra steps.

    This guide breaks down what real due diligence looks like, the kind that catches problems before your money does.

    EXECUTIVE SUMMARY
    • The Problem: Most investors buy first and research later, if they research at all, and that order gets people rugged.
    • The Solution: A structured way to check fundamentals, tokenomics, and on-chain signals before a single dollar moves.
    • The Incentive: Catching red flags early protects capital and turns picking projects into a repeatable process.
    • The Risk: Skipping this step doesn’t just risk missed gains, it risks total loss on projects built to fail from day one.

    What DYOR Actually Means (Beyond the Meme)

    DYOR gets thrown around like a meme at this point. Someone shills a coin, adds “DYOR” at the end, and acts like that disclaimer covers them.

    It doesn’t work like that.

    Over 84% of retail crypto traders lose money within their first year, with poor research and FOMO as the top two causes.

    (Source: NFTEvening 2025 Retail Crypto Trader Survey)

    Real research isn’t a vibe check.

    It’s a process, and most people skip every step of it.

    Swipe to view full data →
    What Skipping Research Looks Like What Real Research Looks Like Result
    Reading one tweet and buying Checking whitepaper, team, tokenomics Informed entry
    Trusting a chart alone Checking on-chain holder data Spotting red flags early
    FOMO-buying a trending coin Verifying use case vs narrative Avoiding manufactured hype
    Ignoring unlock schedules Mapping vesting and sell pressure Anticipating dumps

    1. Why “Doing Your Own Research” Gets Ignored

    Honestly, research is boring.

    Hype moves fast, and a Telegram group screaming “LFG” is a lot more fun to read than a whitepaper at midnight.

    Real Backtest Example

    Research eliminates one kind of risk. Execution eliminates another – and that’s where discipline tends to break down, even for well-researched positions.

    Strategy: DCA Bot
    Coin: BTC/USDT
    Market Condition: Sharp macro-driven crash (tariff-triggered sell-off)
    Objective: Test whether systematic, rule-based buying holds up during a fast, emotionally difficult drawdown
    Key Result: BTC fell from $87K to $74K in weeks. The bot closed 16 of 17 sessions via take-profit, returning +$349.61 net — while spot holders sat on the drawdown with no defined exit.
    Expert Interpretation: The edge wasn’t prediction. It was following a predefined entry-and-exit structure through a move that would have tested most manual traders’ patience.

    The lesson carries over from research to execution: a system removes the guesswork at the exact moment emotion is most likely to override it. The Tariff Trap Playbook: How a DCA Bot Turned BTC’s Worst April Into +$349 Profit

    That’s exactly why most people skip it.

    Fear of missing out beats patience almost every time, and by the time the research would’ve mattered, the position is already open.

    2. What Real Research Actually Covers

    Think of it like this. Real DYOR isn’t one check; it’s four layers stacked together: fundamentals, tokenomics, on-chain signals, and red flag patterns.

    Skip one layer, and you’re not doing research anymore. You’re doing partial research, which honestly might be worse because it gives you false confidence.

    Start With the Fundamentals

    Before touching the chart, ask a simpler question. Does this project actually need to exist, or is it just riding a trend?

    Fundamentals are where most degen entries fall apart, because nobody bothered checking if there’s a real product underneath the ticker.

    1. Reading the Whitepaper Without Getting Lost

    Wait, don’t skip this section just because white papers are dense.

    You don’t need to read every technical page.

    HISTORICAL DATA AUDIT

    Battle-Test Your Strategy
    Before the Market Does.

    Eliminate guesswork with institutional-grade backtesting for DCA, Grid, and Rebalance bots. Real historical data. Real-world results.

    EST. OPTIMIZATION +42% ROI Efficiency
    Start Backtest Now

    Sourced from 5+ Years of Exchange Data

    Look for three things: the problem it claims to solve, whether that problem is real, and whether the solution makes sense.

    If a whitepaper is 40 pages of buzzwords and zero explanation of what the token actually does, that’s your answer right there.

    2. Team Background and Track Record

    Anonymous teams aren’t automatically a red flag.

    Some legit OGs in this space built anon and still delivered.

    But here’s the issue.

    Anonymous plus no verifiable history plus no code audits is a different story entirely, especially since nearly all successful rug pulls in 2025 involved anonymous developers.

    At that point, you’re not investing in a team, you’re investing in a promise with no accountability behind it.

    3. Real Use Case vs Manufactured Narrative

    Ask yourself this.

    If the current trending narrative disappeared tomorrow, would this project still matter?

    What is DYOR in crypto?

    DYOR means “Do Your Own Research,” the process of independently verifying a project’s fundamentals, team, and tokenomics before investing instead of relying on hype or influencer calls.

    A lot of projects only exist because they’re attached to whatever meta is pumping that month.

    That’s not a use case.

    That’s a costume.

    Tokenomics Check

    Good fundamentals mean nothing if the tokenomics are broken.

    This is where a lot of “solid” projects quietly turn into bagholder machines.

    Tokenomics Research Checklist

    • Check total supply vs circulating supply
    • Look at top wallet holder percentages
    • Map out vesting and unlock dates
    • Check if team/investor tokens are still locked
    • Compare inflation rate to demand growth

    Here’s the thing people miss.

    A project can have a great team and a working product, and still be a bad investment because of how the token itself is structured.

    1. Supply, Distribution, and Vesting Schedules

    Where the tokens sit tells you who actually controls the price.

    CEO Note:

    Zaheer puts it simply, “Verify first. Risk later. Scale slowly.” Tokenomics is one of the clearest places to apply that. The data is public. There’s no excuse for skipping it.

    If insiders hold a huge chunk with vesting ending soon, that’s not paranoia, that’s math.

    2. Inflation, Unlocks, and Sell Pressure

    Here’s what actually matters more than most people realize. An upcoming unlock isn’t a future risk; it’s a scheduled one.

    You can literally see it coming.

    If a huge unlock lands in a month and nobody in the community is talking about it, that silence should worry you more than the unlock itself.

    On-Chain and Liquidity Signals

    The blockchain doesn’t lie, even when the marketing team does.

    This is where research stops being opinion and starts being verifiable fact.

    1. Holder Concentration Checks

    A handful of wallets holding most of the supply isn’t a small detail.

    It’s the difference between a community-driven project and a few whales waiting to exit on you.

    Look, if the top 10 wallets hold 60-70% of the supply, that’s not decentralization. That’s a countdown timer.

    2. Liquidity Locks and Contract Checks

    Unlocked liquidity means the rug pull is one transaction away, full stop.

    This is one of the fastest checks you can do and one of the most skipped.

    How do you check if a crypto project is a scam?

    Check holder concentration, liquidity lock status, contract permissions, and team transparency. Projects with unlocked liquidity, hidden mint functions, or anonymous teams with no track record carry higher scam risk.

    Contract checks matter too.

    Mint functions, ownership renouncement, blacklist functions – these details sound technical, but they’re the actual mechanics of whether a team can rug you legally within their own code.

    Red Flags and Rug Pull Signals

    Most rug pulls don’t come out of nowhere. There were signs.

    Usually, a lot of them. Most people just weren’t looking, or didn’t want to see them because the chart was green.

    1. Common Patterns Behind Failed Projects

    Same playbook, different name, over and over.

    Sudden liquidity removal, team wallets dumping right after unlock, social channels going silent right before a crash.

    SYSTEM ACCESS: CG4.2

    Stop Guessing.
    Stress Test Your Edge.

    The market doesn’t care about your backtest. Our engine simulates 1,000+ “what-if” scenarios to ensure your strategy is built for survival.

    Run Crypto Strategy Engine →
    ROBUSTNESS SCORE
    75+ STRUCTURAL EDGE
    RISK OF RUIN < 1%
    TARGET HIT 92%

    Funny enough, the pattern repeats so often that experienced traders can spot it forming in real time.

    New entrants keep falling for it because it’s dressed up differently each cycle.

    2. When to Walk Away Completely

    Some red flags aren’t worth “waiting and seeing.” Anonymous team, no locked liquidity, and copy-pasted whitepaper together?

    That’s not a maybe. That’s an exit.

    You don’t need every red flag to appear before walking away. Sometimes one is enough, especially if it’s liquidity-related.

    Test Before You Trust – Where CG Tools Fit

    Research tells you what to buy. It doesn’t tell you how to trade it without guessing, and that’s a different problem entirely.

    This is where most DYOR guides stop, honestly.

    They tell you to research the project and then just… leave you there. But picking a good project is only half the equation.

    1. From Project Research to Strategy Verification

    Let’s say your research checks out.

    Team’s real, tokenomics are clean, liquidity’s locked. Great, now what?

    Now you need a strategy for actually trading it, and that strategy needs testing too.

    This is where CryptoGates’ Backtest Bots come in, letting you run DCA, Grid, or Rebalance strategies against real historical data before committing capital.

    2. Why “Verify First, Risk Later” Applies Here Too

    The same discipline that filters bad projects should filter bad strategies.

    It’s the same principle, just applied one step further down the process.

    CG STRATEGY ANALYZER

    Confused about
    market outlook?

    Trading without a plan is just gambling. Our strategy architect analyzes your risk tolerance and capital to match you with a proven algorithmic framework.

    PASSIVE DCA Bot
    AGGRESSIVE Grid Pro
    BALANCED Rebalance

    Sound familiar?

    It should. Verify the project. Then verify the strategy. Skipping either half defeats the purpose of doing the first half at all.

    Research Now Saves You Later

    DYOR isn’t optional, and it never really was.

    It’s the difference between running a strategy and running a gamble that happens to have a chart attached to it.

    Fundamentals, tokenomics, on-chain signals, red flags: none of these steps are complicated on their own. The hard part is actually doing all of them before you buy, not after.

    Test this setup yourself → cryptogates.io.

    Once the research checks out, verify your strategy with the same discipline using the Strategy Engine or a CryptoGates Backtest Bot before risking real capital.

    FAQs

    How long should researching a crypto project take?

    It varies, but a proper check of fundamentals, tokenomics, and on-chain data usually takes a few hours, not minutes.

    Yes. Research reduces risk, it doesn’t eliminate it. Markets and teams can still change after your review.

    No. Even established projects deserve periodic checks, especially around major unlocks or leadership changes.

  • 7 Free Crypto Tools for Beginners 🔍 to Find Better Strategies, Backtest 🧪, and Reduce Risk ⚠️

    7 Free Crypto Tools for Beginners 🔍 to Find Better Strategies, Backtest 🧪, and Reduce Risk ⚠️

    Ser, be honest with yourself for a second.

    How many crypto tools have you paid for that you used exactly once?

    Most beginners think they need a premium subscription to trade smart.\

    They don’t, as this comparison of free vs paid crypto backtesting software shows exactly where free tools hold up.

    The truth is, a handful of free crypto tools for beginners already cover everything from strategy matching to backtesting to risk stress testing, and most people never even open them.

    Over 70% of retail crypto traders lose money, often because they skip verification steps entirely

    (Source: Industry Research)

    This isn’t about grinding through paid courses or chasing a signal group on Telegram.

    It’s about knowing which free tools actually do the heavy lifting and using them before you ape into anything.

    EXECUTIVE SUMMARY
    • The Problem: Beginners either skip tools entirely or pay for ones that don’t fix the real issue, which is trading without verification.
    • The Solution: Seven free CryptoGates tools cover strategy matching, backtesting, stress testing, and quick calculations, all in one workflow.
    • The Incentive: You test everything before a single dollar touches the market.
    • The Risk: Even free tools won’t save you if you skip the process and jump straight to execution.

    Why Free Tools Beat Guesswork Every Time

    Here’s the thing. Most people don’t lose money because the market is unfair.

    They lose money because they never tested the idea in the first place. They saw a chart, felt FOMO, and ape’d in.

    Free tools remove that excuse. When something costs nothing to try, there’s no reason to skip it.

    And when a tool is built specifically to test strategies against real historical data, skipping it isn’t saving time. It’s just gambling with extra steps.

    HISTORICAL DATA AUDIT

    Battle-Test Your Strategy
    Before the Market Does.

    Eliminate guesswork with institutional-grade backtesting for DCA, Grid, and Rebalance bots. Real historical data. Real-world results.

    EST. OPTIMIZATION +42% ROI Efficiency
    Start Backtest Now

    Sourced from 5+ Years of Exchange Data

    Look, the market doesn’t care how confident you feel about a trade idea. It cares whether the idea actually holds up.

    That’s the entire reason backtesting and simulation tools exist.

    Verify first. Risk later. Scale slowly.

    The Cost of Trading Without a Toolkit

    Most losses don’t come from bad luck.

    They come from skipping a step that a free tool would’ve caught in under two minutes.

    Reality Check

    Common belief: Grid bots print money regardless of market direction, since they’re just buying low and selling high inside a range.

    What CryptoGates research found:
    Strategy: Grid Bot
    Coin: BTC/USDT
    Market Condition: Trending bull run (BTC +10.4% for the month)
    Objective: Measure grid performance when price breaks trend instead of staying range-bound
    Key Result: The bot returned +7.74% on just $3.26 in fees — a real, profitable outcome — but buy-and-hold still outpaced it over the same stretch.
    Expert Interpretation: A grid bot isn’t malfunctioning in a trending market; it’s working against its own design. The strategy is built to harvest oscillation inside a range, not a sustained directional move — which is the exact mismatch described just above, where a grid position entered a trending market instead of a ranging one.

    Why it matters: Matching the strategy to the market condition, not picking whichever bot sounds appealing that week, is what separates a working setup from a mismatched one.

    Full breakdown: BTC Pumped +10% in May — Our Grid Bot Made +7.74%

    Think about it this way.

    A trader enters a grid trading strategy during a strong trending market instead of a ranging one.”

    A quick check with a simulator would’ve flagged that mismatch before any capital moved. Instead, it turned into a bagholder situation nobody saw coming, mostly because nobody checked.

    That’s not bad luck. That’s a missing toolkit.

    The Strategy Picker (Find Your Fit First)

    Before you touch any bot, you need to know which strategy actually fits you. Not the one that’s trending on CT this week.

    The one that matches your risk tolerance, capital, and time.

    The Strategy Picker on CryptoGates does exactly that. It’s a simple 10-question tool covering your market outlook, risk tolerance, capital size, experience level, and a few other factors.

    Answer honestly, and it will point you toward DCA, Grid, or Rebalance, whichever fits your actual profile instead of whatever’s pumping on Twitter that day.

    SYSTEM ACCESS: CG4.2

    Stop Guessing.
    Stress Test Your Edge.

    The market doesn’t care about your backtest. Our engine simulates 1,000+ “what-if” scenarios to ensure your strategy is built for survival.

    Run Crypto Strategy Engine →
    ROBUSTNESS SCORE
    75+ STRUCTURAL EDGE
    RISK OF RUIN < 1%
    TARGET HIT 92%

    Here’s what most beginners miss.

    They pick a strategy because it sounds exciting, not because it fits their situation.

    A degen with a high risk tolerance and small capital might genuinely be fine running an aggressive grid.

    A busy professional with a steady income and low monitoring time probably isn’t.

    Who This Tool Is Really For

    Honestly, this tool is built for two types of people.

    Beginners who don’t know where to start, and busy professionals who want exposure without babysitting charts all day.

    What is the best free tool for crypto beginners?

    A strategy matching tool that assesses risk tolerance and goals before recommending an approach works best. It stops beginners from picking a strategy blind.

    If you’re new to bot trading, the questions alone will teach you things.

    You’ll start thinking in terms of drawdown limits and monitoring time instead of just “will this pump.”

    The Backtest Bots (DCA, Grid, Rebalance)

    Now let’s get into the part that actually separates disciplined traders from everyone else. Backtesting.

    CryptoGates runs three backtest bots, one each for DCA, Grid, and Rebalance strategies.

    Each one lets you run your exact parameters against real historical market data before you commit a single dollar.

    Want to know how a DCA strategy would’ve performed during a 40% drawdown? Run it. Curious if a grid setup survives a choppy, range-bound market?

    Test it first.

    Real Backtest Example

    Strategy: DCA Bot
    Coin: DOT/USDT
    Market Condition: Severe multi-month downtrend (−56% over 7 months)
    Objective: Test whether disciplined step-buying holds up through a prolonged, unrelenting decline rather than a single sharp dip
    Key Result: 79 of 80 sessions closed in profit. The bot returned +$380.99 while spot holders sat on a −$617 loss on the same starting capital — a $998 gap in outcomes.
    Expert Interpretation: The edge here didn’t come from timing the bottom. It came from spreading entries across the entire decline instead of committing capital at one price point — exactly the kind of scenario a backtest bot lets you check before real money is on the line.

    Full breakdown: DOT Crashed 56% in 7 Months — The Falling Knife Test

    This is where the “verify first” part of our philosophy actually gets practical.

    It’s not a slogan. It’s a literal button you can press before risking capital.

    Why Backtesting Beats Backtesting Claims You Read Online

    Here’s the issue with most strategy claims floating around CT.

    Someone posts a screenshot of a 40% gain and calls it a system.

    No context, no timeframe, no proof it wasn’t a lucky sequence.

    CG STRATEGY ANALYZER

    Confused about
    market outlook?

    Trading without a plan is just gambling. Our strategy architect analyzes your risk tolerance and capital to match you with a proven algorithmic framework.

    PASSIVE DCA Bot
    AGGRESSIVE Grid Pro
    BALANCED Rebalance

    A backtest bot doesn’t care about vibes.

    It runs your parameters against actual price data and shows you the real result, like this BTC DCA Bot Backtest: The Honest Truth, wins and losses included.

    That’s the difference between a claim and evidence.

    The Strategy Engine and Exchange Picker

    Once you’ve backtested a strategy and it looks solid, don’t just assume it’ll hold up forever. Markets shift.

    What worked in a trending market might fall apart in a choppy one.

    This is where the Strategy Engine comes in. It runs Monte Carlo simulations, basically thousands of “what if” scenarios using different trade sequences, to see if your strategy’s performance was actually structural or just a lucky run.

    Click “Run” once, and you’ll get a Robustness Score. Click it again and get a different result each time, because the market never repeats itself exactly either.

    Swipe to view full data →
    Tool What It Solves
    Strategy Picker Matches your profile to a strategy
    Backtest Bots Proves the strategy on real data
    Strategy Engine Stress-tests for luck vs structure
    Exchange Picker Finds where to execute it
    Converter + Simulators Quick math before committing funds

    Once your strategy passes that stress test, the Exchange Picker helps you find where to actually execute it.

    It’s another quick questionnaire covering things like fees, security requirements, leverage needs, and payment methods, matching you to an exchange from partners like Binance, OKX, KuCoin, and a few others instead of you guessing based on which one your favorite YouTuber uses.

    Robustness Over Luck

    A strategy that survives 1,000 random simulations and keeps a stable score is fundamentally different from one that only worked once in backtesting.

    How do I know if a crypto strategy is actually reliable?

    Run it through a stress test tool using Monte Carlo simulation. If the results stay consistent across thousands of random trade sequences, the edge is likely structural instead of lucky.

    If your Robustness Score swings wildly every time you hit run, that’s not randomness being unfair to you.

    It’s the strategy telling you it depends too much on one specific sequence of trades to work.

    A Risk of Ruin above 1% is generally considered high risk in professional trading circles.

    Crypto Converter and Simulators (Rounding Out the Toolkit)

    The last two tools are simple, but they matter more than people give them credit for.

    The Crypto Converter handles quick swaps and rate checks across 500+ pairs, with no hidden fees, no digging through five different exchange apps just to figure out what your position is actually worth right now.

    CEO Note:

    Zaheer puts it simply. Every strategy deserves proof before it deserves capital. That’s not a tagline. It’s the whole reason these tools exist.

    The Simulators, Spot, DCA, Grid, and Rebalance let you preview outcomes before you commit.

    Want to see how a DCA entry plays out during a 40% drawdown, or how a grid bot performs across a defined price range?

    Run the numbers first. It takes a couple of minutes and beats finding out the hard way with real capital on the line.

    CONFIDENTIAL // RESEARCH
    STRATEGY INTELLIGENCE

    Proven Setups &
    Expert Breakdowns.

    We don’t just show you the data; we engineer and validate high-performance strategies, providing the “Alpha” behind the numbers.

    Building a Simple Weekly Routine With These Tools

    Here’s a routine worth stealing.

    Once a week, run your active strategy through the backtest bot again with any new data.

    Check your Robustness Score if anything feels off. Use the converter when you’re rebalancing between pairs.

    Your Weekly Free Tools Routine

    • Run active strategy through backtest bot with fresh data
    • Check Robustness Score if anything feels off
    • Confirm Risk of Ruin is still under your comfort line
    • Use Converter when rebalancing between pairs
    • Re-run Strategy Picker if your risk profile or capital changed

    That’s it.

    Fifteen minutes, maybe less once you’re used to it.

    It’s not exciting, but neither is losing capital because you skipped a step that takes less time than scrolling CT.

    Bookmark These Before You Trade Another Coin

    Seven tools. Zero cost. One shared purpose: test everything before you risk anything.

    The Strategy Picker tells you what fits.

    The backtest bots prove whether it works. The Strategy Engine checks if it survives beyond one lucky run.

    The Exchange Picker, Converter, and Simulators round out the rest. None of it requires guesswork, and none of it requires capital to get started.

    Test this setup yourself before you risk a single dollar on the next trade.

    FAQs

    Are CryptoGates tools really free to use?

    Yes. No signup, no credit card, and no capital required to test strategies using the backtest bots, simulators, and Strategy Picker.


    No. The Strategy Picker and Exchange Picker are built for beginners, walking you through simple questions instead of requiring prior knowledge.


    Start with the Strategy Picker to find your fit, then run that strategy through the matching backtest bot before doing anything else.