

 Bitcoin
 Ethereum
 Solana
 TRON
 Zcash
 Hyperliquid
 Dogecoin
 Monero
 Chainlink
 Cardano
 Stellar
 Uniswap
 Sui
 Hedera
 Shiba Inu
 Bittensor
 Ripple USD
 Aster
 Polkadot
 World Liberty Financial
 Render
 Artificial Superintelligence Alliance

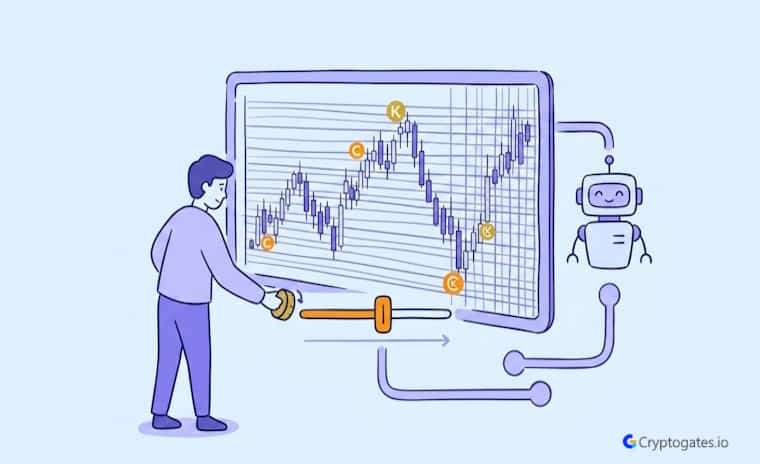
You set up your grid bot.
You pick a price range. And then you hit a number that feels almost random: how many grids do I actually need?
Twenty feels lazy. Eighty feels aggressive.
Forty-five feels… fine, maybe?
Here’s the thing.
This one setting decides whether your bot catches every little swing in a choppy market or quietly bleeds profit to fees on trades that barely matter.
Most traders treat grid density as a throwaway field. It’s not.
- The Problem: Traders pick a grid count based on gut feeling instead of testing how it interacts with the market's actual behavior.
- The Solution: Isolate grid density as a single variable and compare how it performs across a real, choppy price range.
- The Incentive: A well tuned grid count can mean the difference between a strategy that grinds out steady gains and one that just churns fees.
- The Risk: Too many grids in the wrong conditions can shrink your per trade profit until fees quietly eat your edge.
What Grid Density Actually Controls
Grid count isn’t about how much you make per trade.
That’s what profit per grid handles. Grid count controls something different: how many grid levels your bot places and how often it actually fires inside the range you’ve set. Think of it like this.
Your price range is the road.
Grid count is how many toll booths you’ve placed along it. More booths mean more stops, more small transactions, more chances to catch a swing.
Fewer booths mean the bot waits for bigger moves before it does anything.
Before You Set Your Grid Count
- Confirm your price range width first, grid count means nothing without it
- Check your exchange's fee percentage per trade
- Estimate how many trades a tight grid would generate in your range
- Compare at least two or three grid counts before picking one
- Re-check density if the market shifts from choppy to trending
Ser, this is exactly where most beginners get it backwards.
They assume more grids automatically mean more profit. It doesn’t. It means more activity.
Whether that activity helps or hurts depends entirely on whether the market is actually moving enough to justify it.
1. Why Traders Treat This Setting As An Afterthought
Most people copy whatever default number the platform suggests, or whatever number they saw in someone else’s screenshot, one of the most common grid trading mistakes real backtests expose.
Nobody adjusts it to the coin, the range, or the current market mood. It’s one field on a long settings screen, so it gets treated like an afterthought.
Real Backtest Example
Strategy: Grid Bot
Coin: XRP/USDT
Market Condition: Near-flat, ranging market over a 90-day window
Objective: Test how a high grid count performs when price barely moves net-to-net
Key Result: 875 executed trades produced $1,817.91 in gross grid profit, settling at $1,387.14 net after fees — a 27.74% return, versus just 0.24% for a buy-and-hold position over the same period
Expert Interpretation: This is density doing exactly what it’s supposed to do — a high trade count only pays off because the range stayed tight enough for the bot to keep completing round-trips. The roughly $430 gap between gross and net profit is the fee cost of running that many “toll booths,” a useful concrete number for readers weighing how aggressive to set their own grid count.
XRP Went Nowhere for 3 Months — Our Grid Bot Made +27.74% Anyway
But here’s what most beginners miss: grid count is the one parameter that interacts directly with volatility.
Change the market condition, and the same grid count can go from perfect to painful.
2. The Two Failure Modes
There are only two ways this goes wrong, and they sit on opposite ends.
Too few grids and your bot misses swings.
Price bounces around inside your range, but your toll booths are spaced so far apart that half the movement happens between them, invisible to your bot.

No. More grids means more trades, not more profit. Past a certain density, fees start eating into each trade's return, and your net gain can actually fall even as trade count rises.
Too many grids and you get the opposite problem.
The bot trades constantly, sure, but each trade is tiny. Fees stack up, and profit per trade shrinks, a pattern our 55-grid SUI backtest shows in real fee drag numbers.
Eventually, you’re paying to trade more than you’re earning from trading.
How Grid Count Behaves In A Sideways Or Choppy Range
A trending market and a choppy market ask completely different things from your grid settings.
In a strong trend, price mostly moves in one direction, so a bot doesn’t get many chances to buy low and sell high inside a fixed range.
But in a sideways, choppy market, price keeps bouncing back and forth between support and resistance.
That back and forth is exactly what a grid bot is built to harvest.
Reality Check
Common belief: More trades from a grid bot naturally means more profit.
What CryptoGates research found: In a backtest on BNB during a 33% post-ATH crash, the bot fired 171 trades and generated $163.94 in grid profit — activity that looked healthy on paper. But total account ROI still landed at −21.64% once fees and the underlying price move were factored in.
Why it matters: Trade count and gross grid profit measure activity, not outcome. A dense grid can keep firing and still lose money if the market direction works against it — which is exactly the “too many grids” trap the article describes, just with real numbers behind it.
BNB Crashed 33% After Its ATH — Our Grid Bot Lost Less, But Still Lost
Look, this is the part that actually matters for range-bound conditions.
More oscillation means more opportunities for a denser grid to catch small moves that a wider spacing would just skip over.
In a market that keeps chopping between the same two levels for weeks, a tighter grid can turn that repetitive motion into repeated, small wins.
Why Choppy Markets Reward More Frequent Trading
When price keeps swinging inside a range instead of breaking out, every extra grid line is another chance to buy a dip and sell a bounce.
The market is doing the work. Your job is just to have enough toll booths placed to catch it.
Confused about
market outlook?
Trading without a plan is just gambling. Our strategy architect analyzes your risk tolerance and capital to match you with a proven algorithmic framework.
Where Density Stops Helping
Here’s the issue, though.
There’s a ceiling.
Once your grids are packed so tightly that the price barely moves the distance between two lines, each trade becomes smaller and smaller.
At some point, the fee on that tiny trade cancels out most of the gain.
Adding more grids past this point doesn’t capture more of the market’s movement. It just adds noise and cost.
Finding Your Own Balance Point
Realistically, there’s no single “correct” grid number that works for every coin, every range, and every fee schedule.
The right density depends on how wide your price range is, what your exchange charges per trade, and, honestly, how active you actually want the bot to be while you’re not watching it.
| Signal | What It Means | What To Do |
|---|---|---|
| Low trade count, wide swings visible | Grids spaced too wide | Add more grids or narrow the range |
| High trade count, shrinking profit/trade | Grids spaced too tight | Reduce grid count or check fee tier |
| Steady trade count, stable profit/trade | Density roughly balanced | Backtest nearby counts to confirm |
Signals That Your Grid Is Too Wide Or Too Tight
A few tells are worth watching for.
If your trade count stays low while the price is clearly swinging a lot inside your range, your grids are probably spaced too wide, and you’re leaving moves uncaptured.
Start by matching grid count to your range width and the coin's typical volatility, then compare a few grid counts side by side using the same range and fees to see which one balances trade frequency against profit per trade.
On the other hand, if trade count is high but your profit per trade keeps shrinking toward the fee level, you’ve likely gone too dense.
The sweet spot usually sits somewhere between those two signals, not at either extreme.
Density Is A Lever, Not A Guess
Grid count feels like a small setting, but it quietly shapes whether your bot works with the market’s rhythm or against it.
The smarter approach isn’t picking a number that feels safe or aggressive. It’s testing a few grid counts against the same range and the same conditions, then letting the results tell you where the balance actually sits.
Run your own parameters and see what the data shows before you commit real capital to one setup.
Test this setup yourself on the Grid Strategy Backtest Bot.
Battle-Test Your Strategy
Before the Market Does.
Eliminate guesswork with institutional-grade backtesting for DCA, Grid, and Rebalance bots. Real historical data. Real-world results.
FAQs
What happens if I use too few grids on a grid bot?
The bot ends up waiting for larger price moves before it trades, which means it misses a lot of the smaller swings a choppy market naturally offers.
Can too many grids actually hurt my returns?
Yes. Once trades get small enough, fees start canceling out most of the profit per trade, even though the bot is technically trading more often.
Does the ideal grid count stay the same across every coin?
No. It shifts based on the coin’s volatility, your price range width, and the fee structure on your exchange, so it needs to be tested per setup rather than assumed.