Here’s something most dollar-cost averaging (DCA) traders never think about until it’s too late.
You can pick the perfect asset, catch a real narrative, and still watch your bot run dry before the recovery even starts.
That’s not bad luck.
That’s usually a DCA step percentage problem hiding in plain sight.

Source: CoinGecko Research, 2025
Picture this: a coin gets real institutional attention, actual partnerships, actual utility news, and the price still bleeds lower for months.
Your bot keeps buying dips that just keep dipping.
At some point, every DCA order gets used up, and you’re sitting there with no ammo left, watching the chart from the sidelines.
That’s exactly the setup we’re breaking down here.
Ser, this one’s about spacing, not size.
- The Problem: Traders assume DCA order size decides how well a strategy survives a drawdown, when spacing between orders matters more.
- The Solution: Testing DCA Step % at different values while holding everything else constant reveals which spacing lets capital last through a slow bleed.
- The Incentive: Getting step spacing right means your bot still has orders left when the market finally turns.
- The Risk: Get the spacing wrong, and you’ll run out of capital exactly when the setup needs it most, turning a recoverable dip into a real loss.
What DCA Step % Actually Controls
Let’s get one thing straight before anything else.
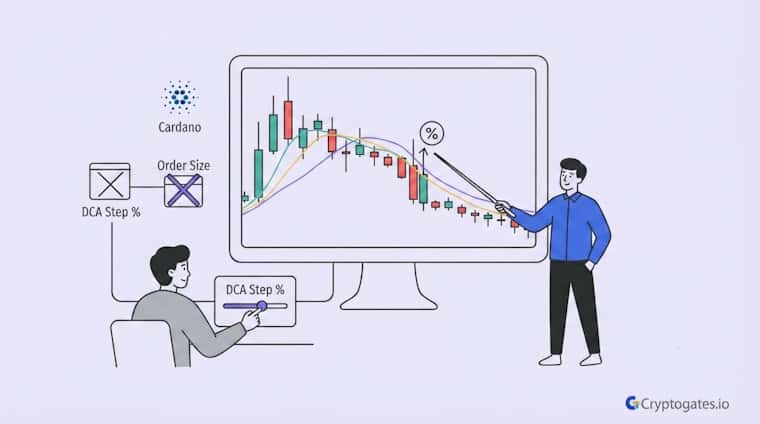
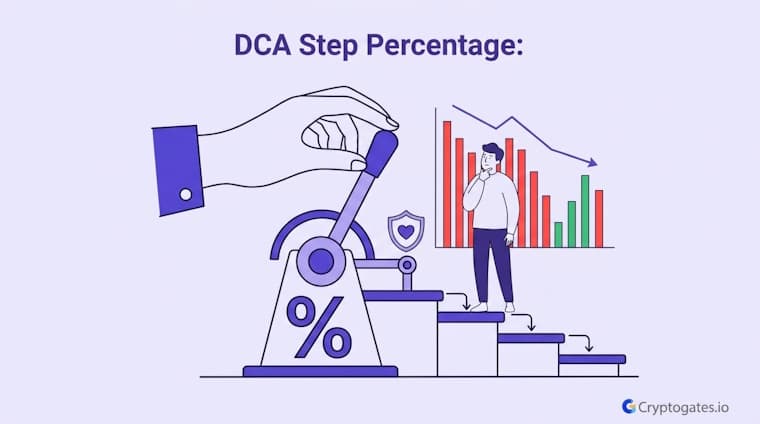
DCA Step % isn’t about how much you’re buying.
It’s about how far the price has to drop before your bot buys again.
Two completely different jobs, and mixing them up is where a lot of strategies quietly fall apart.
Historical Binance data on mid-cap altcoins shows drawdowns exceeding 50% occur in roughly 1 out of every 3 extended bearish cycles.
Source: Binance Research, 2024
Think of it like spacing out gas stations on a long road trip.
Order size is how much fuel you take on at each stop. Step % is how far apart those stations are.
If your stations are packed close together, you’ll be topped up early, sure.
But you’ll also run out of stations way before the trip’s actually over.
| Step % | Orders Used Before Bleed Ended | Outcome |
|---|---|---|
| 1% | All 9 used within first 6 weeks | Ran out early, missed later dip |
| 2.5% | 9 used by mid-point of decline | Partial capital left near bottom |
| 5% | 9 lasted the full stretch | Capital still active into recovery |
1. Why Traders Confuse Step % With Order Size
Honestly, this mix-up is one of the biggest DCA mistakes crypto investors keep making, because order size feels like the more “controllable” number.
It’s the one you type in first. Step % feels secondary, almost like a technical setting you leave at the default.
But here’s the issue. Order size decides your exposure per trade.
Step % decides your exposure over time.
A trader can nail the order size and still get wrecked because the bot ran through nine DCA orders in the first two weeks of a six-month bleed.
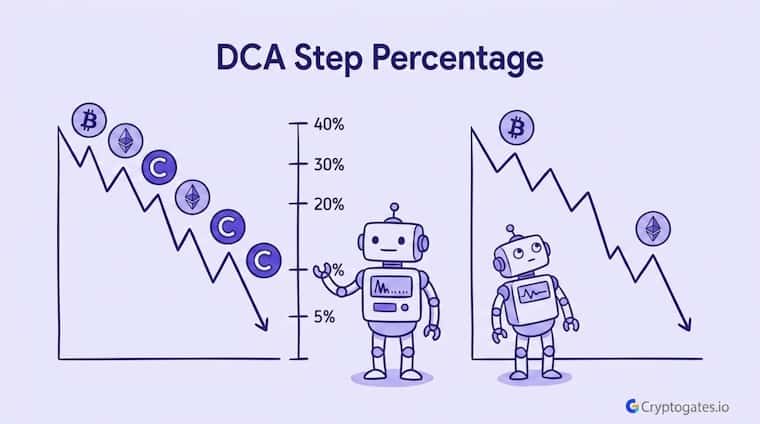
2. Tight Spacing vs Wide Spacing
Tight spacing sounds appealing on paper.
You catch more dips, you average down faster, and you feel proactive.
In a sharp V-shaped crash, that can actually work in your favor.

For DCA setups, extreme fear readings (below 25) tend to line up with the type of grinding drawdowns where step spacing matters most. It’s not a signal to buy, just context for why wider spacing often performs better in these regimes.
But in a slow grind lower, tight spacing burns through your DCA orders fast.
Wait, and here’s the part that trips people up.
Wide spacing feels passive, almost too slow, right up until the moment it’s the only thing keeping your bot alive three months into a drawdown nobody expected to last that long, part of why only a small share of retail traders stay consistently profitable across full market cycles.
Real Backtest Example
Strategy: DCA bot, tight 1.5% step interval
Coin: TAO/USDT
Market Condition: Sharp pump followed by a fast multi-leg reversal — price round-tripped from a near-$300 high to a 17% net loss
Objective: Test whether tight step spacing can still extract value when a decline unfolds in a handful of fast legs rather than a slow multi-month grind
Key Result: 139 of 140 sessions closed in profit, returning +$1,677 while spot holders were sitting on a 17% loss over the same window
Expert Interpretation: The tight spacing worked here specifically because the reversal was fast and sharply staged — each leg down triggered a fresh order before the price moved on. That’s the opposite of the slow-bleed scenario this article is built around, and it’s the clearest illustration that step % has to be matched to the shape of the decline, not just picked and left on default.
Why Slow Bleed Markets Punish The Wrong Step %
A slow bleed doesn’t behave like a normal correction.
It’s not one sharp drop and a bounce.
It’s death by a thousand cuts, small red candles stacking on top of each other for weeks, sometimes months, with just enough green days to keep hope alive.

It best. “Verify first. Risk later. Scale slowly. A slow bleed isn’t the market being unfair. It’s the market testing whether your spacing was ever built to survive it.”
That kind of grind is brutal on tight step spacing specifically.
Every small dip triggers another order.
Before you know it, your max DCA orders are gone, and the price is still finding new lows.
Stop Guessing.
Stress Test Your Edge.
The market doesn’t care about your backtest. Our engine simulates 1,000+ “what-if” scenarios to ensure your strategy is built for survival.
Run Crypto Strategy Engine →1. The “Good News, Bad Price” Trap
Here’s the part that catches even experienced traders off guard.
Sometimes the fundamentals are genuinely good.
Real partnerships, real adoption, real utility.
And the price still falls anyway, because broader market conditions or sector rotation are working against it.
Real Backtest Example
Strategy: DCA bot, small step %
Coin: BTC/USDT
Market Condition: Slow-bleed, sideways-to-bearish month — BTC down roughly 2%
Objective: Test whether tighter step spacing can survive a shallow but grinding decline long enough to still close in profit
Key Result: 7 of 8 sessions closed in profit, netting +1.93% even as price drifted lower across the full month
Expert Interpretation: The one losing session matters more than the seven winners — it’s the point where spacing choices start to strain even in a mild bleed. It backs up the article’s core claim directly: order size gets the attention, but it’s the gap between orders that determines whether the bot still has ammo left when a slow grind finally turns.
This is where a lot of bagholders get made, not because the project was bad, but because the strategy wasn’t built for a drawn-out disconnect between news and price.
Your bot doesn’t know or care about the good news.
It only knows price levels, and if step spacing is too tight, it runs out of room long before the fundamentals catch up.
2. Directional Pattern Across Step % Tests
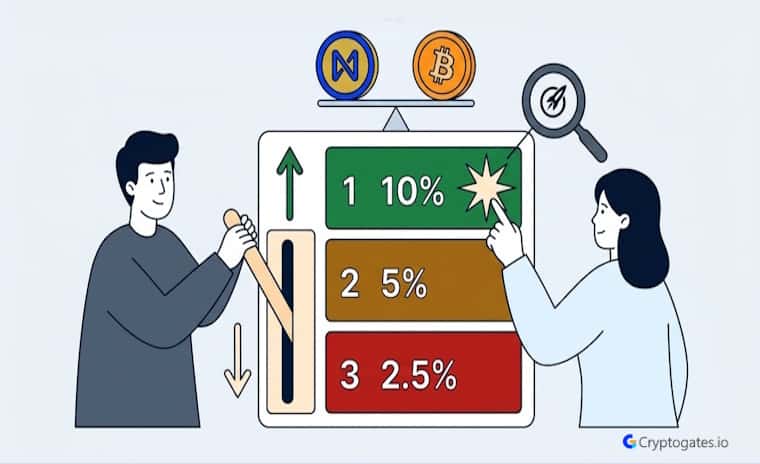
Running the same setup at 1%, 2.5%, and 5% step spacing while keeping order size, take profit, and everything else identical shows a clear pattern.
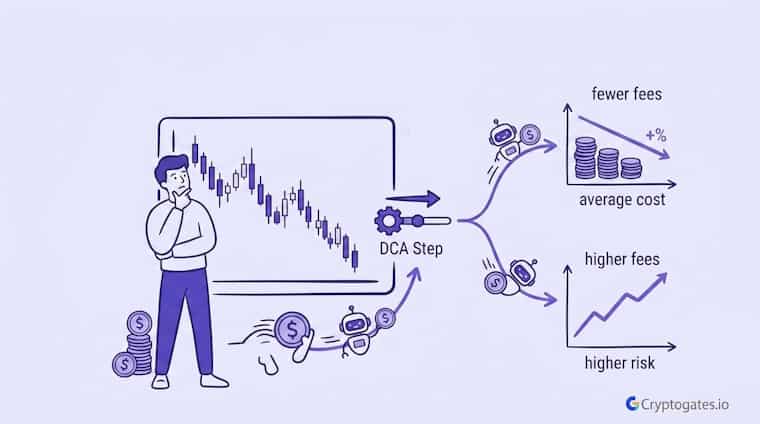
Tighter spacing means faster capital deployment and, in extended bleeds, earlier exhaustion.
Wider spacing means slower deployment, but more staying power across the full length of the decline.
There’s no fixed number here. Some grinds resolve in weeks, others stretch for two or three quarters. That unpredictability is exactly why step spacing needs to assume the longer scenario, not the best case one.
The interesting part isn’t that wider spacing wins outright.
It’s that the gap between tight and wide gets more dramatic the longer the bleed drags on.
Short dips barely show a difference. Long, grinding ones separate the strategies fast.
The Takeaway On DCA Step Spacing
So here’s the bottom line.
DCA Step % isn’t a background setting you leave on default and forget about.
It’s the parameter that decides whether your bot survives long enough to see the recovery or taps out three orders too early.
Order size gets the attention, but spacing does the heavy lifting in a slow bleed.
Test your own step spacing against real historical data before assuming your setup can handle a grind that lasts longer than you expect.
Interactive Checklist
- Check how many DCA orders your current step % burns through in a typical 20-30% pullback
- Compare that against how long past slow bleeds in your chosen asset actually lasted
- Widen step spacing if your orders run out before price stabilizes
- Backtest at least two step % values before locking in a live setting
- Confirm max DCA orders still leave room if the bleed extends longer than expected
Test this setup yourself using the DCA Strategy Backtest Bot on CryptoGates.
Battle-Test Your Strategy
Before the Market Does.
Eliminate guesswork with institutional-grade backtesting for DCA, Grid, and Rebalance bots. Real historical data. Real-world results.
FAQs
Does a wider DCA step percentage always perform better?
Not always. In sharp, fast crashes, tighter spacing can capture more of the drop before recovery. Wider spacing tends to help more in slow, extended declines.
Should I increase order size instead of adjusting step percentage?
Order size affects how much you deploy per trade, not how long your capital lasts. Step spacing is the lever for survival in longer drawdowns.
How do I know if a market is in a slow bleed instead of a normal correction?
Slow bleeds show extended periods of small red candles with weak bounces, often spanning months rather than days or weeks.