
 Bitcoin
  Ethereum
  Solana
  TRON
TRON  Zcash
Zcash  Hyperliquid
  Dogecoin
  Monero
  Chainlink
  Cardano
  Stellar
  Uniswap
  Hedera
  Sui
Sui  Shiba Inu
  Bittensor
  Ripple USD
  Polkadot
  Aster
Aster  World Liberty Financial
  Render
  Artificial Superintelligence Alliance
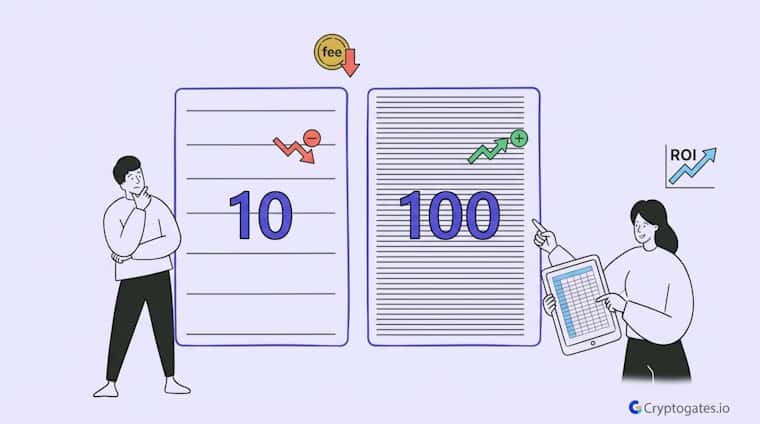
Look, most people setting up a grid bot for the first time just pick a number. 20 grids?
Sure. 50? Why not.
Nobody tells them that this one setting, the grid density, quietly decides whether the bot prints steady gains or slowly bleeds them out through fees.
In a choppy, range-bound market, that difference gets amplified fast.

Source: CryptoGates Internal Backtest, 2026
Too few grids and price slips right past your levels without triggering a single trade.
Too many and you’re paying fees on trades that barely move the needle.
The right grid density isn’t a guess; it’s something you can actually test with a grid backtest bot before you risk a cent.
- The Problem: Traders pick a grid count arbitrarily, without knowing how it affects trade frequency, fee drag, or missed price swings.
- The Solution: Backtest a few different grid densities on the same range and compare ROI, trade count, and fees before committing capital.
- The Incentive: The right density can mean the difference between a bot that quietly compounds and one that just spins its wheels.
- The Risk: Even a well-chosen grid density can underperform if the market breaks out of its range instead of staying choppy.
What Grid Density Actually Means
Here’s the thing.
Grid density just means how many price levels your bot places buy and sell orders on, between your set high and low.
That’s it.
But this one number changes almost everything about how the bot behaves.
| Grid Count | Trade Size | Trade Frequency |
|---|---|---|
| Low (15) | Larger | Fewer trades |
| Medium (35) | Moderate | Moderate |
| High (70) | Smaller | Frequent trades |
A bot with 15 grids across a range trades in bigger steps.
A bot with 70 grids across the same range trades in much smaller steps, consistent with Binance’s own grid trading documentation, which confirms that more grids directly increase trade frequency.
1. More Grids vs Fewer Grids - The Core Trade-off
More grids mean the bot reacts to smaller price moves.
It buys and sells more often, in smaller chunks.
Fewer grids mean it waits for bigger swings before doing anything.
Neither is automatically better. It depends on how the asset is actually moving, and honestly, that’s where most people get it wrong.
They assume more activity equals more profit.
Real Backtest Example
Strategy: Grid
Coin: NEAR/USDT
Market Condition: Sideways-to-volatile, 45-day window
Objective: Test whether grid density itself — independent of asset choice — determines outcome
CryptoGates ran the same range on NEAR at three different densities: 20, 45, and 80 grids. Only the 45-grid configuration outperformed a simple buy-and-hold position over the test window; the 20-grid version spaced its levels too far apart to catch the daily chop, while the 80-grid version generated activity without a proportional payoff once fees were netted out.
Key Result: 45 grids delivered a 17.18% ROI — the only one of the three densities to beat passive holding.
Expert Interpretation: The finding backs up what this article argues structurally: density isn’t a “more is better” dial. There’s a middle band where trade frequency matches the asset’s actual volatility, and moving away from it in either direction costs money.
2. Why "More Trades" Doesn't Always Mean More Profit
This is where things change.
More trades sounds productive, but every single trade carries a fee, as Binance Academy’s breakdown of maker and taker charges makes clear.
If your profit per grid is thin and your fee eats into most of it, a high trade count can look busy on paper while barely growing your account.
It’s not about how often the bot fires. It’s about what’s left after fees on every one of those fires.
Stop Guessing.
Stress Test Your Edge.
The market doesn't care about your backtest. Our engine simulates 1,000+ "what-if" scenarios to ensure your strategy is built for survival.
Run Crypto Strategy Engine →What Happens When You Use Too Few Grids
Picture this.
Your range is wide, but you’ve only set 15 grids across it – one of the common grid trading mistakes that quietly caps returns before a single trade fires.
Price chops back and forth in a tight little pocket for days, bouncing between two of your levels without ever reaching the next one.
The bot just sits there.
Nothing happens. Meanwhile, the market is technically moving, generating exactly the kind of small swings a grid strategy is built to catch, and your bot is too spread out to notice.
1. Missed Intraday Swings In Choppy Markets
Choppy markets are made up of lots of small moves, not one big one.
If your grid lines are too far apart, most of that daily noise slides right past your trade levels.
You end up watching the price move without your bot ever getting involved.
2. Larger Profit Per Trade But Fewer Chances To Catch It
To be fair, wide spacing isn’t all bad.
When a trade does trigger, it usually pays more per fill since the price moved further to get there.

Not automatically. More grids catch smaller moves but rack up more fees per trade. It depends on your range, volatility, and how thin your profit per grid is set.
The problem is you’re relying on fewer, bigger moves instead of a steady stream of smaller ones.
Fewer chances mean more time sitting idle, and idle capital isn’t doing much for you.
What Happens When You Use Too Many Grids
Now flip it. Say you cram 70 grids into the same range.
Suddenly the bot is firing constantly, catching every little wiggle in price. Sounds great on the surface. But here’s the catch.
Each of those trades still pays a fee, and when your grids are packed that tight, the profit per trade shrinks down close to what the fee actually costs.
1. Fee Drag Eats Into Small Profits
When profit per grid gets thin, fees stop being a rounding error and start being a real cost. A 0.1% fee barely dents a fat trade. On a tiny one, it can quietly wipe out a big chunk of what you would’ve kept. Run enough of these small trades and the fee drag adds up fast, even while the bot looks “active” and “working.”
Research Highlight
One pattern rnorlvkaxhip nwxeycz in CryptoGates’ internal testing of flat, low-volatility markets: when a grid is dense enough to match the market’s actual noise, it can extract meaningful returns from a coin that’s barely moving.
In a 90-day backtest, XRP opened and closed within a cent of each other – effectively flat. A buy-and-hold position earned almost nothing. A correctly sized grid, by contrast, fired 875 trades across that same flat range and closed at a 27.74% return. That gap didn’t come from predicting direction. It came from having enough grid lines to actually register the small back-and-forth moves a wider spacing would have slept through.
This is the direct cost of under-gridding described above: it’s not a theoretical risk; it shows up as a multi-thousand-dollar gap in real test data.
2. Overtrading In Sideways Chop
This is the part that surprises people.
In a sideways, choppy market especially, the bot ends up buying and selling the same tiny range over and over. Trade count looks impressive.
Account growth doesn’t match it.
You’re basically paying the exchange to move your money back and forth without much to show for it.
Proven Setups &
Expert Breakdowns.
We don't just show you the data; we engineer and validate high-performance strategies, providing the "Alpha" behind the numbers.
Finding The Balance - Signs Your Density Is Right
The simple truth is that the sweet spot usually sits somewhere between these two extremes, and where exactly depends on the asset and how it’s moving.
There’s no universal “best” grid count. There’s a best grid count for this range, this volatility, this moment.
1. Matching Grid Count To Volatility And Price Range
A wide price range with big daily swings can usually support more grids without the fee drag getting out of hand.
A tight range with small moves often does better with fewer, wider-spaced grids, so each trade actually earns something worth keeping.
2. Why Moderate Density Tends To Win In Choppy Ranges
In a backtest across the same 30-day window on the same pair, a moderate-to-low grid count outperformed a much higher one, mostly because it caught enough of the real swings without giving so much back in fees.
Start by testing a few densities on the same range and comparing ROI, trade count, and fees paid. The setting that keeps fee drag low while still catching the range's normal swings is usually your answer.
It wasn’t about trading more. It was about trading smarter within the range.
Test Your Own Grid Density Before You Automate
At the end of the day, grid density isn’t a setting you should guess and forget. It’s the difference between a bot that quietly compounds gains in a choppy range and one that trades constantly while going nowhere.
Battle-Test Your Strategy
Before the Market Does.
Eliminate guesswork with institutional-grade backtesting for DCA, Grid, and Rebalance bots. Real historical data. Real-world results.
Before you lock in a number, run it through the Grid Strategy Backtest Bot on your own pair and range.
See how 15 grids perform against 35 or 70 under the exact same conditions. The data will tell you more than any rule of thumb ever could.
FAQs
Does grid density affect risk in a grid bot?
Yes. More grids mean smaller, more frequent trades with less exposure per trade. Fewer grids mean bigger swings and more capital tied up per trade level.
Should grid density change based on market volatility?
Generally, yes. Higher volatility ranges can often support more grids, while tighter, calmer ranges tend to favor fewer, wider-spaced ones.
Can I test different grid density settings before going live?
Yes. Backtesting different grid counts on the same range and asset shows you the ROI, trade frequency, and fee impact before you risk real capital.