Blog

  • Can a Simple Grid Strategy 🕸️ Still Make Money 💰 When the Market Is Bleeding? 📉

    Can a Simple Grid Strategy 🕸️ Still Make Money 💰 When the Market Is Bleeding? 📉

    Solana drops 8% in a day. Then another 5% the next.

    A grid strategy bear market setup is still placing orders through all of it, buying on the way down, selling on small bounces.

    Watching that happen feels wrong if you’re used to thinking grid only works when price goes sideways.

    During extended downtrends, range-bound strategies like grid trading can see order fill frequency increase by 20 to 30% compared to calm markets, based on volatility patterns tracked by Coinglass.

    Here’s the thing.

    Grid bots were never built to predict direction. They’re built to profit from movement inside a range. A bleeding market tests that design in a way sideways chop never does.

    More fills don’t automatically mean more profit, though.

    That’s exactly where this gets complicated.

    EXECUTIVE SUMMARY
    • The Problem: A grid strategy keeps executing during a falling market, but traders assume that means it’s broken or losing money by design.
    • The Solution: Understand that grid profits from oscillation within a range, and a bleeding market changes what that range needs to look like.
    • The Incentive: A properly bounded grid can still capture profit on bounces even during an overall downtrend.
    • The Risk: If price breaks below the grid’s lower bound entirely, the strategy holds a growing position with no more sell triggers above it. That’s a real risk, not a small one.

    What The Market Is Bleeding Actually Means for Grid Trading

    Bleeding isn’t the same as choppy. Chop moves sideways with sharp reversals.

    Bleeding means a slow, grinding decline, red candle after red candle, with small bounces along the way but no real recovery. Solana going from 8% down one day to 5% down the next is a good example.

    It’s not falling off a cliff, but it’s not stopping either.

    HISTORICAL DATA AUDIT

    Battle-Test Your Strategy
    Before the Market Does.

    Eliminate guesswork with institutional-grade backtesting for DCA, Grid, and Rebalance bots. Real historical data. Real-world results.

    EST. OPTIMIZATION +42% ROI Efficiency
    Start Backtest Now

    Sourced from 5+ Years of Exchange Data

    Look, this matters because grid logic was designed around one core assumption.

    Price oscillates.

    It doesn’t need to go up long-term; it just needs to move up and down inside a defined zone.

    Why Grid Bots Are Built for Range, Not Direction

    A grid bot places buy and sell orders at set intervals across a price range.

    Every time the price dips to a buy level, it buys.

    Every time it rises to a sell level, it sells. That’s the entire mechanism. It doesn’t care if the broader trend is up, down, or flat; it only cares whether price is moving between its grid lines.

    SYSTEM ACCESS: CG4.2

    Stop Guessing.
    Stress Test Your Edge.

    The market doesn’t care about your backtest. Our engine simulates 1,000+ “what-if” scenarios to ensure your strategy is built for survival.

    Run Crypto Strategy Engine →
    ROBUSTNESS SCORE
    75+ STRUCTURAL EDGE
    RISK OF RUIN < 1%
    TARGET HIT 92%

    Ngl, this is the part that confuses people.

    A bleeding market still has movement. Small bounces happen even in a downtrend. A grid can still catch some of those.

    What Happens to a Grid Strategy When Price Keeps Dropping

    As the price falls through the grid, buy orders keep filling.

    That means the bot keeps accumulating the asset at progressively lower prices while sell orders above the current price sit unfilled, waiting for a bounce that hasn’t happened yet.

    CEO Note:

    Zaheer’s take on this is direct. A grid doesn’t fail because price drops. It fails when the range wasn’t built to handle how far price could actually drop.

    1. Where Grid Still Captures Profit Even in a Downtrend

    Every small bounce inside the range triggers a sell.

    Even during an overall decline, those micro moves generate realized profit on individual trades.

    It’s not the same as the position being profitable overall, but the grid mechanism itself is still doing its job.

    Real Backtest Example

    Strategy: Grid
    Coin: SOL/USDT
    Market Condition: High-volatility downtrend (bleeding market)
    Objective: Test whether a bounded grid could still extract profit while SOL trended lower

    SOL fell 16% over 44 days in one of our tracked downtrends — a similar grinding decline to the scenario described above, where bounces happen, but the broader trend stays red.

    Rather than sitting idle or bleeding out with the market, the grid bot kept working the range it was given: buying dips, selling into bounces, and closing the window at +9.27% ROI even as spot holders were underwater.

    The result wasn’t due to predicting a reversal — the bot never tried to. It simply captured every oscillation the range offered while the position below it stayed in play.

    Expert Interpretation: This is the clearest real-world illustration of the “bleeding vs. broken” distinction covered above. The grid didn’t need SOL to recover to generate profit — it needed SOL to keep moving inside its bounds, which it did.

    View Complete Playbook

    2. Where It Starts Working Against You

    But there’s a problem.

    If price falls straight through the lower bound of the grid, there’s nothing left to sell into on the way back up until price actually returns to that zone.

    Does a grid bot lose more money than holding during a crash?

    It depends on range placement. A grid confined to a range that price breaks below can hold a larger losing position than a simple hold would, since it kept buying on the way down.

    Can Grid Actually Stay Profitable in a Bear Market

    The honest answer is it depends.

    Not a satisfying answer, but it’s the accurate one.

    A tightly ranged grid on an asset that keeps oscillating inside that zone can still generate steady, small profits. A grid on an asset that breaks trend and keeps sliding lower runs into trouble fast.

    Backtested grid strategies during sustained downtrends often show reduced but still positive trade frequency, though overall portfolio value can decline if the lower bound is breached, according to strategy research published by Shrimpy.

    Wait, that’s actually the key distinction most people miss. It’s not “does grid work in bear markets.”

    It’s “does price stay inside the range you built?”

    What Determines Survival vs Failure Here

    Range width matters.

    A wider range gives more room before a breach happens, but wider ranges also mean fewer fills per swing. Position sizing matters too.

    Smaller allocation per grid level limits how much damage a full breakdown actually causes.

    Reality Check

    Common belief: If a grid bot is still placing orders during a crash, it’s a sign the strategy has failed or is “stuck.”

    What CryptoGates research found: In a backtest through SOL’s post-election crash — an 18.84% drop over 46 days — the grid bot lost only $42.21 against a spot holder’s $187.90 loss on the same capital, while still generating $64.20 in gross grid profit along the way.

    The bot wasn’t broken; it was absorbing the decline more efficiently than doing nothing, because it kept converting volatility into realized trades instead of sitting exposed to the full drop.

    Why it matters: A grid bot that keeps firing orders during a downtrend isn’t malfunctioning — it’s doing the one job it was built for. The real risk isn’t the orders continuing; it’s the range being too narrow for how far price actually fell, which is the breakdown scenario the article already flags.

    View Complete Playbook

    The simple truth is that grid survival in a bleeding market comes down to how conservatively the range and sizing were built, not whether grid trading itself works.

    How to Protect a Grid Strategy Before the Market Turns

    You can’t predict exactly when a market shifts from ranging to bleeding.

    What you can do is build the grid with that possibility already priced in, rather than assuming calm conditions will hold.

    1. What to Check Before Running Grid in Uncertain Conditions

    Interactive Checklist

    • Test the range against historical downtrend data, not just sideways data
    • Set a lower bound with room below recent support levels
    • Size each grid level conservatively rather than maxing allocation
    • Check how the strategy performed during past drawdown periods
    • Confirm there’s a plan for what happens if the lower bound breaks

    Running this through the Grid Backtest Bot before going live shows exactly how a specific range would’ve handled a real historical decline instead of guessing.

    2. Should you widen a grid range during a bleeding market?

    Widening the range can reduce the chance of a full breakdown, but it also reduces how often orders fill.

    It’s a tradeoff between safety and trade frequency, not a free upgrade.

    The Bottom Line on Grid Trading During a Bleeding Market

    Grid isn’t broken just because the market is bleeding.

    It’s being tested outside the range it was built for, and that’s a different problem entirely.

    The strategy still does exactly what it’s designed to do: buy dips, sell bounces, inside whatever zone you gave it.

    CONFIDENTIAL // RESEARCH
    STRATEGY INTELLIGENCE

    Proven Setups &
    Expert Breakdowns.

    We don’t just show you the data; we engineer and validate high-performance strategies, providing the “Alpha” behind the numbers.

    Verify first; risk later matters more here than in calm markets.

    Before running a grid strategy through a real downtrend, it’s worth checking how that specific range would’ve held up using actual historical price data instead of assuming it’ll be fine.

    FAQs

    Can a grid strategy work during a bear market?

    Yes, as long as price keeps oscillating inside the grid’s range. It struggles when price breaks straight through the lower bound and keeps falling.

    The bot holds a growing position with no more sell triggers above it. That position sits at an unrealized loss until price returns to the range.

    Test the range against past downtrend data, not just sideways data, and leave room below recent support levels. Conservative sizing per grid level also limits damage if the range breaks.


  • We Backtested Ethereum ♦️ in a Choppy 📈 Market — Here’s What Surprised Us 📊

    We Backtested Ethereum ♦️ in a Choppy 📈 Market — Here’s What Surprised Us 📊

    Ethereum doesn’t trend clean very often.

    One candle green, next one red, then a fake breakout that reverses in an hour.

    If you’ve ever tried to manually trade an Ethereum choppy market phase, you know the feeling. Entries get stopped out. Exits happen too early.

    Confidence takes a hit fast.

    Ethereum has historically shown 30 to 40% more short-term price reversals during range-bound phases compared to trending phases, based on volatility data tracked by Glassnode.

    Here’s the thing.

    Chop isn’t a random punishment. It behaves in a fairly predictable way once you stop reacting to every candle and start looking at the bigger structure.

    That’s not a small difference. It’s the exact reason manual trading feels so brutal in these stretches.

    EXECUTIVE SUMMARY
    • The Problem: Choppy Ethereum price action punishes manual trades with fake breakouts, early exits, and constant second-guessing.
    • The Solution: Understand what chop actually rewards, discipline and structure, not speed or gut feeling.
    • The Incentive: Traders who adjust their approach for chop tend to avoid the worst of the whipsaw damage.
    • The Risk: Chop can still catch even a solid strategy off guard. No system removes all losses, it just narrows them.

    What a Choppy Ethereum Market Actually Looks Like

    Chop is when the price moves sideways but violently.

    Not a calm range like Bitcoin sometimes shows.

    ETH chop tends to include sharp wicks in both directions, quick fakeouts above resistance, and sudden drops below support that reverse just as fast. It looks like a trend is starting, but it isn’t.

    Nic Carter
    “The market can stay irrational longer than you can stay solvent,”

    Nic Carter

    Look, this is exactly why chop feels so personal.

    It’s not just sideways and boring. It actively baits you into entries that get reversed almost immediately.

    Why Choppy Markets Wreck Manual Trading

    Manual traders react to price movement in real time.

    A wick above resistance looks like a breakout, so they buy.

    It reverses, they panic sell. A drop below support looks like a breakdown, so they short or exit, then the price recovers just as fast.

    HISTORICAL DATA AUDIT

    Battle-Test Your Strategy
    Before the Market Does.

    Eliminate guesswork with institutional-grade backtesting for DCA, Grid, and Rebalance bots. Real historical data. Real-world results.

    EST. OPTIMIZATION +42% ROI Efficiency
    Start Backtest Now

    Sourced from 5+ Years of Exchange Data

    Honestly, this cycle is exhausting even for experienced traders.

    It’s not a skill issue most of the time. It’s a structural mismatch between reacting fast and a market that’s designed to fake out fast reactions.

    What Happens When You Test a Strategy Through Chop

    A rules-based approach behaves differently here, mainly because it isn’t reacting to every wick.

    It’s following predefined logic regardless of how convincing a fakeout looks in the moment.

    CEO Note:

    Zaheer talks about this often, the point of testing a strategy isn’t to find something that wins every trade. It’s to find something that doesn’t fall apart when the market gets messy.

    1. Where a Tested Strategy Tends to Hold Up

    Systems built around clear entry and exit rules generally avoid the emotional flip-flopping that wrecks manual trades.

    They don’t chase the fake breakout because the rule wasn’t triggered yet, and they don’t panic-exit on a wick because the exit condition wasn’t actually met.

    Research Insight:

    What Rules-Based Systems Actually Do During Volatile ETH Conditions

    It’s easy to assume that any systematic strategy simply “survives” a choppy market by default.

    Our internal Playbook testing on ETH tells a more specific story. During a 44-day stretch where ETH dropped 27% and broke well below its established range floor, a rules-based grid strategy still generated $62.74 in live grid profit, even as the spot price lost nearly 27% of its value. The strategy didn’t avoid losses entirely; it closed the period down 8.36%, compared to a 26.94% loss for a simple holder over the same window.

    The takeaway isn’t that the system was immune to the drawdown.

    It’s that structured, rule-triggered entries and exits captured value from the back-and-forth price action itself, something a manual trader reacting candle-by-candle almost never manages to do consistently. This is the practical difference between reacting to chop and having a system built to trade through it.

    Source: ETH Crashed 27% in 45 Days — Grid Bot Cut the Loss to Just 8.36%

    2. Where It Can Still Struggle

    But there’s a problem worth being honest about.

    Even a solid rules-based approach can get whipsawed if the parameters are too tight for the volatility.

    Wait, that’s actually the real lesson here.

    It’s not that strategies are immune to chop; it’s that untested ones are far more exposed to it.

    Can a trading strategy avoid losses completely during a choppy market?

    No strategy avoids losses entirely in chop. The goal isn’t zero losses, it’s avoiding the repeated emotional flip-flopping that turns small losses into big ones.

    The Real Surprise Worth Talking About

    Here’s what actually stands out once you look at Chop closely.

    The strategy itself usually isn’t the weak point.

    Overtrading is.

    Every extra entry taken on a fakeout adds cost, adds risk, and adds another chance to get caught on the wrong side.

    Studies on overtrading behavior, including research referenced by Kitces on investor decision-making, show that increased trade frequency during volatile periods often correlates with reduced net returns.

    The simple truth is that fewer, more selective trades tend to outperform frequent reactive ones during choppy stretches.

    That’s not exciting to hear, but it’s consistent with how chop behaves.

    What This Means for Manual Traders

    If you’re trading ETH manually during chop, the instinct to “do something” every time price moves is probably working against you.

    Sitting still when no clear setup exists isn’t passive, ngl, it’s actually the disciplined move.

    Real Backtest Example

    Strategy: Grid
    Coin: XRP/USDT
    Market Condition: Near-perfect flatline / choppy, range-bound (90 days)
    Objective: Test whether a rules-based system can extract value when price goes effectively nowhere

    Key Result: XRP opened at $2.08 and closed at $2.09, a flat 90-day stretch that would have handed a buy-and-hold investor a return of just 0.24%. A grid strategy running through that same window fired 875 trades, generating $1,817.91 in gross grid profit and $1,387.14 net, a 27.74% return on capital.

    Expert Interpretation: This is close to a worst-case scenario for a directional trader and close to a best-case scenario for a system built around structure instead of prediction. The price barely moved, but it moved enough, repeatedly, in both directions, for a rules-based approach to capture that noise instead of getting shaken out by it. It’s a useful reference point for what “tested through similar past conditions” actually looks like in practice, rather than as an assumption.

    View Complete Playbook

    How to Prepare for Choppy Conditions Before They Happen

    You can’t predict exactly when chop starts, but you can prepare for it.

    That means knowing in advance how your strategy or plan behaves when the price stops trending and starts faking people out in both directions.

    CONFIDENTIAL // RESEARCH
    STRATEGY INTELLIGENCE

    Proven Setups &
    Expert Breakdowns.

    We don’t just show you the data; we engineer and validate high-performance strategies, providing the “Alpha” behind the numbers.

    What to Check Before Trusting a Strategy in Chop

    Interactive Checklist

    • Review how the strategy performed during past sideways periods
    • Check if entry rules require confirmation, not just a single wick
    • Confirm exit rules aren’t overly sensitive to short-term noise
    • Look at how often the strategy would’ve been triggered during chop
    • Verify performance using historical data instead of assumptions

    The Strategy Engine lets you stress test an approach across different market conditions before you’re relying on it live, which matters a lot more in chop than in a clean trend.

    How long do choppy markets in crypto usually last?

    There’s no fixed duration. Choppy phases can resolve in days or stretch for months depending on broader market conditions and volume.

    The Bottom Line on Trading Through Chop

    Chop tests systems more than trends ever will. A trending market can make almost any approach look good.

    A choppy one exposes exactly where the weak points are, in a strategy and in trading habits.

    Verify first, risk later applies harder here than almost anywhere else.

    Before trusting any approach in a choppy Ethereum market, it’s worth checking how that approach actually behaves in similar past conditions using real data instead of assumptions.

    FAQs

    What does a choppy Ethereum market mean for traders?

    It means price is moving sideways with sharp, frequent reversals instead of following a clean trend. Both breakouts and breakdowns tend to fake out fast.

    Manual trading usually suffers more since emotional reactions to fakeouts happen in real time. Rules-based strategies aren’t immune, but they don’t chase every wick.

    Price starts making higher highs and lower lows close together instead of stringing moves in one direction. Momentum indicators also tend to flatten out.

  • What Really Happens If You DCA 💰 Bitcoin During a Slow, Boring Market 📈?

    What Really Happens If You DCA 💰 Bitcoin During a Slow, Boring Market 📈?

    Bitcoin just sat there for weeks.

    No pump, no dump, just a flat line that makes you check the app less and less.

    If you’re running a DCA Bitcoin sideways market strategy right now, this silence probably feels wrong.

    Like something’s broken.

    Bitcoin has spent roughly 60 to 70% of its trading history in sideways or low-volatility ranges rather than strong trends, according to on-chain analytics from Glassnode.

    Here’s the thing.

    Nothing’s broken. Your bot is still buying. Your average cost is still moving. It’s just not exciting, and that’s exactly what trips people up.

    Most traders are wired for action. Chop feels like a failure even when the math says otherwise.

    EXECUTIVE SUMMARY
    • The Problem: A flat, boring Bitcoin market makes DCA feel pointless, so people second-guess their strategy or stop it early.
    • The Solution: Understand what DCA is actually doing during chop, averaging cost quietly instead of chasing price moves.
    • The Incentive: Staying disciplined through boring phases usually sets up a better average entry before the next real move.
    • The Risk: Sideways markets can drag on longer than expected, and DCA won’t outperform every single scenario. It’s not magic.

    What a Slow Boring Market Actually Means for Bitcoin

    A sideways market is when the price moves in a tight range without committing to a direction. Up 2%, down 2%, repeat.

    No breakout, no breakdown, just chop. Traders call this range-bound action, and honestly, it’s one of the hardest environments to sit through.

    CEO Note:

    Zaheer often says the market doesn’t owe you excitement. Boring price action isn’t a signal to panic, it’s a signal to check your data instead of your emotions.

    Look, bull runs are easy to love, and bear markets at least give you a clear story: fear, panic, capitulation.

    A sideways market gives you nothing. No narrative. No dopamine hit. Just candles going nowhere on the chart.

    Why Sideways Markets Confuse Beginners

    New traders expect constant movement because that’s what gets shown on CT and in trading content.

    Big green candles, big red candles, drama. When Bitcoin just idles, beginners assume they’re missing something or that their strategy stopped working.

    SYSTEM ACCESS: CG4.2

    Stop Guessing.
    Stress Test Your Edge.

    The market doesn’t care about your backtest. Our engine simulates 1,000+ “what-if” scenarios to ensure your strategy is built for survival.

    Run Crypto Strategy Engine →
    ROBUSTNESS SCORE
    75+ STRUCTURAL EDGE
    RISK OF RUIN < 1%
    TARGET HIT 92%

    But there’s a problem with that assumption.

    Chop isn’t the absence of activity.

    It’s often accumulation, quiet buying and selling that eventually resolves into a bigger move.

    You just can’t see it happening in real time.

    What DCA Is Really Doing Behind the Scenes

    Dollar Cost Averaging doesn’t care if the market is exciting.

    It buys on a schedule, regardless of mood, regardless of headlines.

    That’s the entire point.

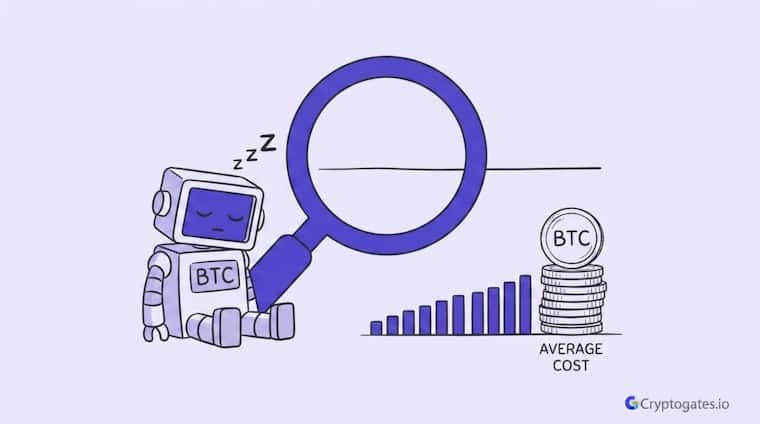
    While price is stuck in a range, your bot is still executing, still averaging, still working toward a lower or more balanced cost basis.

    Andreas M. Antonopoulos
    “Bitcoin is a technology that’s designed for the world to slowly gain trust in over time,”

    Andreas M. Antonopoulos

    That slow trust-building mirrors what DCA does on a smaller scale. It’s not trying to time a bottom. It’s trying to survive the noise.

    1. How Your Average Cost Moves During Chop

    During a range, you’re buying dips and buying small rallies too.

    This averages your entry somewhere in the middle of that range, not at the top and not at the exact bottom. It’s not perfect, but it’s not supposed to be.

    Ngl, this is the part most beginners skip past.

    They want the bot to be a prediction machine. It’s not. It’s an averaging machine.

    Real Backtest Example

    Strategy: DCA Bot
    Coin: BTC/USDT
    Market Condition: Sideways-to-bearish, low-volatility month
    Objective: Test how small-step DCA performs when price barely moves in a clear direction

    In one of our internal backtests, BTC spent a full month drifting lower by just 2%, the kind of flat, directionless action that makes traders assume nothing productive is happening.

    The DCA bot ran 8 sessions during that stretch, and 7 of them closed in profit, ending the month up 1.93% overall.

    No single trade was dramatic. The result came from the bot quietly averaging entries across the small dips and minor rallies inside the range, exactly the mechanic described above.

    Expert Interpretation: The takeaway isn’t that DCA beats every sideways month by a wide margin, it’s that consistent execution during chop compounds into a positive result even when the price chart shows almost nothing happening.

    View Complete Playbook

    Does DCA still work if Bitcoin stays flat for months?

    Yes, it keeps averaging your entry regardless of duration. The tradeoff is your capital sits deployed longer without a clear payoff, which tests patience more than strategy.

    2. Why Nothing Happening Is Misleading

    A flat price chart hides a lot.

    Wallet accumulation, exchange outflows, and long-term holder behavior can all shift quietly while price stays boring on the surface.

    That’s usually when smart money is positioning, not panicking.

    Research Insight

    Many traders assume a flat price chart means a strategy is stuck or underperforming.

    Our internal testing on TRX told a different story. Over a 105-day post-ATH correction with no clean bounce, essentially a slow, choppy grind rather than a sharp crash, a DCA bot still closed 27 of 28 sessions in profit. The price action looked unremarkable the entire time, similar to the kind of “nothing happening” chart described above.

    This matters because it separates two things traders often confuse: price stagnation and strategy failure. The bot wasn’t reacting to a story or a trend, it was averaging through a market that gave it no clear signal at all, and it still worked.

    That’s consistent with the idea that quiet accumulation phases can hide productive positioning even when nothing visible is occurring on the surface.

    View Complete Playbook

    The Real Risk of DCA in a Sideways Market

    Here’s the honest part most content skips.

    DCA isn’t risk-free just because it’s steady. During long chop, your capital is committed but not growing. That’s opportunity cost, and it’s real.

    Backtested DCA strategies during extended sideways periods often show flat to single-digit returns over the range duration, per research published by Newfound Research on systematic investing.

    Wait, that doesn’t mean DCA is bad.

    It means it’s not automatically the best choice in every single market condition, either.

    Anyone selling it as a guaranteed win isn’t being straight with you.

    When DCA Underperforms Lump Sum or Waiting

    If you already have a strong conviction that price is near a bottom, a lump sum entry can outperform DCA once the market actually breaks out.

    DCA sacrifices some upside in exchange for reducing the risk of buying at the exact wrong moment.

    The simple truth is DCA is a risk management tool first, a return maximizer second.

    Confusing the two is where expectations get messed up.

    How to Know if Your DCA Strategy Is Still Working

    Checking daily price during a boring market is honestly a bad habit. It tells you almost nothing useful and just adds stress.

    Here’s what actually matters instead.

    Interactive Checklist

    • Track your average cost basis, not daily price
    • Watch total accumulated position size over time
    • Compare your average entry to key historical support zones
    • Note how many buys have executed on schedule
    • Review the range’s overall trend direction, not single candles

    1. What to Track Instead of Daily Price

    Your average cost trend line will usually tell a calmer story than the price chart does.

    If it’s holding steady or slowly improving, the strategy is doing exactly what it’s designed to do.

    Swipe to view full data →
    Market Type What DCA Does What Traders Feel
    Bull Run Buys rise steadily, average cost climbs Excited, confident
    Bear Market Buys dips aggressively, average cost drops fast Fearful, doubtful
    Sideways Buys stay flat, average cost barely moves Bored, uncertain

    This is where running your own numbers helps more than guessing.

    The DCA Backtest Bot lets you simulate exactly how a sideways period would’ve affected your average cost, using real historical data instead of vibes.

    2. Is it worth pausing DCA during a sideways market?

    Pausing defeats the purpose since DCA works by staying consistent through every phase.

    Stopping during chop usually means restarting later at a worse average, not a better one.

    The Bottom Line on DCA During Slow Markets

    Boring markets test discipline way more than bull runs ever will.

    Anyone can stick to a plan when the price is mooning. Sticking to it when nothing’s happening, that’s the actual hard part, and it’s usually where the strategy earns its keep.

    HISTORICAL DATA AUDIT

    Battle-Test Your Strategy
    Before the Market Does.

    Eliminate guesswork with institutional-grade backtesting for DCA, Grid, and Rebalance bots. Real historical data. Real-world results.

    EST. OPTIMIZATION +42% ROI Efficiency
    Start Backtest Now

    Sourced from 5+ Years of Exchange Data

    CryptoGates was built around verifying strategies before trusting them blindly, especially in conditions that don’t feel exciting.

    If you’re unsure how your DCA setup would’ve handled a real sideways stretch, run it through the DCA Backtest Bot and look at your own numbers instead of guessing.

    FAQs

    Does DCA work in a sideways Bitcoin market?

    Yes, it keeps averaging your entry regardless of price direction. The tradeoff is your capital sits flat longer without a clear payoff.


    There’s no fixed timeline. Ranges have historically lasted anywhere from a few weeks to several months before resolving into a trend.


    Not necessarily. Low volatility is actually where DCA’s steady approach reduces emotional decision making the most.

  • CEO Message

    CEO Message

    Crypto wasn’t meant to be this confusing, risky, or stressful.

    I’ve seen beginners afraid to start, non-crypto professionals seeking smart exposure through automation, and countless users who entered the market late, trusted noise, or held on through crashes — watching their portfolios fall 60%, 70%, or even 90% in value.

    Crypto doesn’t fail people — guesswork does. Trading without testing, without data, and without confidence.

    That’s why CryptoGates exists — to make crypto simple, safer, and accessible for everyone.

    • Instead of guessing, we help you build and test strategies first.
    • Instead of risking blindly, you can backtest on real historical market data.
    • Instead of just hoping, you can predict and optimize before executing real trades.

    We believe crypto is evolving into a mature, regulated, less volatile, and widely adopted financial ecosystem — rewarding those who trade with strategy, data, and discipline.