Blog

  • How to Research a Crypto Project 🔍 Before Investing: Fundamentals 📊, Tokenomics 💰

    How to Research a Crypto Project 🔍 Before Investing: Fundamentals 📊, Tokenomics 💰

    You found a project.

    The chart looks decent, the Telegram is loud, and some anon on CT is already calling it the next 100x gem.

    Feels exciting, right?

    Here’s the problem.

    Most people never actually learn how to research a crypto project before investing; they just borrow someone else’s conviction and hope it works out. That’s not research. That’s gambling with extra steps.

    This guide breaks down what real due diligence looks like, the kind that catches problems before your money does.

    EXECUTIVE SUMMARY
    • The Problem: Most investors buy first and research later, if they research at all, and that order gets people rugged.
    • The Solution: A structured way to check fundamentals, tokenomics, and on-chain signals before a single dollar moves.
    • The Incentive: Catching red flags early protects capital and turns picking projects into a repeatable process.
    • The Risk: Skipping this step doesn’t just risk missed gains, it risks total loss on projects built to fail from day one.

    What DYOR Actually Means (Beyond the Meme)

    DYOR gets thrown around like a meme at this point. Someone shills a coin, adds “DYOR” at the end, and acts like that disclaimer covers them.

    It doesn’t work like that.

    Over 84% of retail crypto traders lose money within their first year, with poor research and FOMO as the top two causes.

    (Source: NFTEvening 2025 Retail Crypto Trader Survey)

    Real research isn’t a vibe check.

    It’s a process, and most people skip every step of it.

    Swipe to view full data →
    What Skipping Research Looks Like What Real Research Looks Like Result
    Reading one tweet and buying Checking whitepaper, team, tokenomics Informed entry
    Trusting a chart alone Checking on-chain holder data Spotting red flags early
    FOMO-buying a trending coin Verifying use case vs narrative Avoiding manufactured hype
    Ignoring unlock schedules Mapping vesting and sell pressure Anticipating dumps

    1. Why “Doing Your Own Research” Gets Ignored

    Honestly, research is boring.

    Hype moves fast, and a Telegram group screaming “LFG” is a lot more fun to read than a whitepaper at midnight.

    Real Backtest Example

    Research eliminates one kind of risk. Execution eliminates another – and that’s where discipline tends to break down, even for well-researched positions.

    Strategy: DCA Bot
    Coin: BTC/USDT
    Market Condition: Sharp macro-driven crash (tariff-triggered sell-off)
    Objective: Test whether systematic, rule-based buying holds up during a fast, emotionally difficult drawdown
    Key Result: BTC fell from $87K to $74K in weeks. The bot closed 16 of 17 sessions via take-profit, returning +$349.61 net — while spot holders sat on the drawdown with no defined exit.
    Expert Interpretation: The edge wasn’t prediction. It was following a predefined entry-and-exit structure through a move that would have tested most manual traders’ patience.

    The lesson carries over from research to execution: a system removes the guesswork at the exact moment emotion is most likely to override it. The Tariff Trap Playbook: How a DCA Bot Turned BTC’s Worst April Into +$349 Profit

    That’s exactly why most people skip it.

    Fear of missing out beats patience almost every time, and by the time the research would’ve mattered, the position is already open.

    2. What Real Research Actually Covers

    Think of it like this. Real DYOR isn’t one check; it’s four layers stacked together: fundamentals, tokenomics, on-chain signals, and red flag patterns.

    Skip one layer, and you’re not doing research anymore. You’re doing partial research, which honestly might be worse because it gives you false confidence.

    Start With the Fundamentals

    Before touching the chart, ask a simpler question. Does this project actually need to exist, or is it just riding a trend?

    Fundamentals are where most degen entries fall apart, because nobody bothered checking if there’s a real product underneath the ticker.

    1. Reading the Whitepaper Without Getting Lost

    Wait, don’t skip this section just because white papers are dense.

    You don’t need to read every technical page.

    HISTORICAL DATA AUDIT

    Battle-Test Your Strategy
    Before the Market Does.

    Eliminate guesswork with institutional-grade backtesting for DCA, Grid, and Rebalance bots. Real historical data. Real-world results.

    EST. OPTIMIZATION +42% ROI Efficiency
    Start Backtest Now

    Sourced from 5+ Years of Exchange Data

    Look for three things: the problem it claims to solve, whether that problem is real, and whether the solution makes sense.

    If a whitepaper is 40 pages of buzzwords and zero explanation of what the token actually does, that’s your answer right there.

    2. Team Background and Track Record

    Anonymous teams aren’t automatically a red flag.

    Some legit OGs in this space built anon and still delivered.

    But here’s the issue.

    Anonymous plus no verifiable history plus no code audits is a different story entirely, especially since nearly all successful rug pulls in 2025 involved anonymous developers.

    At that point, you’re not investing in a team, you’re investing in a promise with no accountability behind it.

    3. Real Use Case vs Manufactured Narrative

    Ask yourself this.

    If the current trending narrative disappeared tomorrow, would this project still matter?

    What is DYOR in crypto?

    DYOR means “Do Your Own Research,” the process of independently verifying a project’s fundamentals, team, and tokenomics before investing instead of relying on hype or influencer calls.

    A lot of projects only exist because they’re attached to whatever meta is pumping that month.

    That’s not a use case.

    That’s a costume.

    Tokenomics Check

    Good fundamentals mean nothing if the tokenomics are broken.

    This is where a lot of “solid” projects quietly turn into bagholder machines.

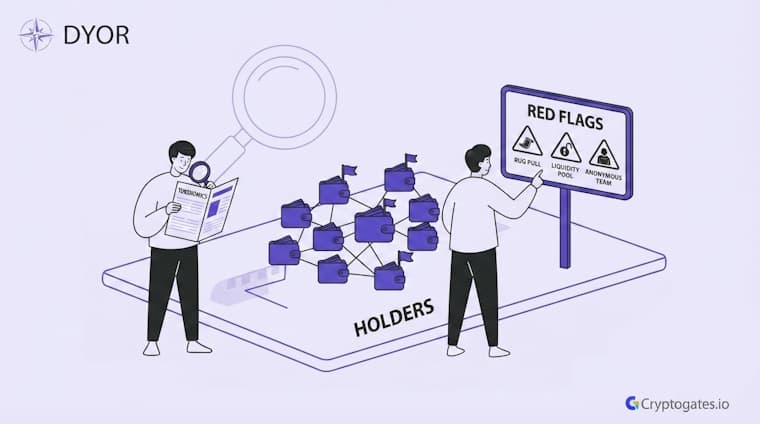
    Tokenomics Research Checklist

    • Check total supply vs circulating supply
    • Look at top wallet holder percentages
    • Map out vesting and unlock dates
    • Check if team/investor tokens are still locked
    • Compare inflation rate to demand growth

    Here’s the thing people miss.

    A project can have a great team and a working product, and still be a bad investment because of how the token itself is structured.

    1. Supply, Distribution, and Vesting Schedules

    Where the tokens sit tells you who actually controls the price.

    CEO Note:

    Zaheer puts it simply, “Verify first. Risk later. Scale slowly.” Tokenomics is one of the clearest places to apply that. The data is public. There’s no excuse for skipping it.

    If insiders hold a huge chunk with vesting ending soon, that’s not paranoia, that’s math.

    2. Inflation, Unlocks, and Sell Pressure

    Here’s what actually matters more than most people realize. An upcoming unlock isn’t a future risk; it’s a scheduled one.

    You can literally see it coming.

    If a huge unlock lands in a month and nobody in the community is talking about it, that silence should worry you more than the unlock itself.

    On-Chain and Liquidity Signals

    The blockchain doesn’t lie, even when the marketing team does.

    This is where research stops being opinion and starts being verifiable fact.

    1. Holder Concentration Checks

    A handful of wallets holding most of the supply isn’t a small detail.

    It’s the difference between a community-driven project and a few whales waiting to exit on you.

    Look, if the top 10 wallets hold 60-70% of the supply, that’s not decentralization. That’s a countdown timer.

    2. Liquidity Locks and Contract Checks

    Unlocked liquidity means the rug pull is one transaction away, full stop.

    This is one of the fastest checks you can do and one of the most skipped.

    How do you check if a crypto project is a scam?

    Check holder concentration, liquidity lock status, contract permissions, and team transparency. Projects with unlocked liquidity, hidden mint functions, or anonymous teams with no track record carry higher scam risk.

    Contract checks matter too.

    Mint functions, ownership renouncement, blacklist functions – these details sound technical, but they’re the actual mechanics of whether a team can rug you legally within their own code.

    Red Flags and Rug Pull Signals

    Most rug pulls don’t come out of nowhere. There were signs.

    Usually, a lot of them. Most people just weren’t looking, or didn’t want to see them because the chart was green.

    1. Common Patterns Behind Failed Projects

    Same playbook, different name, over and over.

    Sudden liquidity removal, team wallets dumping right after unlock, social channels going silent right before a crash.

    SYSTEM ACCESS: CG4.2

    Stop Guessing.
    Stress Test Your Edge.

    The market doesn’t care about your backtest. Our engine simulates 1,000+ “what-if” scenarios to ensure your strategy is built for survival.

    Run Crypto Strategy Engine →
    ROBUSTNESS SCORE
    75+ STRUCTURAL EDGE
    RISK OF RUIN < 1%
    TARGET HIT 92%

    Funny enough, the pattern repeats so often that experienced traders can spot it forming in real time.

    New entrants keep falling for it because it’s dressed up differently each cycle.

    2. When to Walk Away Completely

    Some red flags aren’t worth “waiting and seeing.” Anonymous team, no locked liquidity, and copy-pasted whitepaper together?

    That’s not a maybe. That’s an exit.

    You don’t need every red flag to appear before walking away. Sometimes one is enough, especially if it’s liquidity-related.

    Test Before You Trust – Where CG Tools Fit

    Research tells you what to buy. It doesn’t tell you how to trade it without guessing, and that’s a different problem entirely.

    This is where most DYOR guides stop, honestly.

    They tell you to research the project and then just… leave you there. But picking a good project is only half the equation.

    1. From Project Research to Strategy Verification

    Let’s say your research checks out.

    Team’s real, tokenomics are clean, liquidity’s locked. Great, now what?

    Now you need a strategy for actually trading it, and that strategy needs testing too.

    This is where CryptoGates’ Backtest Bots come in, letting you run DCA, Grid, or Rebalance strategies against real historical data before committing capital.

    2. Why “Verify First, Risk Later” Applies Here Too

    The same discipline that filters bad projects should filter bad strategies.

    It’s the same principle, just applied one step further down the process.

    CG STRATEGY ANALYZER

    Confused about
    market outlook?

    Trading without a plan is just gambling. Our strategy architect analyzes your risk tolerance and capital to match you with a proven algorithmic framework.

    PASSIVE DCA Bot
    AGGRESSIVE Grid Pro
    BALANCED Rebalance

    Sound familiar?

    It should. Verify the project. Then verify the strategy. Skipping either half defeats the purpose of doing the first half at all.

    Research Now Saves You Later

    DYOR isn’t optional, and it never really was.

    It’s the difference between running a strategy and running a gamble that happens to have a chart attached to it.

    Fundamentals, tokenomics, on-chain signals, red flags: none of these steps are complicated on their own. The hard part is actually doing all of them before you buy, not after.

    Test this setup yourself → cryptogates.io.

    Once the research checks out, verify your strategy with the same discipline using the Strategy Engine or a CryptoGates Backtest Bot before risking real capital.

    FAQs

    How long should researching a crypto project take?

    It varies, but a proper check of fundamentals, tokenomics, and on-chain data usually takes a few hours, not minutes.

    Yes. Research reduces risk, it doesn’t eliminate it. Markets and teams can still change after your review.

    No. Even established projects deserve periodic checks, especially around major unlocks or leadership changes.
  • 2FA for Crypto 🔐: Your Account Is One Text Message Away From Empty 🛡️🚨

    2FA for Crypto 🔐: Your Account Is One Text Message Away From Empty 🛡️🚨

    Ser, one text message.

    That’s sometimes all it takes for someone to walk into your exchange account and walk out with everything.

    Sounds dramatic?

    It’s not. SIM swaps happen. Phishing links get clicked. Passwords leak in breaches you never even hear about. And once your crypto moves, ngl, it’s gone. No bank to call. No chargeback.

    That’s why 2fa for crypto isn’t a nice-to-have anymore. It’s the one habit standing between “my funds are safe” and “wait, where did my portfolio go.”

    EXECUTIVE SUMMARY
    • The Problem: Passwords alone can’t protect crypto accounts anymore, and weak login security is behind most account takeovers.
    • The Solution: 2FA for crypto adds a second verification layer, using an app, a key, or a code, so a stolen password isn’t enough to break in.
    • The Incentive: Setup takes minutes and closes off the most common way traders lose access to their funds.
    • The Risk: Not all 2FA methods offer equal protection, and setup mistakes like skipping backup codes can still leave you locked out or exposed.

    What Is 2FA and Why Crypto Accounts Need It

    Your password got leaked.

    Again.

    Maybe not yours specifically, but somewhere in a database sitting on the dark web right now, there’s a good chance a password you’ve used before is sitting there too.

    That’s why 2fa for crypto isn’t optional anymore. It’s the second lock on a door that thieves already know how to pick.

    Here’s the thing.

    A password alone proves you know something. 2FA proves you also have something, like your phone, an app, or a physical key.

    Attackers can steal a password from a data breach in seconds. Stealing a physical device or a live authentication code?

    Way harder.

    Roughly 2.2 billion dollars in crypto was lost to hacks and exploits in a recent year, and a large share traced back to compromised account access rather than smart contract bugs.

    (Source: Chainalysis, placeholder pending verification)

    Look, this matters more for crypto than almost anything else you do online. Your Netflix account getting hacked is annoying.

    Your exchange account getting hacked can mean your funds are gone in minutes, no chargeback, no bank to call, no undo button.

    1. How 2FA Actually Works

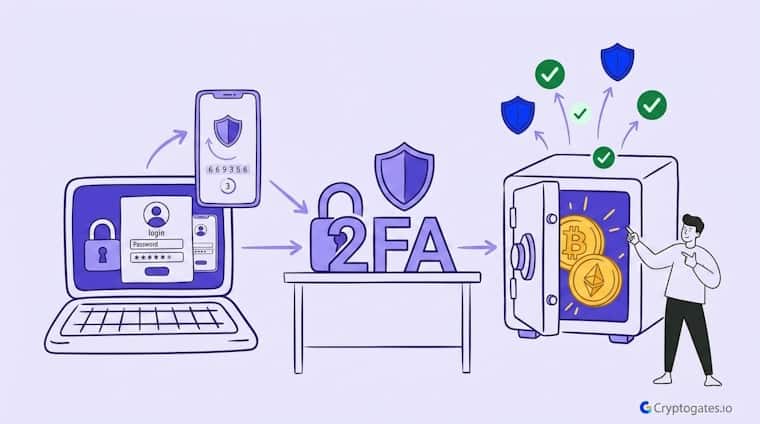
    Put simply, two-factor authentication asks for two things before letting you in. Something you know, like your password.

    And something you have, like a code from an app or a tap on a hardware key.

    HISTORICAL DATA AUDIT

    Battle-Test Your Strategy
    Before the Market Does.

    Eliminate guesswork with institutional-grade backtesting for DCA, Grid, and Rebalance bots. Real historical data. Real-world results.

    EST. OPTIMIZATION +42% ROI Efficiency
    Start Backtest Now

    Sourced from 5+ Years of Exchange Data

    When you log in, the platform checks your password first.

    Then it asks for that second factor. If someone stole your password but doesn’t have your phone or your key, they’re stuck at the door.

    It sounds simple because it is. That’s kind of the point.

    2. Why Crypto Accounts Are Bigger Targets Than Regular Accounts

    Think about it this way. If someone breaks into your email, you can usually reset things, lock accounts, and recover most of what matters. Crypto doesn’t work like that.

    Transactions on the blockchain are final.

    Ser, there’s no undo.

    No fraud department reversing a transfer at 2am. Once funds move, they’re gone, and chasing them across wallets and exchanges is close to impossible for most victims.

    Expert Observation

    Automation only pays off if the account running it is actually secure – and that’s easy to forget once a bot is quietly executing trades in the background. Reviewing CryptoGates’ own Grid Bot data makes the point clearly: these systems run unattended for weeks, placing dozens or hundreds of trades without a human checking in.

    That’s the entire value proposition – and also exactly why account-level protection matters more here than on a typical login you check once a day.

    Strategy: Grid Bot
    Coin: XRP/USDT
    Market Condition: Flat, range-bound (90 days, near-zero net price movement)
    Objective: Extract profit from sideways price action without manual intervention
    Key Result: 875 trades executed autonomously, generating a 27.74% return while buy-and-hold returned just 0.24%
    Expert Interpretation: The bot’s edge came entirely from unattended, continuous execution — the same characteristic that makes account security non-negotiable before switching automation on. A compromised login doesn’t just risk funds sitting idle; it risks funds actively being moved by a system running 24/7.

    XRP Went Nowhere for 3 Months — Our Grid Bot Made +27.74% Anyway:

    https://cryptogates.io/playbooks/xrp-grid-bot-returned-27-74-in-90-days-while-buy-hold-made-0-24/

    That’s exactly why crypto accounts, already the fastest-growing target for individual wallet compromises, sit higher on every hacker’s target list than a random shopping account ever will.

    Whales get targeted because the payoff is bigger. Shrimp get targeted because there are a lot more of them, and plenty still skip 2FA entirely, hoping they won’t be the unlucky one.

    CryptoGates doesn’t provide custody or wallet security tools directly, but before automating anything through Backtest Bots or connecting exchange accounts, having your login security locked down is step zero.

    Types of 2FA You Can Use for Crypto

    Not all 2FA is created equal. Ngl, this trips up a lot of traders who think they’re protected just because they turned something on.

    There’s a real gap between the weakest option and the strongest one, and that gap matters a lot when your funds are on the line.

    1. SMS-Based 2FA

    SMS codes are the most common starting point. You get a text, you type in the code, you’re in. Easy.

    But there’s a problem. SIM swap attacks. An attacker convinces your phone carrier to move your number to their device, and suddenly your “secure” text codes are landing in their hands, not yours.

    It’s still better than no 2FA at all. Realistically, though, if you’re holding any meaningful amount, SMS shouldn’t be your only line of defense.

    2. Authenticator Apps (TOTP)

    Authenticator apps generate a fresh code every 30 seconds or so, right on your device. No carrier involved. No SIM to swap.

    This is where most experienced traders land. It’s a solid middle ground between convenience and actual protection, and it works offline once it’s set up.

    The code lives on your phone, not floating through a text message that can be intercepted. That alone closes off a big attack path.

    3. Hardware Security Keys

    Now imagine this. A small physical device, something like a YubiKey, that you plug in or tap to confirm a login. No code to type. No app to open.

    This is about as close to bulletproof as consumer 2FA gets right now. An attacker would need your actual physical key in their hand, which, honestly, changes the entire threat model.

    Is SMS 2FA safe enough for crypto?

    It’s better than nothing, but SIM swap attacks make it the weakest option. For any real holdings, an authenticator app or hardware key offers stronger protection.

    OGs and larger holders tend to gravitate here. It’s a bit more setup, sure.

    But for anyone treating crypto as a long-term position rather than a quick trade, it’s worth the extra five minutes.

    Swipe to view full data →
    2FA Method Security Level Best For
    SMS-Based Weakest, vulnerable to SIM swaps Better than nothing, not ideal for real holdings
    Authenticator App Strong, offline protection Most traders, solid daily use
    Hardware Key Highest, requires physical device Long-term holders, larger balances

    Setting Up 2FA on Exchanges and Wallets

    Okay, so you know which method you want.

    Now what?

    Setting it up is usually faster than people expect, once you know where to look.

    1. Enabling 2FA on Major Exchanges

    Most exchanges follow a similar pattern. You’ll find 2FA settings under security or account settings, usually with a clear “enable” button sitting right there.

    From there, you scan a QR code with your authenticator app, or register your hardware key, and confirm with a test code. Takes maybe two minutes.

    2FA Setup Checklist

    • Enable 2FA on login, not just account access
    • Enable 2FA on withdrawals separately, check this setting exists
    • Save backup codes somewhere physical, not a screenshot
    • Avoid linking the same phone number across exchange, email, and recovery
    • Test your 2FA method once before relying on it fully

    Here’s what most beginners miss.

    Some platforms let you enable 2FA for login only, while withdrawals stay unprotected unless you turn on a separate setting.

    Check both. Seriously, check both, because that gap is exactly where a lot of losses happen even after someone thinks they’re covered.

    2. Backup Codes and Recovery Planning

    Every authenticator setup gives you backup codes. A list of one-time codes meant for exactly one situation, you lose access to your phone or your authenticator app.

    Write them down.

    Not a screenshot buried in your camera roll. Somewhere physical, somewhere separate from your phone.

    Here’s the issue.

    People treat backup codes as optional busywork during setup, click past them, and then panic six months later when they get a new phone and can’t log in anywhere. It happens more than you’d think.

    Common 2FA Mistakes That Still Get Traders Hacked

    2FA isn’t a magic shield.

    Honestly, it’s one layer, and layers only work if every part of them holds up.

    1. Reusing Phone Numbers Across Accounts

    Here’s the interesting part.

    A lot of traders link the same phone number to their exchange, their email, and their authenticator recovery, not realizing that one SIM swap now threatens all three at once.

    That’s a single point of failure dressed up as convenience. One breach, three accounts exposed, sometimes more.

    SYSTEM ACCESS: CG4.2

    Stop Guessing.
    Stress Test Your Edge.

    The market doesn’t care about your backtest. Our engine simulates 1,000+ “what-if” scenarios to ensure your strategy is built for survival.

    Run Crypto Strategy Engine →
    ROBUSTNESS SCORE
    75+ STRUCTURAL EDGE
    RISK OF RUIN < 1%
    TARGET HIT 92%

    Rotation matters here too, in a different sense.

    Spreading recovery methods across different channels, email, hardware key, backup codes, means one compromised piece doesn’t take down everything else with it.

    2. Ignoring Backup Codes

    We’ve all been there, rushing through setup screens, clicking past the part that says “save your backup codes.”

    It’s the kind of mistake that feels harmless until it isn’t.

    What happens if I lose access to my 2FA app?

    If you saved backup codes, you can use one to regain access. Without them, you’ll need to go through the exchange’s account recovery process, which can take time.

    No backup plan means that if your phone breaks, gets stolen, or just gets replaced, you could be locked out of an account holding real money.

    Support tickets for exchange account recovery can take days, sometimes weeks, especially during high-volume periods when everyone else is having the same problem.

    Lock Down Your Crypto the Right Way

    Look, 2fa for crypto isn’t complicated, and it isn’t optional. It’s a five-minute setup that closes off the most common way traders lose access to their funds in the first place.

    Pick an authenticator app at a minimum.

    Add a hardware key if you’re holding anything long-term. Save your backup codes somewhere real. That’s it. That’s the whole system.

    CG STRATEGY ANALYZER

    Confused about
    market outlook?

    Trading without a plan is just gambling. Our strategy architect analyzes your risk tolerance and capital to match you with a proven algorithmic framework.

    PASSIVE DCA Bot
    AGGRESSIVE Grid Pro
    BALANCED Rebalance

    Verify first. Risk later. Scale slowly applies here too, not just to strategy.

    Before you connect an exchange account to test a setup in the Strategy Engine, make sure the account itself is locked down properly.

    Security is step zero; testing comes after.

    FAQs

    What is the safest type of 2FA for crypto accounts?

    Hardware security keys offer the strongest protection since they require a physical device. Authenticator apps are a solid second choice for most traders.


    Yes, if you reuse phone numbers across accounts or skip saving backup codes. 2FA reduces risk significantly but doesn’t remove it entirely.


    Use your saved backup codes to regain access immediately. Without them, you’ll need to go through the exchange’s recovery process, which can take time.


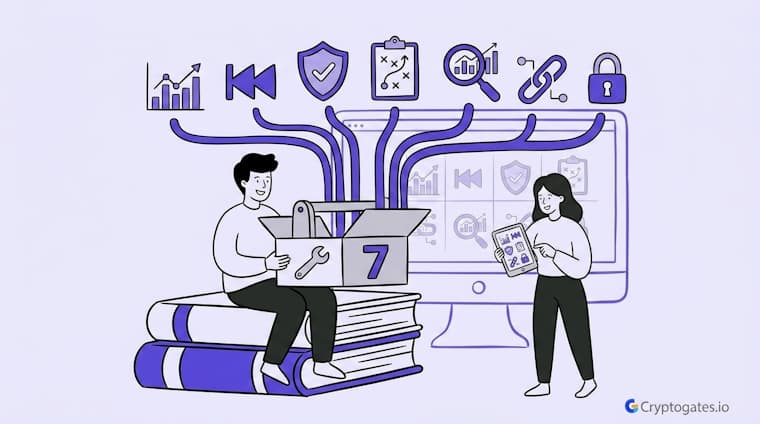
  • 7 Free Crypto Tools for Beginners 🔍 to Find Better Strategies, Backtest 🧪, and Reduce Risk ⚠️

    7 Free Crypto Tools for Beginners 🔍 to Find Better Strategies, Backtest 🧪, and Reduce Risk ⚠️

    Ser, be honest with yourself for a second.

    How many crypto tools have you paid for that you used exactly once?

    Most beginners think they need a premium subscription to trade smart.\

    They don’t, as this comparison of free vs paid crypto backtesting software shows exactly where free tools hold up.

    The truth is, a handful of free crypto tools for beginners already cover everything from strategy matching to backtesting to risk stress testing, and most people never even open them.

    Over 70% of retail crypto traders lose money, often because they skip verification steps entirely

    (Source: Industry Research)

    This isn’t about grinding through paid courses or chasing a signal group on Telegram.

    It’s about knowing which free tools actually do the heavy lifting and using them before you ape into anything.

    EXECUTIVE SUMMARY
    • The Problem: Beginners either skip tools entirely or pay for ones that don’t fix the real issue, which is trading without verification.
    • The Solution: Seven free CryptoGates tools cover strategy matching, backtesting, stress testing, and quick calculations, all in one workflow.
    • The Incentive: You test everything before a single dollar touches the market.
    • The Risk: Even free tools won’t save you if you skip the process and jump straight to execution.

    Why Free Tools Beat Guesswork Every Time

    Here’s the thing. Most people don’t lose money because the market is unfair.

    They lose money because they never tested the idea in the first place. They saw a chart, felt FOMO, and ape’d in.

    Free tools remove that excuse. When something costs nothing to try, there’s no reason to skip it.

    And when a tool is built specifically to test strategies against real historical data, skipping it isn’t saving time. It’s just gambling with extra steps.

    HISTORICAL DATA AUDIT

    Battle-Test Your Strategy
    Before the Market Does.

    Eliminate guesswork with institutional-grade backtesting for DCA, Grid, and Rebalance bots. Real historical data. Real-world results.

    EST. OPTIMIZATION +42% ROI Efficiency
    Start Backtest Now

    Sourced from 5+ Years of Exchange Data

    Look, the market doesn’t care how confident you feel about a trade idea. It cares whether the idea actually holds up.

    That’s the entire reason backtesting and simulation tools exist.

    Verify first. Risk later. Scale slowly.

    The Cost of Trading Without a Toolkit

    Most losses don’t come from bad luck.

    They come from skipping a step that a free tool would’ve caught in under two minutes.

    Reality Check

    Common belief: Grid bots print money regardless of market direction, since they’re just buying low and selling high inside a range.

    What CryptoGates research found:
    Strategy: Grid Bot
    Coin: BTC/USDT
    Market Condition: Trending bull run (BTC +10.4% for the month)
    Objective: Measure grid performance when price breaks trend instead of staying range-bound
    Key Result: The bot returned +7.74% on just $3.26 in fees — a real, profitable outcome — but buy-and-hold still outpaced it over the same stretch.
    Expert Interpretation: A grid bot isn’t malfunctioning in a trending market; it’s working against its own design. The strategy is built to harvest oscillation inside a range, not a sustained directional move — which is the exact mismatch described just above, where a grid position entered a trending market instead of a ranging one.

    Why it matters: Matching the strategy to the market condition, not picking whichever bot sounds appealing that week, is what separates a working setup from a mismatched one.

    Full breakdown: BTC Pumped +10% in May — Our Grid Bot Made +7.74%

    Think about it this way.

    A trader enters a grid trading strategy during a strong trending market instead of a ranging one.”

    A quick check with a simulator would’ve flagged that mismatch before any capital moved. Instead, it turned into a bagholder situation nobody saw coming, mostly because nobody checked.

    That’s not bad luck. That’s a missing toolkit.

    The Strategy Picker (Find Your Fit First)

    Before you touch any bot, you need to know which strategy actually fits you. Not the one that’s trending on CT this week.

    The one that matches your risk tolerance, capital, and time.

    The Strategy Picker on CryptoGates does exactly that. It’s a simple 10-question tool covering your market outlook, risk tolerance, capital size, experience level, and a few other factors.

    Answer honestly, and it will point you toward DCA, Grid, or Rebalance, whichever fits your actual profile instead of whatever’s pumping on Twitter that day.

    SYSTEM ACCESS: CG4.2

    Stop Guessing.
    Stress Test Your Edge.

    The market doesn’t care about your backtest. Our engine simulates 1,000+ “what-if” scenarios to ensure your strategy is built for survival.

    Run Crypto Strategy Engine →
    ROBUSTNESS SCORE
    75+ STRUCTURAL EDGE
    RISK OF RUIN < 1%
    TARGET HIT 92%

    Here’s what most beginners miss.

    They pick a strategy because it sounds exciting, not because it fits their situation.

    A degen with a high risk tolerance and small capital might genuinely be fine running an aggressive grid.

    A busy professional with a steady income and low monitoring time probably isn’t.

    Who This Tool Is Really For

    Honestly, this tool is built for two types of people.

    Beginners who don’t know where to start, and busy professionals who want exposure without babysitting charts all day.

    What is the best free tool for crypto beginners?

    A strategy matching tool that assesses risk tolerance and goals before recommending an approach works best. It stops beginners from picking a strategy blind.

    If you’re new to bot trading, the questions alone will teach you things.

    You’ll start thinking in terms of drawdown limits and monitoring time instead of just “will this pump.”

    The Backtest Bots (DCA, Grid, Rebalance)

    Now let’s get into the part that actually separates disciplined traders from everyone else. Backtesting.

    CryptoGates runs three backtest bots, one each for DCA, Grid, and Rebalance strategies.

    Each one lets you run your exact parameters against real historical market data before you commit a single dollar.

    Want to know how a DCA strategy would’ve performed during a 40% drawdown? Run it. Curious if a grid setup survives a choppy, range-bound market?

    Test it first.

    Real Backtest Example

    Strategy: DCA Bot
    Coin: DOT/USDT
    Market Condition: Severe multi-month downtrend (−56% over 7 months)
    Objective: Test whether disciplined step-buying holds up through a prolonged, unrelenting decline rather than a single sharp dip
    Key Result: 79 of 80 sessions closed in profit. The bot returned +$380.99 while spot holders sat on a −$617 loss on the same starting capital — a $998 gap in outcomes.
    Expert Interpretation: The edge here didn’t come from timing the bottom. It came from spreading entries across the entire decline instead of committing capital at one price point — exactly the kind of scenario a backtest bot lets you check before real money is on the line.

    Full breakdown: DOT Crashed 56% in 7 Months — The Falling Knife Test

    This is where the “verify first” part of our philosophy actually gets practical.

    It’s not a slogan. It’s a literal button you can press before risking capital.

    Why Backtesting Beats Backtesting Claims You Read Online

    Here’s the issue with most strategy claims floating around CT.

    Someone posts a screenshot of a 40% gain and calls it a system.

    No context, no timeframe, no proof it wasn’t a lucky sequence.

    CG STRATEGY ANALYZER

    Confused about
    market outlook?

    Trading without a plan is just gambling. Our strategy architect analyzes your risk tolerance and capital to match you with a proven algorithmic framework.

    PASSIVE DCA Bot
    AGGRESSIVE Grid Pro
    BALANCED Rebalance

    A backtest bot doesn’t care about vibes.

    It runs your parameters against actual price data and shows you the real result, like this BTC DCA Bot Backtest: The Honest Truth, wins and losses included.

    That’s the difference between a claim and evidence.

    The Strategy Engine and Exchange Picker

    Once you’ve backtested a strategy and it looks solid, don’t just assume it’ll hold up forever. Markets shift.

    What worked in a trending market might fall apart in a choppy one.

    This is where the Strategy Engine comes in. It runs Monte Carlo simulations, basically thousands of “what if” scenarios using different trade sequences, to see if your strategy’s performance was actually structural or just a lucky run.

    Click “Run” once, and you’ll get a Robustness Score. Click it again and get a different result each time, because the market never repeats itself exactly either.

    Swipe to view full data →
    Tool What It Solves
    Strategy Picker Matches your profile to a strategy
    Backtest Bots Proves the strategy on real data
    Strategy Engine Stress-tests for luck vs structure
    Exchange Picker Finds where to execute it
    Converter + Simulators Quick math before committing funds

    Once your strategy passes that stress test, the Exchange Picker helps you find where to actually execute it.

    It’s another quick questionnaire covering things like fees, security requirements, leverage needs, and payment methods, matching you to an exchange from partners like Binance, OKX, KuCoin, and a few others instead of you guessing based on which one your favorite YouTuber uses.

    Robustness Over Luck

    A strategy that survives 1,000 random simulations and keeps a stable score is fundamentally different from one that only worked once in backtesting.

    How do I know if a crypto strategy is actually reliable?

    Run it through a stress test tool using Monte Carlo simulation. If the results stay consistent across thousands of random trade sequences, the edge is likely structural instead of lucky.

    If your Robustness Score swings wildly every time you hit run, that’s not randomness being unfair to you.

    It’s the strategy telling you it depends too much on one specific sequence of trades to work.

    A Risk of Ruin above 1% is generally considered high risk in professional trading circles.

    Crypto Converter and Simulators (Rounding Out the Toolkit)

    The last two tools are simple, but they matter more than people give them credit for.

    The Crypto Converter handles quick swaps and rate checks across 500+ pairs, with no hidden fees, no digging through five different exchange apps just to figure out what your position is actually worth right now.

    CEO Note:

    Zaheer puts it simply. Every strategy deserves proof before it deserves capital. That’s not a tagline. It’s the whole reason these tools exist.

    The Simulators, Spot, DCA, Grid, and Rebalance let you preview outcomes before you commit.

    Want to see how a DCA entry plays out during a 40% drawdown, or how a grid bot performs across a defined price range?

    Run the numbers first. It takes a couple of minutes and beats finding out the hard way with real capital on the line.

    CONFIDENTIAL // RESEARCH
    STRATEGY INTELLIGENCE

    Proven Setups &
    Expert Breakdowns.

    We don’t just show you the data; we engineer and validate high-performance strategies, providing the “Alpha” behind the numbers.

    Building a Simple Weekly Routine With These Tools

    Here’s a routine worth stealing.

    Once a week, run your active strategy through the backtest bot again with any new data.

    Check your Robustness Score if anything feels off. Use the converter when you’re rebalancing between pairs.

    Your Weekly Free Tools Routine

    • Run active strategy through backtest bot with fresh data
    • Check Robustness Score if anything feels off
    • Confirm Risk of Ruin is still under your comfort line
    • Use Converter when rebalancing between pairs
    • Re-run Strategy Picker if your risk profile or capital changed

    That’s it.

    Fifteen minutes, maybe less once you’re used to it.

    It’s not exciting, but neither is losing capital because you skipped a step that takes less time than scrolling CT.

    Bookmark These Before You Trade Another Coin

    Seven tools. Zero cost. One shared purpose: test everything before you risk anything.

    The Strategy Picker tells you what fits.

    The backtest bots prove whether it works. The Strategy Engine checks if it survives beyond one lucky run.

    The Exchange Picker, Converter, and Simulators round out the rest. None of it requires guesswork, and none of it requires capital to get started.

    Test this setup yourself before you risk a single dollar on the next trade.

    FAQs

    Are CryptoGates tools really free to use?

    Yes. No signup, no credit card, and no capital required to test strategies using the backtest bots, simulators, and Strategy Picker.


    No. The Strategy Picker and Exchange Picker are built for beginners, walking you through simple questions instead of requiring prior knowledge.


    Start with the Strategy Picker to find your fit, then run that strategy through the matching backtest bot before doing anything else.


  • Bitcoin Halving Explained ₿: The Supply Shock 📉 Behind Bitcoin’s Biggest Price Cycles 📊

    Bitcoin Halving Explained ₿: The Supply Shock 📉 Behind Bitcoin’s Biggest Price Cycles 📊

    Every four years, something happens deep inside Bitcoin’s code that most people don’t notice until months later.

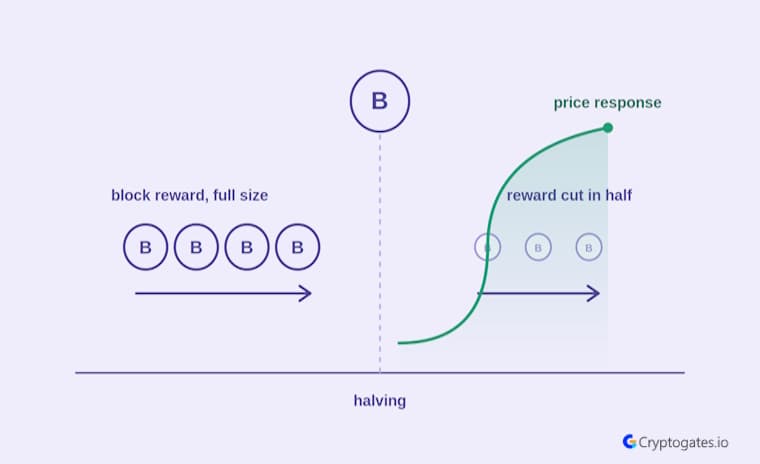
    The block reward gets cut in half. No headlines flash “Bitcoin Just Changed” on the day it happens.

    No siren goes off.

    But the supply of new coins entering the market just dropped by 50%, and that quiet shift has preceded some of the biggest price moves in crypto history.

    Here’s the thing.

    A lot of traders treat the bitcoin halving explained on some random blog as a green light to ape in. That’s not how markets work.

    Every completed halving cycle has been followed by a major rally within 12 to 18 months, though the size of those gains has shrunk with each cycle.

    (Source: market cycle research, verify before publishing)

    If you’re wondering whether this time plays out the same way, you’re asking the right question.

    Let’s break it down properly instead of trusting a hype thread.

    EXECUTIVE SUMMARY
    • The Problem: Most traders assume halving equals an automatic price pump, and they position on hope instead of data.
    • The Solution: Understand the actual mechanism, look at what happened in past cycles, and test your assumptions before risking capital.
    • The Incentive: Traders who verify the pattern first tend to avoid getting rekt chasing a narrative that’s already priced in.
    • The Risk: Past halving rallies are not a guarantee. Macro conditions, market size, and existing supply expectations can change the outcome completely.

    What Is Bitcoin Halving, Really?

    Look, the name makes it sound complicated, but the mechanism is pretty simple once you strip away the noise.

    Bitcoin halving is a coded event, not a decision anyone makes.

    What Actually Changes During a Halving

    • Block reward paid to miners drops by 50%
    • New coin supply entering circulation slows immediately
    • Mining profitability shifts overnight for anyone running on thin margins
    • Network difficulty adjusts afterward to match the new hash rate
    • Nothing about existing holders’ coins changes at all

    It’s not a marketing stunt.

    It’s not a company announcement.

    It’s a rule written into Bitcoin’s protocol from the very start, and it fires automatically whether anyone is paying attention or not.

    1. How the Halving Mechanism Works

    Bitcoin’s protocol pays miners a reward for confirming blocks.

    Roughly every four years, or after a set number of blocks are mined, that reward gets cut in half automatically.

    Miners who were earning a certain number of coins per block suddenly earn half – a mechanic covered in full in how Bitcoin actually works, from wallets to mining.

    This has happened multiple times already, moving from an initial reward of 50 BTC per block all the way down through several halvings to a small fraction of that original number.

    Real Backtest Example

    If a shrinking percentage gain per cycle sounds abstract, a real bot run through a genuine BTC bull leg makes the point concrete. In June–July 2025, BTC climbed nearly 15% — the kind of move halving hype threads love to point to. A DCA bot running through that exact window tells a different story than “buy the halving and hold.”

    Strategy: DCA Bot
    Coin: BTC/USDT
    Market Condition: Strong uptrend (+14.5%)
    Objective: Capture gains through systematic dip-buying during a rally
    Key Result: 8 of 9 sessions closed in profit, but the bot finished $119.81 behind simple buy-and-hold
    Expert Interpretation: Strategy choice matters as much as market direction. A rising market doesn’t automatically reward every approach equally — which is exactly why “the pattern says price goes up” isn’t the same as “any strategy captures that upside.”

    BTC Ran +14.5% and Our DCA Bot Only Made $40

    Honestly, the elegance of it is that nobody can change it. Not Zaheer, not a whale, not an exchange.

    It’s baked into the code.

    2. Why Satoshi Built It This Way

    Here’s the interesting part.

    This wasn’t an accident or an afterthought.

    The entire design exists to create predictable, shrinking scarcity. Instead of a central bank deciding when to print more money, Bitcoin’s supply schedule was fixed from day one, capped at 21 million coins total.

    HISTORICAL DATA AUDIT

    Battle-Test Your Strategy
    Before the Market Does.

    Eliminate guesswork with institutional-grade backtesting for DCA, Grid, and Rebalance bots. Real historical data. Real-world results.

    EST. OPTIMIZATION +42% ROI Efficiency
    Start Backtest Now

    Sourced from 5+ Years of Exchange Data

    That’s exactly why people call it digital gold.

    Except unlike gold, you can verify the entire supply schedule down to the exact block.

    No guessing, no trusting an institution. Just code, and everyone can check it themselves.

    Does Halving Actually Move Price?

    Now let’s look at the part everyone actually cares about. Does cutting the supply in half actually push the price up?

    The honest answer is: it’s complicated, and anyone giving you a confident “yes, guaranteed” is selling something.

    Prior halving cycles gained anywhere from roughly 600% to over 9,000% in the months following the event, but each cycle’s percentage gain has been smaller than the last.

    (Source: crypto cycle data, verify before publishing)

    That’s a massive number.

    But here’s the catch.

    Percentage returns shrinking each cycle isn’t a coincidence. It’s math. A market with more capital in it needs proportionally more money to move the same percentage. Few people talk about that part.

    1. What Happened After Past Halvings

    In every completed cycle so far, the price didn’t explode on the day of the halving itself. It took months.

    Sometimes over a year.

    The pattern looks something like this: quiet accumulation, a slow grind, then a delayed rally that peaked somewhere between 12 and 18 months later.

    Chasing the exact halving date for a quick flip has, historically, not been the move.

    The real move happened later, after the narrative built and new demand caught up to reduced supply.

    Reality Check

    Common belief: Once a halving narrative kicks in, any strategy running through the rally will perform similarly — it’s just a matter of being in the market.

    What CryptoGates research found: Backtesting a BTC DCA bot through a sharp macro-driven crash — the April 2025 tariff-fear selloff that took BTC from $87K to $74K — showed the opposite of what most traders assume happens in a downturn. Rather than bleeding out, 16 of 17 sessions closed via take-profit, and the bot finished $349.61 in the green while spot holders were sitting on paper losses.

    Why it matters: Macro shocks and halving cycles don’t move in isolation — tariffs, rate decisions, and liquidity conditions can override the “supply just got cut” narrative entirely. The bot’s edge came from a tested, rules-based response to volatility, not from correctly predicting the news cycle.

    The Tariff Trap Playbook — How a DCA Bot Turned BTC’s Worst April Into +$349 Profit

    2. Why This Time Could Look Different

    Realistically, every cycle has its own macro backdrop.

    Bigger institutional participation, different regulatory posture, and different levels of leverage are sitting in the system.

    Bitcoin’s market is also just bigger now, meaning more capital is required to produce the same percentage move.

    Does Bitcoin always pump right after a halving?

    No. Price moves have historically lagged the event by months, sometimes over a year, and each cycle’s gains have shrunk compared to the one before it.

    Don’t fade the pattern completely. But don’t treat it as gospel either.

    Verify first. Risk later.

    Scale slowly isn’t just a slogan, it’s the entire point of backtesting this stuff instead of guessing.

    What Halving Means for Miners and Network Security

    But there’s a problem most beginners never think about. Halving doesn’t just affect price speculation.

    It hits miners directly, and that has knock-on effects for the entire network.

    CEO Note:

    Zaheer puts it simply: “Every halving separates miners running a real business from miners running on hope. The network gets stronger because the weak links get squeezed out. That’s not a flaw. That’s the system working as designed.”

    When the reward miners earn gets cut in half overnight, their revenue gets cut in half too, assuming the price doesn’t immediately compensate for it.

    That’s a brutal math problem for anyone running old, inefficient equipment or paying high electricity costs.

    The Miner Capitulation Risk

    Some miners simply can’t survive the cut. Their costs stay the same, but their revenue just got sliced in two.

    So they shut off their machines. This is called miner capitulation, and it’s happened after previous halvings.

    SYSTEM ACCESS: CG4.2

    Stop Guessing.
    Stress Test Your Edge.

    The market doesn’t care about your backtest. Our engine simulates 1,000+ “what-if” scenarios to ensure your strategy is built for survival.

    Run Crypto Strategy Engine →
    ROBUSTNESS SCORE
    75+ STRUCTURAL EDGE
    RISK OF RUIN < 1%
    TARGET HIT 92%

    When enough miners drop out, the hash rate falls temporarily.

    The network then adjusts mining difficulty downward to compensate, which eventually restores profitability for the miners who stayed. It’s a self-correcting system, but it can get messy in the short term.

    Weaker hands get flushed out. Stronger, better-capitalized operations usually end up controlling more of the network afterward.

    How Traders Should Actually Approach a Halving

    So what should you actually do with all of this?

    Here’s the simple truth: positioning based on a halving narrative you read on CT isn’t a strategy. It’s a bet dressed up as analysis.

    CG STRATEGY ANALYZER

    Confused about
    market outlook?

    Trading without a plan is just gambling. Our strategy architect analyzes your risk tolerance and capital to match you with a proven algorithmic framework.

    PASSIVE DCA Bot
    AGGRESSIVE Grid Pro
    BALANCED Rebalance

    Most people think they need to predict exactly when price will move. They don’t.

    What they actually need is a tested plan for multiple scenarios, because nobody, including us, knows exactly how this cycle plays out.

    Verify the Narrative Before You Act

    This is where CryptoGates’ DCA Strategy Backtest Bot becomes genuinely useful instead of just another tool sitting unused.

    Rather than trusting a hype thread claiming “halvings always send BTC to the moon,” you can actually run historical data through a backtest and see how a dollar-cost averaging approach would have performed across every previous halving cycle, drawdowns included.

    Should I buy Bitcoin right before a halving?

    There’s no data suggesting the exact halving date is a reliable entry point. Historical rallies happened months after, not on the day itself, so timing purely around the event carries real risk.

    That’s the difference between conviction built on data and conviction built on vibes.

    One survives a red candle. The other doesn’t.

    The Bottom Line on Bitcoin Halving

    Halving changes the math behind Bitcoin’s supply, not the outcome of your trade.

    Every four years, new coin issuance gets cut in half, and history shows price often responds, just not on a fixed schedule and never with a guaranteed size.

    Treating a halving date as a buy signal on its own is gambling with extra steps.

    Testing how a strategy would’ve performed across every past cycle, drawdowns and all, is how you actually build conviction instead of borrowing someone else’s.

    CONFIDENTIAL // RESEARCH
    STRATEGY INTELLIGENCE

    Proven Setups &
    Expert Breakdowns.

    We don’t just show you the data; we engineer and validate high-performance strategies, providing the “Alpha” behind the numbers.

    Backtest before risking capital.

    Run the DCA Backtest Bot against every completed halving cycle and see the real numbers for yourself.

    FAQs

    When is the next Bitcoin halving?

    The next halving is expected roughly four years after the last one, once the network reaches the next scheduled block milestone. Exact timing shifts slightly based on block production speed.


    Every completed cycle so far has seen a rally within 12 to 18 months, but the size of the gains has shrunk each time. It’s a pattern, not a promise.


    Miner revenue per block drops by 50% overnight, squeezing out less efficient operations until network difficulty adjusts and profitability stabilizes for those who remain.


  • History of Bitcoin 📚: How Satoshi Nakamoto 🧠 Solved the Trust Problem and Changed Money ⛓️

    History of Bitcoin 📚: How Satoshi Nakamoto 🧠 Solved the Trust Problem and Changed Money ⛓️

    Picture this: someone builds something that moves billions of dollars every single day, and then just disappears.

    No interviews. No book deal. No goodbye tweet.

    That’s the history of Bitcoin in one sentence, and honestly, it’s stranger than most crypto stories you’ll read this year.

    Over 106 million people now hold Bitcoin worldwide, a number that started with exactly zero users and one anonymous coder.

    Triple-A Market Data

    Most people think Bitcoin was built by a big tech company or a government lab.

    Ser, it wasn’t.

    It came from a whitepaper posted on a random cryptography mailing list, written by someone who never showed their face.

    EXECUTIVE SUMMARY
    • The Problem: Traditional money always needed banks, governments, or middlemen you had to trust blindly.
    • The Solution: Bitcoin removed the middleman entirely, using math and code to create trust between strangers.
    • The Incentive: Understanding Bitcoin’s origin helps you separate real innovation from copycat hype in every market cycle.
    • The Risk: Bitcoin’s price history shows brutal drawdowns of 80% or more, and its story alone won’t protect your capital.

    The World Before Bitcoin

    Before we get to Satoshi, let’s zoom out for a second.

    Money has always needed someone in the middle.

    A bank. A government. A payment processor taking a cut. That setup worked, mostly, until it didn’t.

    1. Why Past Digital Cash Attempts Failed

    Here’s the interesting part.

    Bitcoin wasn’t the first attempt at digital money.

    Projects like DigiCash and e-gold tried this decades earlier and failed hard.

    The problem was always the same one: some central company still controlled the system. Shut down the company, and the money disappeared with it.

    Real Backtest Example

    Bitcoin’s price history directly backs up that lesson.

    In April 2025, BTC dropped from $87K to $74K in a matter of weeks — one of the sharpest macro-driven pullbacks of the year, and a small-scale echo of the 80%+ drawdowns that define its longer cycles.

    CryptoGates ran a real DCA bot during that exact window to see what disciplined execution looks like when the narrative turns bearish.

    Strategy: DCA Bot
    Coin: BTC/USDT
    Market Condition: Sharp macro-driven crash (tariff-news trigger)
    Objective: Test bot resilience during a fast, sentiment-driven sell-off
    Key Result: 16 of 17 sessions closed via take-profit, delivering $349.61 net profit while spot holders were still sitting on losses
    Expert Interpretation: The bot didn’t “believe” in Bitcoin’s story — it just executed a pre-defined process. That’s the same distinction the article draws: mechanics survive narrative shifts; conviction alone doesn’t.

    The Tariff Trap Playbook — How a DCA Bot Turned BTC’s Worst April in Years Into +$349 Profit

    Every early version needed a trusted third party, and that third party became a single point of failure.

    Hackers could target it. Regulators could shut it down.

    Founders could just walk away.

    What nobody had solved yet was how strangers could trust each other without trusting a middleman at all. That gap sat there, unsolved, for years.

    2. The 2008 Financial Crisis Backdrop

    Timing matters here.

    Bitcoin’s whitepaper dropped right as the global financial system was falling apart.

    Banks were collapsing. Bailouts were happening. Regular people watched institutions they trusted make reckless bets with their savings.

    Trust in the middleman was cracking in real time. That’s not a coincidence.

    HISTORICAL DATA AUDIT

    Battle-Test Your Strategy
    Before the Market Does.

    Eliminate guesswork with institutional-grade backtesting for DCA, Grid, and Rebalance bots. Real historical data. Real-world results.

    EST. OPTIMIZATION +42% ROI Efficiency
    Start Backtest Now

    Sourced from 5+ Years of Exchange Data

    The very first Bitcoin block ever mined contained a hidden message referencing a newspaper headline about a bank bailout.

    It reads almost like a quiet protest, embedded permanently into the blockchain.

    The system Bitcoin was replacing wasn’t abstract anymore. It was the same system that had just failed millions of people.

    The Bitcoin Whitepaper Moment

     On October 31st, a nine-page document landed on a cryptography mailing list titled “Bitcoin: A Peer-to-Peer Electronic Cash System.” Nobody at the time understood what it would become.

    Look, most whitepapers get ignored.

    This one didn’t.

    Who Is Satoshi Nakamoto?

    Here’s the thing that still bugs people today.

    Nobody knows who Satoshi Nakamoto actually is. Could be one person.

    Could be a small group working under a shared name. Emails exist. Forum posts exist. Even some early code commits exist. But the real identity?

    Satoshi’s estimated one million BTC hasn’t moved a single coin in over 15 years, making it the largest untouched wallet in crypto history.

    On-chain data from Glassnode

    Never confirmed.

    Satoshi mined an estimated one million Bitcoin in the early days and then just stopped posting in 2011, walking away without cashing out a single coin.

    That wallet still sits untouched. At current prices, that’s a fortune larger than most billionaires hold, and whoever controls it has never moved it.

    Ngl, that kind of restraint is almost harder to believe than the anonymity itself.

    What the Whitepaper Actually Proposed

    In simple terms, Satoshi solved something called the double-spend problem without needing a bank to check balances.

    Before this, digital money could theoretically be copied and spent twice, which is why every prior system needed a central authority watching the ledger.

    Satoshi’s fix was a public, shared record – the blockchain – verified by thousands of independent computers instead of one company.

    Was Bitcoin the first cryptocurrency ever created?

    Yes. Bitcoin was the first fully functional, decentralized cryptocurrency, launched with the genesis block. Earlier digital cash attempts existed but none solved decentralization the way Bitcoin did.

    Think of it like a shared notebook that everyone can see, nobody can secretly edit, and adding a new page requires proving real computational work first.

    That’s the entire trust model, and it’s held for over a decade without a single successful hack of the core protocol.

    How Bitcoin Actually Works

    Now let’s break this down without the jargon overload most guides throw at you.

    Bitcoin isn’t magic. It’s a set of rules that thousands of computers agree to follow, and nobody gets to bend them just because they’re powerful.

    1. Proof of Work Explained Simply

    Think of it like a giant math competition running nonstop, worldwide.

    Computers called miners race to solve a puzzle, and whoever solves it first gets to add the next block of transactions to the chain.

    That miner earns new Bitcoin as a reward. Here’s what most beginners miss: this isn’t wasteful busywork; it’s the security mechanism itself.

    Rewriting Bitcoin’s history would mean out-computing the entire honest network combined, which gets more expensive every single year.

    That difficulty is exactly why Bitcoin has never been successfully hacked at the protocol level.

    No CEO approves transactions. No server can be switched off to stop it.

    2. The 21 Million Coin Limit

    This is where things change compared to every currency before it.

    Governments can print more dollars whenever they want.

    Bitcoin can’t. The code hard-caps total supply at 21 million coins, ever.

    That scarcity isn’t a marketing line; it’s written directly into the protocol and enforced by every node on the network.

    CEO Note:

    Zaheer often says the story behind an asset means nothing if you can’t verify how it behaves under pressure. Bitcoin’s code is transparent, sure, but that doesn’t remove your job as a trader to backtest before you commit capital.

    Roughly every four years, the reward miners earn per block gets cut in half, a scheduled event known as the halving.

    Slower new supply, fixed final cap.

    That’s the entire monetary policy, decided once and never changed since.

    From Obscure Code to Global Asset

    Bitcoin didn’t jump from whitepaper to institutional balance sheets overnight.

    Ser, it took years of chop, doubt, and a whole lot of people calling it worthless.

    1. The Early Years and First Real-World Use

    Believe it or not, the first real-world Bitcoin purchase was two pizzas, bought for 10,000 BTC.

    At today’s prices, that trade looks almost painful to think about, but back then Bitcoin had no established value at all.

    That single transaction proved something bigger than the price tag, though – it showed Bitcoin could actually function as money between two strangers with zero bank involved.

    From there it slowly crept onto exchanges, into forums, and eventually into headlines most people couldn’t ignore anymore.

    2. Bitcoin Today

    Zoom out to where things stand now.

    Bitcoin still commands the largest share of total crypto market value by a wide margin, and that dominance has held even through brutal drawdown years.

    Institutional players, ETFs, and corporate treasuries now sit alongside retail holders in a way that simply didn’t exist a decade ago.

    That said, the chart still moves in cycles, sharp expansions followed by long, grinding corrections that test conviction.

    Before You Trust Any Bitcoin Narrative

    • Check whether the claim is backed by on-chain or price data, not just sentiment
    • Look at Bitcoin’s trend structure, not just the headline price
    • Separate the technology story from short-term price speculation
    • Backtest any strategy built around Bitcoin cycles before risking capital
    • Confirm information across more than one independent source

    A trader watching Bitcoin’s structure today isn’t asking “will it moon”; they’re asking whether the price is reclaiming key trend levels or still fighting resistance from above.

    That’s the disciplined framing CG pushes constantly, and it applies just as much to the oldest crypto asset as it does to the newest one.

    Can Bitcoin be shut down by a government?

    No single government controls Bitcoin’s network since it runs across thousands of independent nodes worldwide. Regulations can restrict access or exchanges, but they can’t switch off the protocol itself.

    What the Bitcoin Story Teaches Every Trader

    At the end of the day, Bitcoin’s origin story isn’t just trivia for CT threads.

    It’s a reminder that real innovation doesn’t need hype to survive; it needs proof. Satoshi built something, published the logic openly, and walked away without needing applause.

    That’s the opposite of most projects flooding timelines today with promises and no substance, part of a graveyard that now includes over 21,000 cryptocurrencies launched since Bitcoin.

    SYSTEM ACCESS: CG4.2

    Stop Guessing.
    Stress Test Your Edge.

    The market doesn’t care about your backtest. Our engine simulates 1,000+ “what-if” scenarios to ensure your strategy is built for survival.

    Run Crypto Strategy Engine →
    ROBUSTNESS SCORE
    75+ STRUCTURAL EDGE
    RISK OF RUIN < 1%
    TARGET HIT 92%

    Whether you’re holding Bitcoin long term or building a strategy around its cycles, the lesson stays the same: verify the mechanics before you trust the narrative.

    If you want to see how Bitcoin’s price behaves across real historical conditions instead of just reading about it, run it through the Spot Buy & Hodl Backtest Bot and look at the data yourself.

    FAQs

    Who really created Bitcoin?

    Nobody knows for certain. The name Satoshi Nakamoto is used, but their true identity has never been confirmed and they stopped all communication in 2011.


    The limit is hard-coded into Bitcoin’s protocol to create fixed scarcity, unlike government currencies that can be printed without limit.


    Yes. Bitcoin still holds the largest share of total crypto market value and continues to see growing institutional and retail adoption despite price cycles.


  • What Is a Rug Pull in Crypto? 🔍 Learn How Scams Work ⚠️ and Protect Your Funds 🛡️

    What Is a Rug Pull in Crypto? 🔍 Learn How Scams Work ⚠️ and Protect Your Funds 🛡️

    You see a token climbing 40% in an hour.

    Everyone in the Telegram group is posting rocket emojis.

    The chart looks unstoppable. Then, sometime between your third coffee and your fourth refresh of the page, the price goes to zero.

    Not a dip. Zero.

    Here’s the thing. This isn’t bad luck. It’s a rug pull, and it’s one of the oldest tricks in crypto’s short history.

    Rug pulls accounted for roughly $2.8 billion in losses during 2025 alone, making up close to 35% of all crypto scam losses that year

    (source: blockchain security research)

    If you’re trading anything outside the top few coins, understanding what a rug pull is isn’t optional anymore.

    It’s survival.

    EXECUTIVE SUMMARY
    • The Problem: New tokens launch by the thousands every day, and a real chunk of them are built to disappear with your money.
    • The Solution: Learn the mechanics behind rug pulls so you can spot the setup before you’re the exit liquidity.
    • The Incentive: A few minutes of verification can save you from a total loss on any single trade.
    • The Risk: Even careful traders get caught when hype moves faster than due diligence.

    What Is a Rug Pull in Crypto?

    A rug pull is exactly what it sounds like.

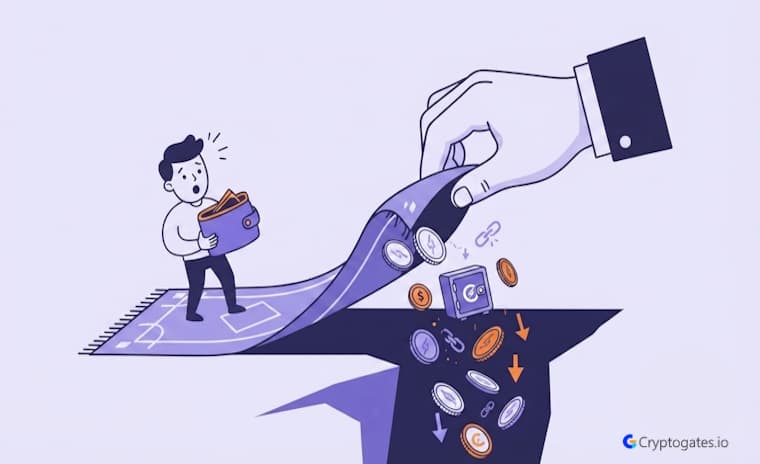
    The floor gets pulled out from under you.

    In practical terms, it’s a scam exit where the people behind a token drain the liquidity, dump their holdings, or just vanish, leaving everyone else holding a bag worth nothing.

    CEO Note:

    SEO is completely counterintuitive at the bottom line!

    Look, this isn’t some rare, once-in-a-blue-moon event either.

    Soft rug pulls, the slower kind where a team just quietly stops showing up, have actually increased faster than hard rugs recently.

    It’s not always a dramatic crash. Sometimes it’s a slow bleed dressed up as “we’re still building.”

    How a Rug Pull Actually Works

    Most rug pulls follow a pattern once you know what to look for.

    A team creates a token, pairs it with a real asset like ETH or BNB in a liquidity pool, and lets buyers pile in.

    That liquidity pool is what lets people actually sell the token back for something with value.

    Is a rug pull the same as a regular crypto crash?

    Not really. A regular crash comes from market-wide selling or bad news, but a rug pull is deliberate. Someone with control over the liquidity or supply chooses to drain it, on purpose, usually right when buying interest peaks.

    Here’s what most beginners miss.

    If the developers control that pool, they can pull the paired assets out whenever they want.

    The moment they do, the token’s price collapses to basically nothing, and there’s no one left on the other side of the trade. Some setups go a step further with code that blocks regular holders from selling at all, while insiders quietly cash out in the background.

    Either way, the mechanism is the same. Someone controls the exit, and you don’t.

    Reality Check

    Traders often assume that if a bot is actively firing profitable trades, the strategy itself must be working. CryptoGates backtest data complicates that assumption.

    Strategy: Grid Bot
    Coin: BNB/USDT
    Market Condition: 33% post-ATH crash over 79 days
    Objective: Test whether high trade frequency and positive grid profit translate into a net win
    Key Result: The bot fired 171 trades and generated $163.94 in grid profit — yet total ROI still landed at −21.64%
    Expert Interpretation: Grid profit and actual portfolio performance are not the same number. A strategy can look “active” and “profitable” on the surface while still losing money overall – which is exactly why checking the underlying data matters more than trusting the activity itself.

    BNB Crashed 33% After Its ATH — Our Grid Bot Lost Less, But Still Lost

    Common Types of Rug Pulls

    Not every rug pull looks the same, and honestly, that’s part of what makes them tricky to spot.

    Some hit fast.

    Some drag out over weeks while you’re still convinced the project is “just consolidating.” Knowing the difference helps you read the warning signs earlier.

    1. Liquidity Pulls

    This is the classic version, the one you’ve probably heard about even if you’re new to crypto.

    The developers hold the keys to the liquidity pool, wait until enough buyers have swapped in, then withdraw everything paired against the token. BTC, ETH, stablecoins, whatever backed it- gone in one transaction.

    The token itself still sits in your wallet. It’s just worth nothing because there’s no liquidity left to sell into.

    HISTORICAL DATA AUDIT

    Battle-Test Your Strategy
    Before the Market Does.

    Eliminate guesswork with institutional-grade backtesting for DCA, Grid, and Rebalance bots. Real historical data. Real-world results.

    EST. OPTIMIZATION +42% ROI Efficiency
    Start Backtest Now

    Sourced from 5+ Years of Exchange Data

    2. Limited Sell Order Scams

    This one’s sneakier, ngl. The smart contract itself gets coded so regular holders can buy but can’t sell, or can only sell a tiny percentage at a time.

    Meanwhile, wallets tied to the team face no such restriction.

    Price pumps as buyers pile in with no way out, and insiders quietly sell into that demand. It’s basically a trap disguised as a token.

    3. Slow Rugs

    Slow rugs don’t announce themselves.

    There’s no dramatic liquidity drain, no single moment you can point to.

    Instead, the team just starts dumping their token allocation bit by bit, over days or weeks, while community updates get vaguer and vaguer.

    By the time most holders notice the price has been bleeding for a month, most of the damage is already done.

    Red Flags That Signal a Rug Pull Before It Happens

    Here’s the good news.

    Rug pulls almost always leave fingerprints.

    The problem is that most people are too busy watching the chart to check for them.

    Roughly 88% of confirmed rug pulls either had zero liquidity lock or a lock lasting under 30 days, while legitimate projects typically lock for a year or more.

    on-chain Security Research

    That one stat alone should change how you approach a new token.

    If liquidity isn’t locked, or barely locked, that’s not a small detail.

    That’s the whole ballgame.

    1. Anonymous or Unverified Teams

    An anonymous team isn’t automatically a scam.

    Plenty of legitimate builders started that way.

    But anonymity does mean zero accountability if things go wrong, and that changes the risk math.

    If you can’t find real names tied to GitHub commits, LinkedIn history, or past projects, you’re trusting strangers with your capital on faith alone.

    Fair enough if you’re comfortable with that. Most people aren’t, once they think it through.

    Research Insight

    Many traders assume a bull run automatically means any active strategy will outperform simply holding. CryptoGates backtesting on a comparable setup shows that assumption doesn’t hold consistently.

    Strategy: DCA Bot
    Coin: BTC/USDT
    Market Condition: BTC surged nearly 15% over the test window
    Objective: Measure whether an automated bot captures more upside than passive buy-and-hold during a clear uptrend
    Key Result: The DCA bot closed 8 of 9 sessions in profit, but buy-and-hold still beat it by $119.81
    Expert Interpretation: Even a “working” strategy with a high win rate can underperform a simpler approach depending on market conditions. The only way to know which setup fits a given moment is to run the numbers first – not assume the outcome.

    BTC Ran +14.5%, and Our DCA Bot Only Made $40 — Here’s the Honest Truth

    2. Unlocked or Concentrated Liquidity

    This is the check that catches the most scams, full stop.

    Search the token’s liquidity pool on a lock verification platform like Team Finance or Unicrypt and see for yourself.

    Don’t trust a screenshot posted in a Telegram group. Check the lock duration, the percentage locked, and who actually controls it.

    Can a project with locked liquidity still be a rug pull?

    Yes. Locked liquidity lowers one specific risk, but developers can still mint extra tokens through code exploits or dump their own allocation slowly. A lock helps. It doesn’t guarantee safety on its own.

    A team that’s locked 10% of liquidity while keeping 90% free to move isn’t really locked at all. Also worth a look: how many wallets hold the majority of the supply.

    A handful of wallets holding most of the tokens means a handful of people can crash the price whenever they choose.

    How to Protect Yourself From Rug Pulls

    You don’t need to be a smart contract developer to avoid most rug pulls.

    You need the same crypto security habit of checking before you buy instead of after you’ve already lost money.

    1. Research Before You Buy

    Give yourself thirty minutes, not thirty seconds.

    Please check whether the contract includes an audit from a known firm, not just a fake audit badge with no report attached.

    Look at the liquidity lock, the wallet distribution, and whether the team has any traceable history outside this one project.

    If a project promises guaranteed returns or “can’t lose” setups, that’s your answer right there.

    No legitimate project needs to promise that.

    SYSTEM ACCESS: CG4.2

    Stop Guessing.
    Stress Test Your Edge.

    The market doesn’t care about your backtest. Our engine simulates 1,000+ “what-if” scenarios to ensure your strategy is built for survival.

    Run Crypto Strategy Engine →
    ROBUSTNESS SCORE
    75+ STRUCTURAL EDGE
    RISK OF RUIN < 1%
    TARGET HIT 92%

    Believe it or not, most of this information is public and free to check.

    The tools exist. Most people just skip them because FOMO moves faster than research.

    2. Why Verification Beats Hype

    Here’s the truth CT doesn’t always want to hear.

    Hype feels good in the moment.

    It also has zero predictive power over whether a token survives the week. The traders who avoid getting rekt aren’t the ones with the best instincts.

    They’re the ones who slow down and verify before they commit capital, every single time, even when the chart looks tempting.

    CG STRATEGY ANALYZER

    Confused about
    market outlook?

    Trading without a plan is just gambling. Our strategy architect analyzes your risk tolerance and capital to match you with a proven algorithmic framework.

    PASSIVE DCA Bot
    AGGRESSIVE Grid Pro
    BALANCED Rebalance

    This same discipline applies beyond spotting scams, too.

    It’s the same logic behind backtesting any strategy on real historical data before risking money live.

    Verify First, Buy Later

    Rug pulls don’t succeed because the victims were careless people.

    They succeed because hype moves faster than verification, and impatience beats process almost every time.

    The good news is the checks that catch most rug pulls take minutes, not hours. Liquidity lock status, team transparency, holder concentration.

    Check those three things consistently, and you’ll avoid the vast majority of these scams before they ever touch your wallet.

    If you’re building a habit of testing before trusting, that same mindset applies to strategy, not just token selection.

    Run your own parameters and see what the data shows before you scale anything with real capital.

    FAQs

    Can you get your money back after a rug pull?

    In most cases, no. Blockchain transactions can’t be reversed, though some victims have traced funds through on-chain analysis and reported to law enforcement with mixed results.


    Often yes, in jurisdictions where they involve fraud or misrepresentation. Prosecution is difficult though, since many teams stay anonymous and operate across borders.


    More common than most beginners realize. They remain one of the top categories of crypto scams, with billions lost across chains in recent years, concentrated heavily in low-cap and memecoin launches.


  • Statistically Valid Backtest 📊: How Many Trades 🧪 Do You Actually Need to Trust the Results? 🎯

    Statistically Valid Backtest 📊: How Many Trades 🧪 Do You Actually Need to Trust the Results? 🎯

    Ser, be honest with yourself for a second.

    How many trades did you look at before you decided your strategy actually works?

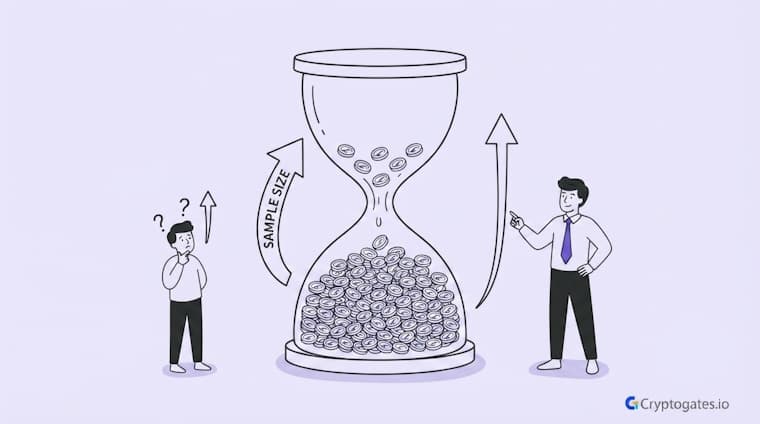
    If the number is somewhere around 10 or 15, ngl, you haven’t tested anything yet. You’ve just gotten lucky or unlucky, and your brain is calling it proof either way.

    Research on trading strategy validation suggests that samples under 30 trades carry a high probability of false positives, meaning a losing strategy can easily look like a winner by pure chance.

    (Source: Quantitative trading research)

    A statistically valid backtest needs way more data than most beginners think, and that gap is exactly why so many “profitable” strategies fall apart the moment real money touches them.

    This pattern aligns with 97% of day traders losing money in their first year of trading. Here’s the thing.

    The market doesn’t care how confident you feel after a good streak.

    EXECUTIVE SUMMARY
    • The Problem: Most traders judge a strategy after 10-20 trades, which is barely enough to say anything statistically meaningful.
    • The Solution: Understanding the real trade count threshold, and using tools like the Crypto Strategy Engine, separates real edge from a lucky streak.
    • The Incentive: Fewer blown accounts from strategies that only ever “worked” on a tiny, lucky sample.
    • The Risk: Even a large sample doesn’t guarantee future performance, it just lowers the odds you’re fooled by randomness.

    Why Trade Count Decides If Your Backtest Means Anything

    Look, this is where most beginners get tripped up.

    A strategy can win 8 out of 10 trades and still be garbage.

    Not because the math is wrong, but because 10 trades isn’t a sample; it’s basically a coin flip with extra steps. Small numbers swing wildly.

    Backtest Sample Size Audit

    • Did you test fewer than 30 trades? Treat results as unreliable.
    • Did your sample include only one market condition? Red flag.
    • Did you cherry-pick the date range? Results are biased.
    • Did you ignore fees and slippage? Numbers are inflated.
    • Did you test across multiple assets? Stronger validity signal.

    One good week can make a mediocre system look genius, and one bad week can make a solid system look broken.

    That’s not an opinion, tbh; that’s just how probability works when your sample is tiny.

    1. What “Statistically Valid” Actually Means in Trading

    Statistically valid doesn’t mean guaranteed.

    It means the pattern you’re seeing is unlikely to be random noise dressed up as an edge. That’s it. It’s a confidence thing, not a certainty thing.

    A strategy can be statistically valid and still lose money next month, a caveat regulators echo in guidance noting that backtested performance is hypothetical, never a guarantee of future returns.

    What it can’t do is claim to have “proven” anything off a handful of trades. The math just doesn’t support that conclusion, no matter how good the equity curve looks on your screen.

    2. The Danger of Judging a Strategy on 10-20 Trades

    Here’s the issue.

    A coinflip strategy, one with genuinely zero edge, can produce a 70% win rate over 10 trades just by chance.

    It happens more often than people assume.

    Bagholders love to defend a strategy because “it worked the last dozen times,” not realizing a dozen times proves almost nothing in a market this noisy.

    The real test only shows up once the sample grows large enough to drown out luck.

    The Real Number of Trades You Need

    So what’s the actual number?

    Most quants treat 100 trades as a reasonable floor and 300 or more as the point where results start to hold up against a proper crypto backtesting methodology.

    HISTORICAL DATA AUDIT

    Battle-Test Your Strategy
    Before the Market Does.

    Eliminate guesswork with institutional-grade backtesting for DCA, Grid, and Rebalance bots. Real historical data. Real-world results.

    EST. OPTIMIZATION +42% ROI Efficiency
    Start Backtest Now

    Sourced from 5+ Years of Exchange Data

    That might sound like a lot, sir, but crypto moves fast enough that hitting these numbers isn’t unrealistic, especially once you’re backtesting across months or years of historical data instead of watching live trades trickle in one at a time.

    1. Why 30 Trades Is the Bare Statistical Minimum

    Thirty shows up a lot in stats textbooks because it’s roughly where basic distribution assumptions start to hold up.

    Below that, you’re working with numbers too small for standard statistical tools to say much of anything. 

    Swipe to view full data →
    Trade Count Confidence Level
    Under 30 Statistically meaningless
    30-99 Weak, bare minimum
    100-299 Reasonable confidence
    300+ Strong, professional-grade

    Above it, at least the math stops actively lying to you.

    But here’s the catch. Thirty is a floor, not a finish line.

    It’s the point where you can stop calling your results “meaningless” and start calling them “weak.”

    2. Why Professionals Push Past 100 or 300 Trades

    More trades mean luck gets diluted.

    A five-trade winning streak barely moves the needle once it’s buried inside 200 other trades. That’s the whole point.

    Professional quants and prop desks generally won’t take a strategy seriously below a few hundred trades, because anything less still leaves too much room for randomness to be doing the heavy lifting instead of actual edge.

    Real Backtest Example

    Strategy: Geometric Grid Bot
    Coin: PEPE/USDT
    Market Condition: Flat, high-volatility chop (near-zero net price change over 62 days)
    Objective: Test whether trade volume alone can generate edge when price direction offers none
    Key Result: 256 trades fired inside a single test window, producing +11.07% ROI while the underlying coin moved -0.92%

    Expert Interpretation: This is the kind of sample size the “100 or 300 trades” threshold is actually talking about. A single grid bot run generated more executed trades than most manual traders rack up in a year of live discretionary trading. That volume is exactly why the result holds weight, it isn’t one lucky session, it’s 256 independent data points inside the same regime, and the outcome held up across nearly all of them rather than depending on one or two outlier trades.

    View Complete Playbook: 256 Trades. A Coin Down -0.92%. A Bot Up +11.07%. This Is What Geometric Grids Do to Meme Coin Volatility

    Is 50 trades enough for a backtest?

    Fifty is better than 10 or 20, but it’s still on the thin side. It clears the bare statistical minimum but won’t hold up across different market regimes. Treat it as an early signal, not final proof.

    How Market Regimes Change This Number

    Here’s what most guides miss.

    Three hundred trades from a single six-month bull run doesn’t tell you what happens when the market chops sideways for a year.

    A strategy needs exposure across bull, bear, and range-bound conditions, including the sustained downtrends Binance Academy defines as bear markets, not just a stretch where everything was pumping. Otherwise, you’re not testing a strategy; you’re testing one specific market mood.

    Research Insight

    Traders often assume a strategy either “works” or “doesn’t,” treating the test window as a single verdict. Our internal Playbook data tells a different story. In one DCA backtest on TAO, the coin pumped 36% and then round-tripped into a 17% loss, all inside the same test period.

    That’s technically one continuous window, but functionally two opposite market regimes stitched together: a strong uptrend followed by a hard reversal.

    Strategy: DCA Bot
    Coin: TAO/USDT
    Market Condition: Sharp pump followed by a reversal into a 17% net loss
    Objective: See whether a strategy tuned for accumulation survives a regime flip inside a single run
    Key Result: 139 of 140 sessions closed in profit, netting +$1,677 despite spot holders ending the period down 17%

    Expert Interpretation: This is the practical version of what the article calls regime exposure. A sample size number on its own says nothing about whether the market conditions inside that sample actually varied. 140 sessions spanning a pump-then-dump cycle tells you far more about a strategy’s durability than 140 sessions from a single uninterrupted trend would.

    View Complete Playbook: TAO Pumped 36%, Then Bled Back to a 17% Loss — Our DCA Bot Still Banked +$1,677

    How to Check If Your Sample Size Is Actually Reliable

    Okay, so you’ve got more than 30 trades. Does that mean you’re done?

    Not quite. Trade count is just the starting point.

    The real question is whether your results hold up once you account for the natural randomness baked into any sample, even a decent-sized one.

    1. Using Confidence Intervals and Standard Deviation

    Here’s a simple gut check.

    If your win rate is 55% but the confidence interval around that number stretches from 35% to 75%, you don’t actually know if you have an edge.

    CEO Note:

    Zaheer puts it simply: verify first, risk later, scale slowly. A backtest with a shaky sample size is still a guess wearing a strategy’s clothes.

    You just guess with a number attached.

    Wide intervals mean your sample size hasn’t done its job yet.

    The tighter the range around your results, the more the data is actually telling you something instead of just reflecting noise.

    2. Why the Crypto Strategy Engine’s Monte Carlo Approach Solves This

    This is where things get interesting. Instead of trusting one single backtest run, the Crypto Strategy Engine reshuffles your trade sequence thousands of times through Monte Carlo simulation.

    If your Robustness Score holds steady across those thousands of “what-if” universes, your edge is probably structural.

    What happens if a backtest has too few trades?

    Your results become statistically meaningless, even if the equity curve looks great. A small sample can’t separate genuine edge from a random lucky streak, which means you’re risking real capital on what’s essentially a guess.

    If the score swings wildly from run to run, ser, that’s the market politely telling you it was luck all along.

    It’s basically stress testing your sample size assumptions instead of just trusting them blindly.

    Trade Count Is the Foundation of Every Real Backtest

    At the end of the day, sample size isn’t some boring technicality you can skip past.

    It’s the difference between testing a strategy and just watching a coin flip land your way a few times in a row.

    SYSTEM ACCESS: CG4.2

    Stop Guessing.
    Stress Test Your Edge.

    The market doesn’t care about your backtest. Our engine simulates 1,000+ “what-if” scenarios to ensure your strategy is built for survival.

    Run Crypto Strategy Engine →
    ROBUSTNESS SCORE
    75+ STRUCTURAL EDGE
    RISK OF RUIN < 1%
    TARGET HIT 92%

    Thirty trades get you out of “meaningless” territory.

    A few hundred gets you somewhere close to real confidence. Anything less, and you’re building conviction on noise, not data.

    Run your own parameters through the Crypto Strategy Engine and see what the Monte Carlo simulation actually says about your edge before you scale anything with real capital.

    FAQs

    How many trades do I need before I trust a backtest?

    Thirty trades is the bare statistical minimum, but most quants want 100 to 300 before trusting the results with real confidence.


    It can look profitable on paper, but 20 trades isn’t enough to tell if that’s a real edge or just a lucky streak.


    No, more trades just means more statistical confidence. The strategy still needs to survive different market regimes to hold up.


  • 12 Crypto Backtesting Mistakes ⚠️ Every Trader Should Fix 🎯 Before Going Live 📈

    12 Crypto Backtesting Mistakes ⚠️ Every Trader Should Fix 🎯 Before Going Live 📈

    Ngl, this happens to almost every trader at some point, and it tracks with why 97% of day traders lose money within their first year of trading.

    You build a strategy, run the numbers, and the backtest looks clean—green curve, solid win rate, decent drawdown.

    Then you go live, and it just doesn’t hold up.

    Here’s the uncomfortable part: it’s usually not the strategy.

    A large share of unadjusted crypto backtests carry hidden bias or data leakage, which is a big reason live Sharpe ratios often land far below what the backtest promised.

    (Source: Blockchain Council / Vantixs research)

    These common backtesting mistakes hide inside the testing process itself, quietly inflating results until real capital exposes them.

    This piece breaks down the 12 mistakes that cause this gap, one by one, with what actually causes each one and how to fix it before you risk anything.

    EXECUTIVE SUMMARY
    • The Problem: Most crypto backtests get quietly wrecked by a handful of repeatable, avoidable mistakes.
    • The Solution: Know exactly what each mistake looks like and fix it at the source, not after you’ve already lost money.
    • The Incentive: A backtest that survives all 12 checks actually means something before you risk real capital.
    • The Risk: Miss even one of these and your “proven” strategy might just be an illusion built on bad testing.

    Why Backtesting Mistakes Are So Easy To Miss

    Here’s the thing nobody tells you upfront.

    A backtest doesn’t need to be wrong to look right. It just needs to hide its flaws well enough for the equity curve to still climb.

    That’s exactly why so many traders get blindsided.

    They’re not being careless; they’re just trusting a number that was never built on solid ground in the first place.

    A Good-Looking Backtest Isn’t The Same As A True One

    Passing the eye test and passing a real audit are two very different things.

    A chart with a smooth upward curve feels convincing.

    But convincing isn’t the same as correct.

    CEO Note:

    Zaheer puts it simply. “A backtest that can’t survive being questioned isn’t proof, it’s just a nice-looking chart.” Verify first, risk later.

    The only way to know if a backtest is actually trustworthy is to check it against the specific mistakes that commonly sneak in, which is exactly what the rest of this guide walks through.

    Why does a strategy pass backtesting but fail live trading?

    Usually because the backtest hid one or more of the common mistakes below, like ignored fees, curve fitting, or survivorship bias, that inflate results without you realizing it.

    The 12 Common Backtesting Mistakes

    Alright, let’s get into it.

    Each one of these mistakes does the same basic thing: it makes a backtest look better than reality would ever allow. Some are about bad data.

    Quick Gut Check Before You Trust a Backtest

    • Did you check for missing or incomplete candles?
    • Did you include real trading fees and slippage?
    • Did you test the strategy on more than one coin?
    • Did you validate it on data the strategy never saw?
    • Did you check for look-ahead or survivorship bias?

    Some are about bias baked into the process.

    Others are just human nature showing up where a spreadsheet can’t see it. Here’s each one, what actually causes it, and how to fix it.

    1. Using Poor Or Incomplete Data

    This one sounds basic, but it wrecks more backtests than people realize.

    Missing candles, wrong prices, or gaps in the historical feed create signals that never actually existed in the real market.

    A moving average crossover that “triggered” on a data error isn’t a real signal; it’s noise dressed up as an edge.

    Research Insight

    Sample size is one of the quietest ways a backtest lies to you.

    A strategy that looks solid over 10 sessions can fall apart once tested across 100+. In one of our internal DCA tests on a mid-cap asset that round-tripped through a sharp pump and an equally sharp bleed, 139 of 140 sessions still closed in profit.

    That kind of consistency only becomes meaningful at scale — a 10-session sample would have told a completely different, and far less reliable, story. This is exactly why thin sample sizes make the “mistakes” list: a strategy needs volume across market phases before its edge can be trusted, not just a clean-looking curve over a short window.

    Expert Interpretation: A result that holds across hundreds of sessions and multiple price regimes is structural. A result that only holds across a dozen sessions is a coincidence wearing a strategy’s clothes.

    TAO DCA Bot Made $1,677 While Spot Holders Lost 17%

    The fix is simpler than it sounds: source data from a reputable exchange feed, check for gaps before running anything, and cross-reference a sample of candles against a second source if the strategy is going to trade on tight timeframes.

    CryptoGates runs backtests on real 1-minute OHLCV data across major exchanges specifically to avoid this trap. Clean data isn’t glamorous, but it’s the floor everything else is built on.

    2. Ignoring Fees And Slippage

    This mistake is sneaky because it’s invisible until you add it back in.

    A strategy that trades often can look amazing with zero costs baked in, then bleed out the moment maker and taker fees, funding rates, and realistic slippage get factored into every trade.

    HISTORICAL DATA AUDIT

    Battle-Test Your Strategy
    Before the Market Does.

    Eliminate guesswork with institutional-grade backtesting for DCA, Grid, and Rebalance bots. Real historical data. Real-world results.

    EST. OPTIMIZATION +42% ROI Efficiency
    Start Backtest Now

    Sourced from 5+ Years of Exchange Data

    Fix it by modeling real costs from day one, not as an afterthought.

    Include exchange fee tiers, expected slippage on the pairs you’re trading, and funding costs if the strategy touches futures.

    A strategy that still profits after all of that is a strategy worth taking seriously. One that only works with zero fees was never really working.

    3. Over-Optimizing The Strategy (Curve Fitting)

    Curve fitting happens when you tweak the RSI, then the stop-loss, then the entry filter, over and over, chasing a better-looking backtest.

    Eventually the strategy fits the past data almost perfectly.

    But there’s a problem. It didn’t learn a real pattern; it memorized noise.

    A mathematician named John von Neumann joked that with enough parameters you can make a model fit almost any shape, even something as ridiculous as an elephant.

    Backtesting has the same trap.

    Real Backtest Example

    Strategy: Grid Bot
    Coin: BTC/USDT
    Market Condition: Moderate bull run, +10.4% over the month
    Objective: Test whether fees and execution costs meaningfully erode grid profit in a live-like environment
    Key Result: The bot returned +7.74% ROI while total fees across the entire run came to just $3.26 — a number small enough to ignore, until you multiply it across dozens of strategies run without cost modeling
    Expert Interpretation: This is the exact gap the article’s Mistake #2 (ignored fees) points at. On paper, fees look negligible. At scale, across hundreds of untested runs, unmodeled costs are one of the fastest ways a “profitable” backtest quietly turns unprofitable the moment it goes live.

    BTC Grid Bot Backtest — May 2025

    The fix is discipline.

    Keep parameters few; stacking more than 3 to 4 indicators rarely improves real performance and mostly just lets the strategy curve-fit history more tightly.

    If a strategy needs a dozen conditions to look good, it’s probably not an edge at all.

    4. Look-Ahead Bias

    Look-ahead bias sneaks in when a backtest accidentally uses information that wouldn’t have been available at the actual moment of the trade.

    The classic version is the candle-close trap.

    A signal confirms only after a candle closes, but the backtest lets the strategy enter right at that same close, as if it knew the candle was about to finish that way.

    Repainting indicators cause the same issue, showing a beautiful historical signal that was never actually visible in real time.

    SYSTEM ACCESS: CG4.2

    Stop Guessing.
    Stress Test Your Edge.

    The market doesn’t care about your backtest. Our engine simulates 1,000+ “what-if” scenarios to ensure your strategy is built for survival.

    Run Crypto Strategy Engine →
    ROBUSTNESS SCORE
    75+ STRUCTURAL EDGE
    RISK OF RUIN < 1%
    TARGET HIT 92%

    The fix is to process data strictly in sequence and assume entry only on the next candle open, or the next realistic tradable price, never the same bar a signal is confirmed on.

    It feels like a small detail. It isn’t.

    This single mistake alone can turn an average strategy into a fake superstar on paper.

    5. Survivorship Bias

    This one is sneaky in a different way.

    It happens when a backtest only includes coins that are still around today, quietly ignoring the ones that got delisted, lost liquidity, or straight-up rugged. Crypto has thousands of dead coins.

    Testing an altcoin strategy only on today’s winners, like ignoring the fact that projects like Bitconnect once looked promising before collapsing, makes the whole approach look far cleaner than it really was.

    Reality Check

    Common belief: If a strategy backtest shows a profit, the underlying logic is sound.
    What CryptoGates research found: In one rebalance test run across a violent, one-sided BTC/ETH divergence, we tested three parameter variants of the same strategy. Two of the three lost money. Only one survived — and it did so mainly by barely rebalancing at all. Same strategy, same data window, three very different outcomes depending on parameter choice alone.

    Why it matters: This is curve fitting’s blind spot in miniature. A single backtest run proving profitable tells you almost nothing about whether the edge is real or just a lucky parameter combination for that specific window. Testing multiple variants against the same data, the way Monte Carlo simulation does at scale, is what actually separates a structural edge from a coincidence.

    One Asset Soared. One Collapsed. Our Rebalance Bot Picked the Wrong Side 249 Times

    Fix it by including delisted and failed assets in your testing universe wherever the data allows, not just the survivors.

    If a strategy is being tested on “today’s top 20 coins,” ask yourself how many of those existed and looked healthy three years ago too.

    That’s the real test.

    6. Testing On Too Few Coins

    A strategy that crushes it on BTC alone might completely fall apart the moment you run it on ETH, or some random mid-cap altcoin.

    Testing on one or two assets gives a narrow, flattering picture that has nothing to do with how the strategy performs broadly.

    CG STRATEGY ANALYZER

    Confused about
    market outlook?

    Trading without a plan is just gambling. Our strategy architect analyzes your risk tolerance and capital to match you with a proven algorithmic framework.

    PASSIVE DCA Bot
    AGGRESSIVE Grid Pro
    BALANCED Rebalance

    The fix here is straightforward.

    Run the same rules across a wider basket of coins, ideally ones with different volatility profiles and market caps, and see if the edge actually holds.

    If it only works on one coin, that’s not a strategy. That’s a coincidence wearing a strategy’s clothes.

    7. Testing Only One Market Condition

    Here’s what most beginners miss completely.

    A strategy built and tested only during a bull run can look unstoppable, right up until the market turns sideways or drops into a bear phase.

    Market regime changes everything. Grid strategies, for example, tend to shine in choppy, range-bound markets and struggle badly in strong trends, while trend-following setups do the opposite.

    Data Highlight

    One pattern shows up consistently across our Playbook archive: a strategy’s paper performance and its real, cost-adjusted performance are not the same number, and the gap tends to widen the more volatile the asset.

    In a 44-day SOL grid test through a high-volatility downtrend, the bot returned +9.27% ROI — a solid number, but only after fees, slippage, and execution timing were factored into the raw grid activity.

    Strip those variables out and the “theoretical” number looks meaningfully better than what actually lands in the account.

    This is the practical version of the article’s data quality and cost-modeling mistakes: the difference between a backtest that describes what could happen and one that describes what would actually happen.

    While SOL Bled Out, the Grid Bot Didn’t

    The fix is to run the strategy across bullish, bearish, and sideways periods separately, not just one long combined test. If the results only hold up in one condition, that’s valuable information too.

    It just means the strategy needs a regime filter, not blind trust across every market phase.

    8. Too Few Trades (Small Sample Size)

    This mistake is about math, not strategy logic.

    A backtest with fewer than 30 trades is statistically close to meaningless; you genuinely can’t tell skill from luck at that size.

    Somewhere between 30 and 100 trades starts becoming directionally useful, but real confidence usually needs 100 to 300 trades before treating the results as evidence of a genuine edge.

    CONFIDENTIAL // RESEARCH
    STRATEGY INTELLIGENCE

    Proven Setups &
    Expert Breakdowns.

    We don’t just show you the data; we engineer and validate high-performance strategies, providing the “Alpha” behind the numbers.

    Fix it by extending the test period or widening the asset pool until the trade count is large enough to trust.

    A strategy that only fired 12 times over a year hasn’t proven anything yet, good or bad. It just hasn’t been tested enough to know.

    9. Not Using Out-Of-Sample Validation

    Testing and validating a strategy on the same data is a bit like grading your own exam with the answer key already memorized.

    Of course it looks good.

    This is one of the most common reasons a backtest feels bulletproof and then completely falls apart live.

    Expert Observation

    After reviewing grid Playbooks across bull runs, crashes, and sideways chop, one pattern keeps repeating: the strategy itself is rarely the reason a result disappoints. In a 79-day BNB test through a 33% post-ATH crash, the bot generated real grid profit — $163.94 worth of executed trades — and still finished at −21.64% ROI overall. The mechanics worked exactly as designed. The market condition simply didn’t cooperate with the range the bot was set to. That distinction, gross activity profit versus net account result, is the same trap that inflates a lot of backtests: activity gets mistaken for performance, and a bad market fit gets mistaken for a broken strategy.

    BNB Crashed 33% After Its ATH — Our Grid Bot Lost Less, But Still Lost

    The fix is to hold back a chunk of historical data the strategy never touches during development, then test on that unseen portion once the rules are locked in.

    If performance holds up on data the strategy has never “seen” before, that’s a real signal.

    If it falls apart, the original result was probably just curve fitting in disguise.

    10. Using Unrealistic Position Sizing

    Sizing every trade for maximum theoretical profit makes a backtest look incredible on paper and sets up real accounts to blow up fast.

    It’s an easy trap because bigger position sizes just make every winning trade look more impressive in the results table.

    CG STRATEGY ANALYZER

    Confused about
    market outlook?

    Trading without a plan is just gambling. Our strategy architect analyzes your risk tolerance and capital to match you with a proven algorithmic framework.

    PASSIVE DCA Bot
    AGGRESSIVE Grid Pro
    BALANCED Rebalance

    The fix is matching backtest sizing to what you’d actually be comfortable risking with real money.

    If the strategy only looks good at 20% risk per trade, that’s not really a workable strategy; that’s a warning sign.

    Size for the account you actually have, not the one you wish you had.

    11. Ignoring Stop-Loss And Take-Profit Logic

    Entries get all the attention in most strategy discussions.

    Exits are what actually decide whether you walk away profitable.

    A strategy with a sharp entry signal and a sloppy, undefined exit plan can turn a genuinely good idea into a losing one without the entry logic ever being at fault.

    REF: VOL-NEUTRAL-2026

    Neutralize Volatility.
    Own the Growth.

    Access systematic playbooks designed to eliminate emotional bias. From Spot HODL frameworks to advanced Grid simulators.

    ◒
    Spot & HODL
    ◈
    DCA Engine
    ▦
    Grid Tactics
    ☯
    Rebalance

    The fix is treating exit rules with the same seriousness as entries.

    Define stop-loss and take-profit levels clearly, test them as part of the strategy rather than an afterthought, and check how sensitive the results are to small changes in those exit levels.

    If tiny tweaks to the exit completely flip the outcome, the strategy is more fragile than it looks.

    12. Forgetting Emotional And Execution Limits

    Unfortunately, this is the one mistake no backtest can ever fully capture.

    Live trading brings hesitation before clicking a button, fat-fingered orders, missed entries because you were away from the screen, and the very human urge to override your own rules mid-trade.

    A backtest assumes perfect, robotic discipline every single time. You’re not a robot, ser.

    What is the difference between look-ahead bias and survivorship bias?

    Look-ahead bias means using information that wasn’t available at the time of the trade. Survivorship bias means only testing on assets that are still around today, ignoring the ones that failed or got delisted.

    The fix isn’t technical; it’s behavioral.

    Paper-trade the strategy first to feel out the emotional side before real capital is involved, and build in simple rules for what happens if you miss an entry or exit late.

    A strategy is only as good as your ability to actually follow it under pressure.

    How CryptoGates Helps You Avoid These Mistakes

    Honestly, catching all 12 of these manually is a lot to track for every single strategy idea.

    Clean data, real fees, bias checks, multiple coins, multiple market phases- that’s a genuinely tedious workflow to build from scratch each time.

    Swipe to view full data →
    Mistake Category What CryptoGates Handles
    Data Quality Clean 1-minute OHLCV data across major exchanges
    Trading Costs Fees and slippage built into every backtest
    Sample Size Multi-coin, multi-period testing in minutes

    CryptoGates’ backtesting bots handle the data quality and cost modeling side automatically, running your DCA, Grid, or Rebalance strategy against real historical OHLCV data with fees and slippage already factored in.

    That removes mistakes 1, 2, and 10 almost entirely, following the same crypto backtesting methodology CryptoGates uses to validate every DCA, Grid, and Rebalance strategy before it goes live

    Knowledge Check

    Your strategy shows a 95% win rate in backtesting, but you forgot to include trading fees and slippage. What’s the biggest risk?

    The Crypto Strategy Engine goes a step further, running thousands of “what-if” scenarios through Monte Carlo simulation so a stable result actually means the edge is structural, not a lucky sequence hiding curve fitting or bias underneath.

    Final Takeaway

    Here’s the truth.

    None of these 12 mistakes are complicated once you know what to look for.

    Bad data, ignored costs, curve fitting, look-ahead and survivorship bias, thin sample sizes, single market conditions, weak validation, unrealistic sizing, sloppy exits, and the human execution gap.

    That’s the full list standing between a backtest that lies to you and one you can actually trust.

    Fix the process, and the strategy either proves itself, or it doesn’t; honestly, either way you come out ahead.

    Test this setup yourself. Backtest before risking capital, not after.

    FAQs

    What is the most common backtesting mistake in crypto trading?

    Over-optimizing the strategy, also called curve fitting, is probably the most damaging one. It makes a backtest look flawless while quietly destroying any real, repeatable edge.

    Most traders need at least 100 to 300 trades before treating results as real evidence of an edge. Anything under 30 trades is close to statistically meaningless.


    Yes. Testing only coins that are still active today ignores every delisted or rugged project, which can make a strategy look far more profitable than it would have actually been.

  • Backtesting vs Live Trading 📊: Why the Same Strategy ⚠️ Produces Different Results 📈

    Backtesting vs Live Trading 📊: Why the Same Strategy ⚠️ Produces Different Results 📈

    Backtesting looks perfect until real money enters the chart.

    The moment slippage, liquidity, and your own emotions show up, that clean equity curve starts telling a different story.

    This blog breaks down exactly why backtesting vs live trading results diverge, and how to read your backtest data the right way before you risk a single dollar.

    EXECUTIVE SUMMARY
    • The Problem: Traders trust a clean backtest, then get blindsided when live results look nothing like it.
    • The Solution: Understand exactly what causes the gap—slippage, liquidity, execution delays, and emotions—so you can interpret backtest results realistically.
    • The Incentive: Traders who evaluate backtests correctly avoid chasing strategies that were never designed to survive real market conditions.
    • The Risk: Treating a backtest as a promise instead of a decision-making filter can lead to overconfidence and costly losses once live trading begins.

    What Backtesting Actually Measures

    Look, you ran the backtest.

    Numbers looked great. Green across the board, clean equity curve, the kind of chart that makes you want to size up immediately.

    Then you went live. And it felt like a completely different strategy.

    Studies on retail strategy performance suggest a meaningful share of backtested edge disappears once slippage and execution costs are factored into live results.

    Source: Financial Analysts Journal

    Ser, that gap between backtesting vs live trading isn’t a glitch.

    It’s structural.

    Backtesting works by replaying historical price data through your strategy’s logic, a process laid out in full in CryptoGates‘ crypto backtesting methodology, under conditions that are, honestly, way cleaner than anything you’ll experience with real capital on the line.

    HISTORICAL DATA AUDIT

    Battle-Test Your Strategy
    Before the Market Does.

    Eliminate guesswork with institutional-grade backtesting for DCA, Grid, and Rebalance bots. Real historical data. Real-world results.

    EST. OPTIMIZATION +42% ROI Efficiency
    Start Backtest Now

    Sourced from 5+ Years of Exchange Data

    That stat alone should change how you read every backtest you run.

    Why Historical Data Behaves Differently Than Live Markets

    Here’s the thing about historical candles.

    They’re fixed. Known.

    Every wick already happened, every volume spike already printed. Your strategy gets to react to data that’s already settled into place.

    Live markets don’t work that way. Price is still forming. Liquidity is still moving. The order book you’re staring at right now could look completely different in the next four seconds.

    Real Backtest Example

    Strategy: Grid
    Coin: BNB
    Market Condition: Post-ATH correction, -33% over 79 days
    Objective: Measure how much of a grid bot’s trading activity converts into actual portfolio return during a sustained downtrend
    Key Result: The bot executed 171 trades and generated $163.94 in gross grid profit — yet total portfolio ROI still closed at -21.64%.
    Expert Interpretation: Grid profit and portfolio ROI are two different numbers, and conflating them is one of the most common backtest-reading mistakes. A bot can execute flawlessly, hit every fill, and still finish deeply negative if price closes below the range floor. That gap — clean execution on paper, real loss in the account — is exactly the kind of divergence a backtest can’t warn you about in advance.

    View Complete Playbook: BNB Crashed 33% After Its ATH — Our Grid Bot Lost Less, But Still Lost

    That’s not a small distinction.

    It’s the whole reason backtest vs live trading results diverge in the first place. A backtest never has to guess. Live trading always does.

    This is where things change for most beginners.

    They treat a backtest as a preview of the future instead of what it actually is — a controlled test of logic against the past.

    CryptoGates built its DCA Backtest Bot, Grid Backtest Bot, and Rebalance Backtest Bot specifically so traders could run that logic test on real historical candles before ever touching live capital.

    Verify first. Risk later. That’s the whole point.

    Mark Douglas,
    “In trading and investing, history doesn’t repeat itself, but it does rhyme.”

    Mark Douglas, trading psychologist

    Honestly, that rhyme is exactly what makes backtesting useful and dangerous at the same time.

    Useful because patterns in market behavior do tend to repeat in structure.

    Dangerous because traders start expecting exact repetition instead of rough resemblance.

    The Real Reasons Results Diverge

    Alright, let’s break this down.

    Backtesting vs live trading isn’t just about “the market changed.” There are specific, mechanical reasons your results shift once real money enters the picture.

    CEO Note:

    Zaheer here. I’ve seen traders get frustrated when live results don’t match a backtest, but the backtest was never meant to predict the future. It’s meant to filter out strategies that were already broken. That’s the whole value.

    Slippage is the big one.

    Fees eat into returns in ways that are easy to underestimate on paper. Latency means your order doesn’t execute the instant you think it does.

    And emotion, well, emotion doesn’t exist in a backtest at all. Your backtest never panicked and closed a position early.

    You might.

    Swipe to view full data →
    Factor In Backtest In Live Trading
    Order Fill Price Exact price you wanted Slippage changes the fill price
    Liquidity Assumed always available Can disappear during execution
    Emotion No emotional influence Fear and greed affect decisions
    Trading Fees Often simplified or fixed Real fees compound over time

    1. Slippage and Execution Delay

    In a backtest, your order fills at the price you wanted. Clean, instant, exact. Live trading doesn’t offer that courtesy.

    By the time your order reaches the exchange, price may have already moved.

    That gap between expected and actual fill price is what’s known as slippage, and it compounds over hundreds of trades.

    A strategy that looks profitable on a backtest can turn flat, or worse, once execution delay gets factored in.

    2. Liquidity and Order Book Reality

    Here’s an issue a lot of beginners miss. Backtests often assume you can buy or sell at a given price with zero friction. Real order books don’t work like that.

    Research on execution costs shows that thinly traded pairs can see fill prices deviate meaningfully from quoted price during volatile stretches.

    Source: DefiLlama

    If liquidity thins out at the exact moment your strategy wants to execute, you get a worse fill than the backtest ever showed you. This is especially true on lower cap pairs where the order book is thin.

    Grid and Rebalance strategies feel this more than most, since they rely on frequent execution across price levels.

    Does a good backtest guarantee live trading success?

    No. A strong backtest means the logic held up historically. It doesn’t account for slippage, liquidity gaps, or your own behavior once real capital is at risk.

    How to Read Backtest Results the Right Way

    Wait, before we go further, here’s a mindset shift that matters more than any indicator. A backtest isn’t a promise. It’s a filter.

    Treat it like one. Its job is to weed out strategies that were never going to work in the first place.

    If your strategy can’t survive a clean historical test, it definitely won’t survive live conditions with slippage, fees, and your own emotions stacked on top.

    Before You Trust a Backtest

    • Include realistic slippage and trading fee assumptions.
    • Verify the strategy performs across multiple coins or timeframes.
    • Look for a realistic drawdown instead of a perfectly smooth equity curve.
    • Test the strategy during highly volatile market conditions.
    • Ask whether you would trust the strategy without seeing the backtest chart.

    1. Signs a Strategy Is Overfit to the Past

    This is where things get interesting.

    A strategy that performs suspiciously well on a backtest, like unrealistically well, is often overfit.

    That means it’s been tuned so tightly to past price action that it basically memorized the test instead of learning a repeatable edge.

    Research Highlight

    A pattern shows up repeatedly across CryptoGates Grid Playbooks: the strategies that trade most frequently across tight price levels are also the ones most exposed to order book thinning.

    In one backtest, a grid bot fired 1,759 trades across a single pair in just 38 days — a trade frequency that assumes liquidity is sitting there at nearly every level, every single time.

    In live markets, that assumption is usually the first one to break, and it breaks fastest on pairs outside the top few by volume.

    View Complete Playbook: SUI Fell 7% in 38 Days — Our Grid Bot Fired 1,759 Trades and Banked +7.46%

    Signs of overfitting: too many parameters, results that only work on one specific coin or timeframe, and drawdowns that look nonexistent.

    Real markets don’t produce zero-drawdown strategies. If your backtest shows that, something’s off.

    2. What is overfitting in a crypto trading strategy?

    Backtesting vs live trading will always show some gap.

    That’s not a flaw; it’s just reality.

    Slippage, liquidity, execution delay, and your own behavior all show up once real capital is involved, no matter how clean the backtest looked.

    SYSTEM ACCESS: CG4.2

    Stop Guessing.
    Stress Test Your Edge.

    The market doesn’t care about your backtest. Our engine simulates 1,000+ “what-if” scenarios to ensure your strategy is built for survival.

    Run Crypto Strategy Engine →
    ROBUSTNESS SCORE
    75+ STRUCTURAL EDGE
    RISK OF RUIN < 1%
    TARGET HIT 92%

    Ser, the point was never to eliminate that gap.

    It’s to narrow it enough that you’re trading a strategy with real, tested logic instead of a guess dressed up as a plan.

    Backtesting filters out the bad ideas.

    Live discipline decides what happens with the good ones. Run your own parameters on the DCA Backtest Bot, Grid Backtest Bot, or Rebalance Backtest Bot and see what the data actually shows before you risk anything live.

    FAQs

    Why does live trading perform worse than backtesting?

    Live trading adds slippage, fees, execution delay, and emotional decisions that a backtest never has to deal with. Historical data is fixed, live markets aren’t.


    Not exactly, no. You can get close with realistic slippage and fee assumptions, but live execution always carries some unpredictability a backtest can’t fully simulate.


    A small gap is expected and healthy. A massive gap usually points to overfitting, unrealistic backtest assumptions, or execution issues worth investigating.

  • What Is OHLCV Data 📊? Why CryptoGates Uses 1-Minute Candles ⏱️ for More Reliable Backtests 🎯

    What Is OHLCV Data 📊? Why CryptoGates Uses 1-Minute Candles ⏱️ for More Reliable Backtests 🎯

    You hit “run backtest,” watch the numbers load, and trust whatever comes out.

    Ser, have you ever actually asked what’s feeding that result?

    Retail traders who rely on backtests using low-resolution daily data see live performance deviate by wide margins compared to what the backtest predicted, according to quant research from academic trading studies

    (Source: Journal of Financial Data Science)

    Every strategy score, every Robustness number, every Risk of Ruin percentage traces back to one thing: OHLCV data.

    Get the resolution wrong, and your entire backtest is just an expensive guess wearing a lab coat.

    Most beginners skip this part completely.

    That’s exactly why so many “profitable” backtests fall apart the moment real capital touches them.

    EXECUTIVE SUMMARY
    • The Problem: Most traders don’t know what data actually powers their backtest results, so they trust numbers built on shaky ground.
    • The Solution: OHLCV data, especially at 1-minute resolution, gives you the full picture of price action instead of a rounded summary.
    • The Incentive: Understanding this helps you read Strategy Engine results with real confidence instead of blind faith.
    • The Risk: Trusting a backtest built on low-resolution candles can hide slippage, fake breakouts, and wicks that would’ve wrecked a live account.

    What Is OHLCV Data, Really?

    OHLCV isn’t some complicated quant term.

    It’s just five numbers stacked on top of each other. Open. High. Low. Close. Volume.

    Every single candlestick you see on a chart, no matter the timeframe, is built from these five data points.

    Once you get this, charts stop looking like random shapes and start looking like a story.

    Swipe to view full data →
    Letter What It Means Why It Matters
    O Opening price of the candle Shows where the period started
    H Highest price reached Reveals buyer strength
    L Lowest price reached Reveals seller pressure
    C Closing price of the candle Shows who won the period
    V Volume traded Confirms if the move is real

    1. Open, High, Low, Close Explained

    Think of it like this.

    The open is where a fight starts. The high and low are how far each side pushed before the bell.

    The close is who’s standing at the end. imo this is the part most beginners actually understand fine. It’s the fifth letter that trips people up.

    2. Volume – The Ignored Fifth Metric

    Here’s the thing.

    Price without volume is just a rumor. A big green candle on low volume?

    Could be nothing.

    Could be a trap.

    But a big green candle backed by heavy volume- that’s smart money showing up. Volume is what separates a real breakout from a fakeout that’s about to reverse and rug the late buyers.

    Research Insight

    Many traders treat a big price move as proof enough that something real is happening. But price alone can’t confirm intent; volume can.

    A 2025 DOGE stress test shows why that distinction matters at the data layer, not just the chart layer.

    Strategy: DCA Bot
    Coin: DOGE/USDT
    Market Condition: 34.4% price collapse over 60 days, driven by concentrated whale-sized activity
    Objective: Observe how a bot performs when a crash is backed by real volume rather than thin, low-liquidity noise
    Key Result: 13 of 14 sessions closed in profit, including a single 10-order session that deployed $10,491 and still returned $298.54 mid-collapse
    Expert Interpretation: Volume-confirmed moves behave differently than volume-thin noise, even when the percentage drop looks identical on a chart. A backtest built on coarse candles can’t tell the two apart, which is exactly why the volume column exists as a fifth data point and not an optional extra.

    View Complete Playbook: DOGE Crashed 34% in 60 Days, Our DCA Bot Made +$924.23 Anyway

    Why Candle Timeframes Change Everything

    A 1-day candle and a 1-minute candle are technically the same five data points.

    But they tell wildly different stories. Zoom out too far, and you lose the fight entirely. You only see who won, not how brutal the battle actually was.

    HISTORICAL DATA AUDIT

    Battle-Test Your Strategy
    Before the Market Does.

    Eliminate guesswork with institutional-grade backtesting for DCA, Grid, and Rebalance bots. Real historical data. Real-world results.

    EST. OPTIMIZATION +42% ROI Efficiency
    Start Backtest Now

    Sourced from 5+ Years of Exchange Data

    Here’s the interesting part.

    Two assets can have the same daily candle, same open, same close, same everything on paper. But one of them drifted there calmly.

    The other one spiked 8% up, got rejected hard, dumped 6%, then crawled back.

    Same close. Completely different risk.

    What Gets Lost in Bigger Candles

    Daily candles hide intraday traps.

    That sharp wick that would’ve stopped out a real position?

    Gone, smoothed into a single line. That fake breakout that baited retail before reversing?

    Invisible on a daily chart.

    This is where things change for anyone actually trying to test a strategy seriously using a proper Crypto Backtesting Guide, not just eyeball a chart.

    Real Backtest Example

    Most backtests report a single drawdown figure and move on, but that number only makes sense once you know what resolution captured it.

    A 15-day BTC stress window from 2025 illustrates this well.

    Strategy: DCA Bot
    Coin: BTC/USDT
    Market Condition: Sharp 15-day decline, BTC shedding over $10,000
    Objective: Test bot resilience through a fast, non-gradual capitulation
    Key Result: 10 of 11 sessions closed at take-profit, yet the session logged a 95.87% intraday max drawdown reading
    Expert Interpretation: That drawdown number only becomes readable once you know it was measured against the deepest intraday wick, not a rounded daily close. On lower-resolution data, that same crash would have shown up as a smooth, forgiving line, and the strategy would look far safer on paper than it actually behaved in real time.

    View Complete Playbook: We Ran a DCA Bot Through BTC’s Worst Fortnight of 2025

    What is OHLCV data used for in crypto trading?

    OHLCV data is used to build price charts and power backtesting engines. It shows open, high, low, close, and volume for any set time period, giving traders the raw material behind every strategy test.

    But there’s a problem.

    If your backtest never sees these traps, it never learns to survive them either. The strategy looks clean on paper because the data was clean too. Too clean, honestly.

    Why CryptoGates Runs Backtests on 1-Minute OHLCV Candles

    Most platforms backtest on daily or even hourly candles because it’s cheaper and faster. CryptoGates doesn’t cut that corner.

    Every backtest bot, whether you’re testing DCA, Grid, or Rebalance, runs on real 1-minute OHLCV data across major exchanges and coins.

    CEO Note:

    Zaheer put it simply once. “You can’t verify a strategy on data that hides the exact moments it would’ve failed. Test on what the market actually did, minute by minute, or don’t test at all.”

    Ser, that’s not a marketing line.

    That’s the actual difference between a strategy that survives and one that just looked good on a chart.

    How This Affects Your Strategy Engine Results

    Here’s why this actually matters for you.

    The Strategy Engine’s Robustness Score and Risk of Ruin numbers are only as honest as the candles feeding them.

    SYSTEM ACCESS: CG4.2

    Stop Guessing.
    Stress Test Your Edge.

    The market doesn’t care about your backtest. Our engine simulates 1,000+ “what-if” scenarios to ensure your strategy is built for survival.

    Run Crypto Strategy Engine →
    ROBUSTNESS SCORE
    75+ STRUCTURAL EDGE
    RISK OF RUIN < 1%
    TARGET HIT 92%

    Run 10,000 trade permutations on rounded, low-resolution data, and you get a confident-looking score built on a shaky foundation.

    Run it on granular 1-minute data and the Monte Carlo Cloud actually reflects what could happen in a real market, not a smoothed-out fantasy version of one.

    What This Means for Your Strategy

    Cheap data creates expensive confidence.

    That’s the whole problem in one line.

    A strategy can backtest beautifully on daily candles and still get rekt live, simply because the backtest never saw the conditions that would’ve broken it.

    Garbage In, Garbage Out

    A backtest is only as trustworthy as what’s feeding it.

    Feed it low-resolution, rounded, incomplete data, and you’ll get a result that flatters your strategy instead of stress-testing it.

    Strategies backtested on granular intraday data typically show meaningfully wider drawdown ranges than the same strategy tested on daily candles alone, per quantitative backtesting research

    (Source: CFA Institute Research Foundation)

    Feed it real 1-minute OHLCV data, and you get something closer to the truth, even when that truth is uncomfortable.

    Why does candle timeframe matter for backtesting accuracy?

    Smaller timeframes capture intraday price swings, wicks, and volume spikes that larger candles smooth over. This means a strategy tested on 1-minute data gets exposed to real market chaos instead of a simplified version of it.

    Data Quality Is the Real Edge

    At the end of the day, OHLCV data is the foundation of any sound crypto backtesting methodology, the layer every backtest sits on.

    Get the resolution wrong, and you’re not testing a strategy; you’re testing a fantasy version of the market that never actually existed.

    CONFIDENTIAL // RESEARCH
    STRATEGY INTELLIGENCE

    Proven Setups &
    Expert Breakdowns.

    We don’t just show you the data; we engineer and validate high-performance strategies, providing the “Alpha” behind the numbers.

    CryptoGates runs on 1-minute candles because that’s what separates a real stress test from a comforting story.

    Before you trust any backtest result, including your own, ask what data built it.

    Then run your own parameters through the Crypto Strategy Engine and see what the data shows on real granular candles, not rounded guesses.

    FAQs

    What does OHLCV stand for?

    OHLCV stands for Open, High, Low, Close, and Volume. These five data points make up every candle on a price chart, no matter the timeframe.


    1-minute data captures wicks, slippage, and fake breakouts that daily candles smooth over. This gives a more honest picture of how a strategy would’ve actually performed.


    Yes. Volume confirms whether a price move has real strength behind it or if it’s likely to reverse. Ignoring volume means missing half the story a candle is telling.