

 Bitcoin
 Ethereum
 Solana
 TRON
 Hyperliquid
 Zcash
 Dogecoin
 Monero
 Chainlink
 Cardano
 Stellar
 Uniswap
 Sui
 Hedera
 Shiba Inu
 Bittensor
 Ripple USD
 Aster
 Polkadot
 World Liberty Financial
 Render
 Artificial Superintelligence Alliance

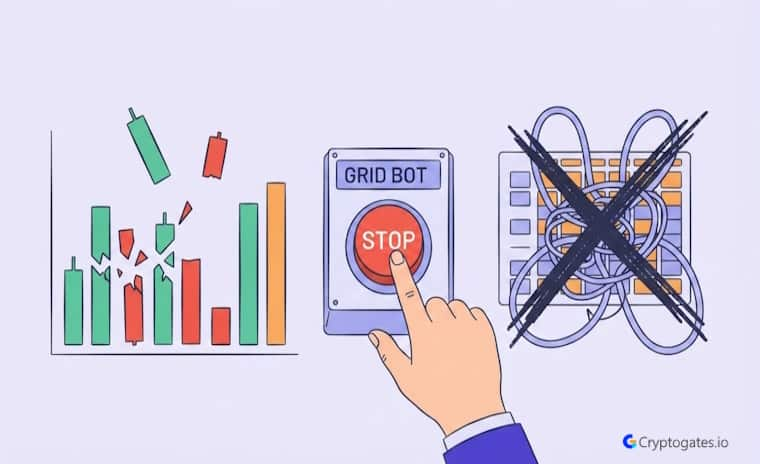
Grid trading sounds simple.
Buy low, sell high, let the bot handle it.
Ser, that’s the pitch everyone sees before they actually run the numbers.
Stat:
Backtesting studies on range-bound strategies show that over 60% of manually configured grid setups underperform simple spot holding once fees and slippage are factored in.
Honestly, most grid trading mistakes don’t show up until you actually stress test a setup against real historical data. This isn’t a theory guide. It’s a look at grid playbooks that failed in backtests, why they failed, and what the data actually revealed once fees, slippage, and volatility were factored in.
Look, if you’ve ever wondered why your “perfect” grid range dumped your capital during a trend, you’re about to find out.
- The Problem: Most grid strategies get built on assumptions, not backtested proof, and that gap shows up fast in choppy or trending markets.
- The Solution: Reviewing failed grid playbooks reveals the exact settings, pair choices, and missing risk controls that broke each strategy.
- The Incentive: Traders who study these failures can fix range, spacing, and exit logic before risking real capital on a live bot.
- The Risk: Grid bots can still lose money even after backtesting, especially in strong trends or with poor pair selection. This isn't financial advice.
Why Grid Trading Fails in Real Markets
Grid trading depends on one thing more than any other:
Market structure.
The strategy shines in a range. It struggles the moment price picks a direction and just… keeps going.
Here’s the interesting part. A lot of traders blame the market when their grid bot underperforms. But usually, it’s not the market’s fault at all.
Volatility mismatch is one culprit. Range breakdown is another. And execution risk, meaning slippage and fee drag on every single fill, quietly eats returns that looked fine in a spreadsheet.
Wait, here’s the thing, though. Most grid failures don’t come from the idea of grid trading being bad. They come from bad settings applied to the wrong conditions.

"A grid strategy is only as good as the range it's built for. Test the range against multiple regimes before you trust it." — Sajid, Strategy & Research, CryptoGates
What Makes a Grid Strategy Structurally Fragile
A grid setup can look airtight on paper and still fall apart live.
Why?
Because backtests with only one market condition don’t expose the cracks.
Fragility usually comes from three things stacking together:
A range that’s too narrow for the asset’s real volatility, fee assumptions that don’t match the exchange’s actual cost structure, and a zero plan for what happens when price breaks out.
Any one of these alone might be survivable. All three together, and you’re looking at a strategy that was never really tested. Just assumed.
Failed Grid Playbooks — Range and Frequency Errors
CT loves to say “the numbers don’t lie.” Well, these ones didn’t.
Too Tight Grid Range
The setup looked clean: a narrow price range around the current spot price, with frequent orders designed to catch small moves. On paper, it looked busy and profitable.
Reality check: Small range movements often can’t cover transaction costs, especially across dozens of trades a day.
| Setup Elemen> | Assumption | Backtest Reality |
|---|---|---|
| Range width | Narrow, tight to price | HToo tight for real volatility |
| Trade frequency | High | Fees exceeded per-trade edge |
| Net result | Assumed profitable | Gross gains erased by costs |
Backtest Result & Lesson Learned
Low gross profit. Fee drag erased most of the gains. Too many trades chasing too little edge per fill.
The lesson?
Grid ranges need enough width to produce real net profit after costs. A tight grid isn’t precision. It’s usually just overfitting dressed up as a strategy.
Reality Check
Common belief: A grid bot just needs to be “running” to capture profit — the range will sort itself out.
What CryptoGates research found: In an April BTC backtest, the 7-day range sat above the live market, leaving the bot completely idle for three weeks while BTC climbed from $82,550.
By the time price finally entered the zone, a late 50-trade cluster only managed a 7.35% monthly yield — well behind the 14.15% buy-and-hold return over the same window.
Why it matters: The bot’s logic wasn’t broken. The range was simply placed wrong relative to where price actually was. This mirrors the “too tight” range failure above — except here the range wasn’t tight, it was just badly positioned. Range calibration, not grid density, is usually the real point of failure.
View Complete Playbook: https://cryptogates.io/playbooks/btc-surged-14-in-april-our-grid-bot-caught-only-the-last-week/
Too Many Grids
This one’s a classic degeneracy mistake dressed up as sophistication. High grid count, tiny spacing, constant order execution. It feels active. It feels like the bot is “working.“
But there’s a problem. More trades don’t automatically mean more profit. In this backtest, the bot generated a genuinely high trade count, and the per-trade profit was so thin that fees consumed most of the return.

CryptoGates Strategy Lab
Backtest Result & Lesson Learned
Grid spacing has to be aligned with actual volatility and the exchange’s fee structure, not just squeezed tighter for more activity. Over-gridding usually destroys ROI instead of boosting it.
You can actually run these scenarios yourself using the Grid Strategy Backtest Bot before assuming any spacing setting is “safe.“
Futures Grid in a Strong Trend
Now imagine this.
Leverage on top of a grid bot, running in a market that just won’t stop trending. That’s the setup here.
Leverage amplifies both sides of the trade, gains and losses. The problem is that a grid bot doesn’t know it’s losing until the drawdown is already deep. It just keeps averaging into the wrong side of the move, buying dips that keep dipping.
Unfortunately,
This is where a lot of degenerate capital gets rekt. Not because leverage is inherently bad, but because it was paired with a strategy that assumes the price stays in a box.
Real Backtest Example
Strategy: Grid | Pair: BNB/USDT | Market Condition: Post-ATH downtrend (-33% over 79 days) | Objective: Test whether grid logic holds up once price breaks range and keeps trending down.
The bot fired 171 trades and generated $163.94 in grid profit — numbers that look healthy in isolation. But total ROI still landed at -21.64%. The gap between “grid profit” and actual portfolio result is exactly the kind of trap this article keeps circling back to: a bot can be executing its logic perfectly and still lose money, because grid profit only measures the trades it closed, not the unrealized bag it’s holding below the range.
Expert Interpretation: This is the clearest evidence that a grid strategy without a defined exit condition isn’t protected by its own trade count. Activity isn’t the same as performance.
View Complete Playbook: https://cryptogates.io/playbooks/grid-bot-vs-a-33-bnb-crash-what-the-backtest-data-actually-shows/
Backtest Result & Lesson Learned
Rising drawdown. Margin pressure building with every leg down. Real risk of liquidation or capital getting trapped with no exit.
The Takeaway:
Futures grid bots need strict trend awareness and real risk controls. Trend-heavy markets are genuinely dangerous territory for leveraged grid setups.
If BTC’s showing clean higher highs or lower lows, a range-bound grid bot on leverage is fighting the trend, not trading with it.

Not well. Grid bots are built for range conditions. In a strong trend, price keeps moving away from the grid's center, and the bot ends up holding losing positions instead of taking profit.
Failed Grid Playbooks — Selection and Risk Errors
Some mistakes aren’t about the grid settings at all. They’re about what you’re trading, and whether you’ve built in a way out.
Wrong Pair Selection
Here’s what most beginners miss. A good grid strategy on an illiquid or erratic pair can still fail badly.
Spread, slippage, and unstable order fills all get worse on thin order books. A pair with clean price behavior on a major exchange behaves nothing like a low-cap coin with sketchy liquidity.

"We've seen the same grid logic perform completely differently depending on the pair. Test the strategy, but test the pair too. They're not separate decisions."
Backtest Result & Lesson Learned
Inconsistent fills.
Poor execution quality.
Lower than expected net returns, even when the underlying grid logic was sound.
Pair selection matters just as much as grid spacing or range. Liquidity and clean price behavior aren’t optional extras.
They’re part of the strategy itself.
No Stop-Loss or Pause Logic
Here’s the issue.
A grid bot left running blindly through a strong trend has no idea when to stop. It just keeps buying or selling inside a range that the price has already left behind.
A strategy without an exit rule isn’t really a complete strategy.
It’s half of one.
CryptoGates Strategy Lab
Backtest Result & Lesson Learned
Deep unrealized losses. Capital trapped outside the range the bot was designed for. No recovery path once the breakout happened.
Every grid strategy needs a stop-loss, a pause condition, or some kind of emergency exit plan.
Ngl,
This is the one traders skip most often because it feels like it “ruins” the passive nature of the bot. It doesn’t. It just makes the bot survive.
Backtest Chosen Only on Best Period
This mistake is sneaky because it doesn’t feel like a mistake at all. It feels like proof.
The setup gets optimized on one favorable window, say, a clean sideways month, and the results look incredible. Strong returns, low drawdown, smooth equity curve.
Confidence goes way up.
But here’s the key idea. That confidence is built on a single sample. Test the same settings against a different regime, a trending month, or a high-volatility stretch, and performance either weakens or turns negative.
Backtest Result & Lesson Learned
Strong results in one sample. Weak or negative performance everywhere else. Classic overfitting, and honestly, one of the more common traps in CT strategy sharing when someone posts a single clean backtest as “proof.“
A robust grid strategy needs to survive multiple market conditions. Not just the one lucky period someone happened to test it on.
Why Failed Playbooks Are More Valuable Than Theory
Polished tutorials show you what’s supposed to work. Failed playbooks show you what actually breaks, and that’s a very different kind of education.
Seeing a strategy fail in a backtest teaches practical lessons that theory never quite gets across. Market realism beats hypothetical performance every time.
Once you understand why a setup broke, you understand the strategy itself at a much deeper level.
Turning Failure Into Strategy Refinement
This is the part most content skips. It’s easy to show wins. It’s more useful to show where the edge disappeared and why.
That’s the whole idea behind strategy refinement. You don’t get a robust grid setup by getting lucky once. You get it by testing, failing, adjusting, and testing again until the strategy survives conditions it wasn’t originally built for.
Grid trading mistakes almost always show up in the backtest before they ever show up as a real loss.
Too tight a range, too many grids, the wrong pair, no exit plan, or a setup that only ever got tested on one good month. Every failure here had a fingerprint, and every fingerprint was visible in the data before any capital was actually at risk.
The goal was never to prove grid trading doesn’t work. It clearly can. The goal is to make it smarter, safer, and genuinely robust before you automate it. Test this setup yourself → cryptogates.io.
FAQs
What's the most common grid trading mistake in backtests?
Choosing a range too tight for the asset’s real volatility. It looks active but fees usually erase the gains.
Does grid trading work in a trending market?
Not reliably. Grid bots are built for range conditions and tend to lose ground when price trends hard in one direction.
How do I know if my grid strategy is actually robust?
Test it across multiple market regimes, not just one favorable period, and review drawdown alongside ROI.