

 Bitcoin
 Ethereum
 Solana
 TRON
 Hyperliquid
 Zcash
 Dogecoin
 Monero
 Chainlink
 Cardano
 Stellar
 Uniswap
 Sui
 Hedera
 Shiba Inu
 Bittensor
 Ripple USD
 Aster
 Polkadot
 World Liberty Financial
 Render
 Artificial Superintelligence Alliance

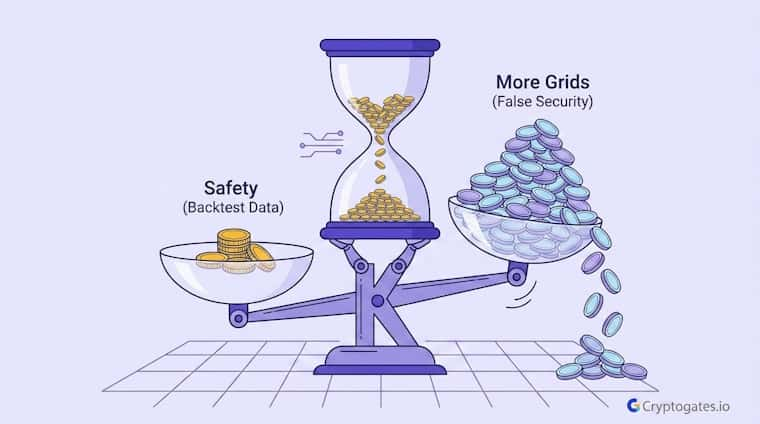
Ser, if you’ve ever set up a grid bot, you’ve probably asked yourself one question.
Should you add more grids? It feels safer, right?
More fills, more action, more control over the chop.

Here’s the thing, though: in grid trading, the number of grids you choose changes your exposure, not your protection.
We ran three identical tests on LINK, changed only the grid count, and watched what happened when the range actually broke down.
The results might surprise you.
- The Problem: Traders assume adding more grids to a bot automatically means less risk and better performance.
- The Solution: Isolating grid count as the only variable shows what it really controls, fill frequency and capital exposure inside a range.
- The Incentive: Once you understand what grid density actually does, you can size it around your risk tolerance instead of guessing.
- The Risk: A range breakdown punishes high grid density by converting more of your capital into buy fills on the way down.
What "Number Of Grids" Actually Controls In A Grid Bot
Let’s break this down.
A grid bot doesn’t predict direction.
It just places buy and sell orders across a price range you set, then waits. The number of grids decides how many of those orders exist inside that range.
| Grid Count | What Increases | What It Doesn't Change |
|---|---|---|
| Low (15) | Spacing between orders | The price range itself |
| Medium (40) | Fill frequency | Whether the range holds |
| High (70) | Capital committed per swing | Trend direction risk |
More grids mean tighter spacing between orders.
Fewer grids mean wider spacing. That’s it. It doesn’t change whether the range holds. It doesn’t add any kind of safety net underneath your position.
Honestly, a lot of traders skip past this and jump straight to ‘more grids equals more trades equals more profit,’ a shortcut that shows up again and again in common grid trading mistakes once you actually look at what those extra trades are doing to your exposure.
Why Beginners Assume More Grids Means Less Risk
More fills feels like more control.
Every time the bot buys and sells, it looks like the system is working, doing something, staying active. But here’s what actually matters, and it’s a point Binance itself makes about grid bots: bots aren’t infallible, and each additional grid line is another order sitting in the market, ready to execute. That’s not a safety mechanism.
Real Backtest Example
Strategy: Grid
Coin: NEAR/USDT
Market Condition: 45-day range-bound test comparing three grid densities
Objective: Isolate grid count as the only variable to see which density actually converts range activity into real returns
Key Result: Across 20-grid, 45-grid, and 80-grid configurations run on the same NEAR range, only the 45-grid setup – the middle density – beat Buy & Hold, landing at 17.18% ROI. Neither the tightest nor the widest spacing came out ahead.
Expert Interpretation: This mirrors what the LINK test above shows: adding more grids doesn’t scale performance in a straight line. A middle-ground density that balances fill frequency against capital exposure tends to outperform both extremes – tightest and widest – more consistently than either.
Playbook: 20 Grids, 45 Grids, 80 Grids 🔀: Only One Beat Buy & Hold on NEAR 📊 🏆
That’s just more of your total investment getting distributed across smaller price movements inside the same range you already picked.
The Setup - Isolating Grid Density As The Only Variable
We tested LINK/USDT from May 15 to July 15, 2025. Same 30-day price range, same arithmetic grid spacing, same 3% profit-per-grid target, same fees.
The only thing that changed across the three tests was the grid count: 15 grids, 70 grids, and 40 grids.

"The point isn't finding a strategy that looks good once. It's finding out exactly which setting caused which outcome, so you're not gambling on assumptions later."
This kind of isolated testing matters more than people realize.
If you change the range, the grid count, and the profit target all at once, you have no idea which variable actually caused your result. Sir, that’s not a backtest.
That’s just noise dressed up as data.
Why This Test Isolates One Parameter
Changing one variable at a time is the basic scientific method, but it gets ignored constantly in crypto strategy talk.
If grid count is the only thing that moves between tests, then any difference in ROI, drawdown, or fill count comes from that one change.
Reality Check
Common belief: A grid bot’s “grid profit” figure is the same thing as its actual return — if the bot is generating steady grid profit, the strategy is working.
What CryptoGates research found: In a 79-day BNB grid test through a 33% post-ATH crash, the bot fired 171 trades and generated $163.94 in grid profit — a number that looks healthy in isolation. But once the range broke down and unrealized losses on open positions were counted, total ROI still landed at −21.64%.
Why it matters: Grid profit only measures completed buy-sell cycles inside the range. It says nothing about capital sitting in open positions below the range floor when a breakdown happens — which is exactly the exposure this article’s 70-grid LINK test ran into. Reading grid profit without checking drawdown is how a bot can look profitable and still lose money overall.

Not really. Grid bots are built for sideways, range-bound price action. When a market trends hard in one direction and breaks out of the set range, the bot keeps buying into a falling price or misses upside it never captured on the way out.
Nothing else.
That’s the whole point of running it through a backtest bot instead of just eyeballing a chart and guessing.
What Happened When The Range Broke Down
Here’s the interesting part.
LINK spent weeks chopping sideways inside that 10.94 to 16.47 range, then a broader market sell-off broke it clean through the lower boundary.
No bounce back. No mean reversion. Just a slide.
In the 70-grid version, that density meant way more buy orders sitting closer together near the bottom of the range, the same dynamic that turned up when we ran a grid bot through a 33% BNB crash.
As price kept sliding through them, the bot kept catching falling knives, filling buy after buy, committing more and more capital into a position that kept losing value before any sell trigger came back into play.

"Risk comes from not knowing what you're doing." - Warren Buffett
Wait, that’s not quite the full picture, though.
It’s not that the 70-grid test performed badly overall; it actually posted the highest raw ROI at 2.75%. But that number hides what happened underneath it.
Max drawdown on the tighter, denser setup ran deeper than the wider-spaced version because more of the total investment got pulled into buy fills during the breakdown instead of staying in cash, waiting for the range to hold.
Proven Setups &
Expert Breakdowns.
We don't just show you the data; we engineer and validate high-performance strategies, providing the "Alpha" behind the numbers.
Why More Grids Converted Into More Exposure, Not More Safety
Every grid line is a standing buy order.
That’s not an opinion; that’s just how the bot works.
When price falls through a dense cluster of grid lines, it triggers a cluster of buys in quick succession.
Each one commits more capital at a lower price, and if the range doesn’t recover, that capital sits underwater.
Fewer, wider grids mean fewer of those buys trigger during the same drop. Less capital gets committed on the way down.
What The Data Actually Rewarded
Look at the 40-grid test, the one actually used as the Playbook reference here.
It landed in between the other two, 330 trades, 176.41 USDT in grid profit, a 2.90% ROI. Not the flashiest fill count, not the lowest either.
CryptoGates Grid Strategy Backtest Bot
What stands out is the balance.
It caught enough of the range-bound chop to generate solid grid profit, without pushing as much capital into the breakdown zone as the 70-grid version did.
Total fees paid came in at 14.0171 USDT against a 24.39% max drawdown, numbers that only make sense when you’re comparing all three tests side by side.
Reading Grid Profit Against Drawdown, Not ROI Alone
Here’s the key idea.
ROI alone doesn’t tell you how rough the ride was to get there.
A setup with a slightly lower ROI but a noticeably smaller drawdown might be the one you can actually stomach holding through, without panic-closing the bot halfway through a downtrend.
Not automatically. More grids increase fill frequency, but they also increase how much capital gets committed during a sharp move. In volatile or trending conditions, wider spacing with fewer grids often limits how much exposure builds up if the range fails.
That’s the kind of thing raw percentage returns tend to hide.
Grid Count Is A Risk Setting, Not A Performance Hack
So, is more grids better?
Not really, not automatically.
What this test actually shows is that grid count controls how much capital gets exposed during a breakdown, not whether your strategy survives one.
The smartest move isn’t copying someone else’s grid number from a YouTube video.
It’s running your own parameters through a backtest and seeing what the data shows for your pair, your range, and your risk tolerance.
Before You Set Your Grid Count
- Confirm the price range you're testing actually reflects recent volatility, not just a random guess
- Run at least two grid density levels through a backtest before picking one
- Check max drawdown alongside ROI, not ROI on its own
- Compare results against a simple Spot Buy & Hold benchmark for the same window
- Reassess grid count if the market shifts from ranging to trending
Test your own grid density using the Grid Strategy Backtest Bot before you commit real capital to any setup.
Battle-Test Your Strategy
Before the Market Does.
Eliminate guesswork with institutional-grade backtesting for DCA, Grid, and Rebalance bots. Real historical data. Real-world results.
FAQs
Does adding more grids to a grid bot increase profit?
Not automatically. More grids increase how often the bot trades, but that also means more capital gets committed during price swings. Profit depends on whether the range holds, not just grid count.
What happens to a grid bot when the price breaks out of its range?
The bot keeps executing orders based on the original range, so it can end up buying into a falling price or missing a move if price runs above the upper boundary without selling into it.
How many grids should a beginner use in a grid trading bot?
There’s no fixed number that works everywhere. It’s better to backtest a few different grid counts on your specific pair and range before choosing one, rather than copying a setup from someone else.