

 Bitcoin
  Ethereum
  Solana
  TRON
TRON  Zcash
Zcash  Hyperliquid
  Dogecoin
  Monero
  Chainlink
  Cardano
  Stellar
  Uniswap
  Sui
Sui  Hedera
  Bittensor
  Shiba Inu
  Ripple USD
  Polkadot
  Aster
Aster  World Liberty Financial
  Render
  Artificial Superintelligence Alliance
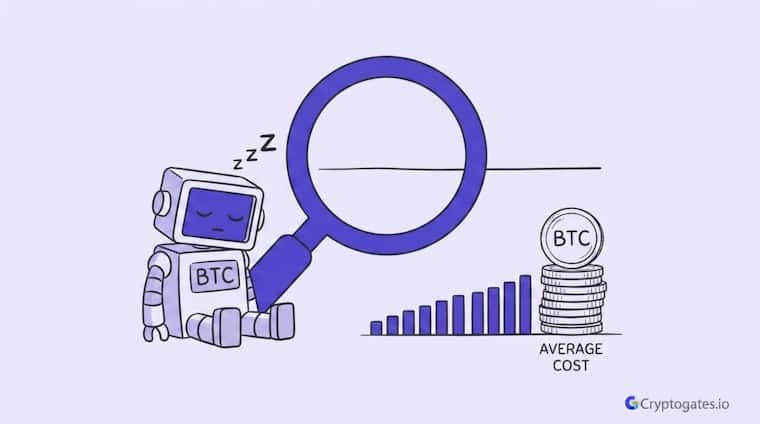
Bitcoin just sat there for weeks.
No pump, no dump, just a flat line that makes you check the app less and less.
If you’re running a DCA Bitcoin sideways market strategy right now, this silence probably feels wrong.
Like something’s broken.

Here’s the thing.
Nothing’s broken. Your bot is still buying. Your average cost is still moving. It’s just not exciting, and that’s exactly what trips people up.
Most traders are wired for action. Chop feels like a failure even when the math says otherwise.
- The Problem: A flat, boring Bitcoin market makes DCA feel pointless, so people second-guess their strategy or stop it early.
- The Solution: Understand what DCA is actually doing during chop, averaging cost quietly instead of chasing price moves.
- The Incentive: Staying disciplined through boring phases usually sets up a better average entry before the next real move.
- The Risk: Sideways markets can drag on longer than expected, and DCA won't outperform every single scenario. It's not magic.
What a Slow Boring Market Actually Means for Bitcoin
A sideways market is when the price moves in a tight range without committing to a direction. Up 2%, down 2%, repeat.
No breakout, no breakdown, just chop. Traders call this range-bound action, and honestly, it’s one of the hardest environments to sit through.

Zaheer often says the market doesn't owe you excitement. Boring price action isn't a signal to panic, it's a signal to check your data instead of your emotions.
Look, bull runs are easy to love, and bear markets at least give you a clear story: fear, panic, capitulation.
A sideways market gives you nothing. No narrative. No dopamine hit. Just candles going nowhere on the chart.
Why Sideways Markets Confuse Beginners
New traders expect constant movement because that’s what gets shown on CT and in trading content.
Big green candles, big red candles, drama. When Bitcoin just idles, beginners assume they’re missing something or that their strategy stopped working.
Stop Guessing.
Stress Test Your Edge.
The market doesn't care about your backtest. Our engine simulates 1,000+ "what-if" scenarios to ensure your strategy is built for survival.
Run Crypto Strategy Engine →But there’s a problem with that assumption.
Chop isn’t the absence of activity.
It’s often accumulation, quiet buying and selling that eventually resolves into a bigger move.
You just can’t see it happening in real time.
What DCA Is Really Doing Behind the Scenes
Dollar Cost Averaging doesn’t care if the market is exciting.
It buys on a schedule, regardless of mood, regardless of headlines.
That’s the entire point.
While price is stuck in a range, your bot is still executing, still averaging, still working toward a lower or more balanced cost basis.

Andreas M. Antonopoulos
That slow trust-building mirrors what DCA does on a smaller scale. It’s not trying to time a bottom. It’s trying to survive the noise.
1. How Your Average Cost Moves During Chop
During a range, you’re buying dips and buying small rallies too.
This averages your entry somewhere in the middle of that range, not at the top and not at the exact bottom. It’s not perfect, but it’s not supposed to be.
Ngl, this is the part most beginners skip past.
They want the bot to be a prediction machine. It’s not. It’s an averaging machine.
Real Backtest Example
Strategy: DCA Bot
Coin: BTC/USDT
Market Condition: Sideways-to-bearish, low-volatility month
Objective: Test how small-step DCA performs when price barely moves in a clear direction
In one of our internal backtests, BTC spent a full month drifting lower by just 2%, the kind of flat, directionless action that makes traders assume nothing productive is happening.
The DCA bot ran 8 sessions during that stretch, and 7 of them closed in profit, ending the month up 1.93% overall.
No single trade was dramatic. The result came from the bot quietly averaging entries across the small dips and minor rallies inside the range, exactly the mechanic described above.
Expert Interpretation: The takeaway isn’t that DCA beats every sideways month by a wide margin, it’s that consistent execution during chop compounds into a positive result even when the price chart shows almost nothing happening.

Yes, it keeps averaging your entry regardless of duration. The tradeoff is your capital sits deployed longer without a clear payoff, which tests patience more than strategy.
2. Why Nothing Happening Is Misleading
A flat price chart hides a lot.
Wallet accumulation, exchange outflows, and long-term holder behavior can all shift quietly while price stays boring on the surface.
That’s usually when smart money is positioning, not panicking.
Research Insight
Many traders assume a flat price chart means a strategy is stuck or underperforming.
Our internal testing on TRX told a different story. Over a 105-day post-ATH correction with no clean bounce, essentially a slow, choppy grind rather than a sharp crash, a DCA bot still closed 27 of 28 sessions in profit. The price action looked unremarkable the entire time, similar to the kind of “nothing happening” chart described above.
This matters because it separates two things traders often confuse: price stagnation and strategy failure. The bot wasn’t reacting to a story or a trend, it was averaging through a market that gave it no clear signal at all, and it still worked.
That’s consistent with the idea that quiet accumulation phases can hide productive positioning even when nothing visible is occurring on the surface.
The Real Risk of DCA in a Sideways Market
Here’s the honest part most content skips.
DCA isn’t risk-free just because it’s steady. During long chop, your capital is committed but not growing. That’s opportunity cost, and it’s real.
Wait, that doesn’t mean DCA is bad.
It means it’s not automatically the best choice in every single market condition, either.
Anyone selling it as a guaranteed win isn’t being straight with you.
When DCA Underperforms Lump Sum or Waiting
If you already have a strong conviction that price is near a bottom, a lump sum entry can outperform DCA once the market actually breaks out.
DCA sacrifices some upside in exchange for reducing the risk of buying at the exact wrong moment.
The simple truth is DCA is a risk management tool first, a return maximizer second.
Confusing the two is where expectations get messed up.
How to Know if Your DCA Strategy Is Still Working
Checking daily price during a boring market is honestly a bad habit. It tells you almost nothing useful and just adds stress.
Here’s what actually matters instead.
Interactive Checklist
- Track your average cost basis, not daily price
- Watch total accumulated position size over time
- Compare your average entry to key historical support zones
- Note how many buys have executed on schedule
- Review the range's overall trend direction, not single candles
1. What to Track Instead of Daily Price
Your average cost trend line will usually tell a calmer story than the price chart does.
If it’s holding steady or slowly improving, the strategy is doing exactly what it’s designed to do.
| Market Type | What DCA Does | What Traders Feel |
|---|---|---|
| Bull Run | Buys rise steadily, average cost climbs | Excited, confident |
| Bear Market | Buys dips aggressively, average cost drops fast | Fearful, doubtful |
| Sideways | Buys stay flat, average cost barely moves | Bored, uncertain |
This is where running your own numbers helps more than guessing.
The DCA Backtest Bot lets you simulate exactly how a sideways period would’ve affected your average cost, using real historical data instead of vibes.
2. Is it worth pausing DCA during a sideways market?
Pausing defeats the purpose since DCA works by staying consistent through every phase.
Stopping during chop usually means restarting later at a worse average, not a better one.
The Bottom Line on DCA During Slow Markets
Boring markets test discipline way more than bull runs ever will.
Anyone can stick to a plan when the price is mooning. Sticking to it when nothing’s happening, that’s the actual hard part, and it’s usually where the strategy earns its keep.
Battle-Test Your Strategy
Before the Market Does.
Eliminate guesswork with institutional-grade backtesting for DCA, Grid, and Rebalance bots. Real historical data. Real-world results.
CryptoGates was built around verifying strategies before trusting them blindly, especially in conditions that don’t feel exciting.
If you’re unsure how your DCA setup would’ve handled a real sideways stretch, run it through the DCA Backtest Bot and look at your own numbers instead of guessing.
FAQs
Does DCA work in a sideways Bitcoin market?
Yes, it keeps averaging your entry regardless of price direction. The tradeoff is your capital sits flat longer without a clear payoff.
How long can a sideways Bitcoin market last?
There’s no fixed timeline. Ranges have historically lasted anywhere from a few weeks to several months before resolving into a trend.
Should beginners avoid DCA during low volatility periods?
Not necessarily. Low volatility is actually where DCA’s steady approach reduces emotional decision making the most.