Bitcoin
  Ethereum
  Solana
  TRON
TRON  Hyperliquid
  Dogecoin
  Zcash
Zcash  Cardano
  Stellar
  Hedera
  Sui
Sui  Shiba Inu
  Bittensor
  World Liberty Financial
  Aster
Aster  Ripple USD
  Polkadot
  Render
  Artificial Superintelligence Alliance
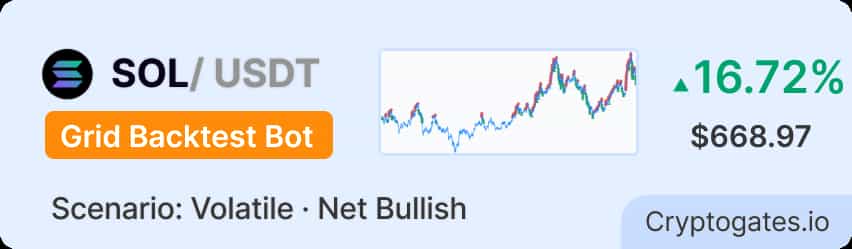
SOL entered a free-fall. The bot entered a grid.
SOL opened March 5 at $148.18 — already in retreat from its February highs, caught in a broader market that had turned nervous.
By April 18, it closed at $124.54. That’s a $23.64 drop, a 15.95% loss for anyone holding spot.
For a grid bot configured between $122.68 and $147.48? That’s 44 days of price oscillating directly inside its hunting zone.
The question we ran this backtest to answer: can a tightly calibrated 7-day grid extract meaningful profit from an asset that’s actively falling? Here’s what the numbers say.
Strategy Parameters
How Each Setting Impacted Performance?
Grid bots aren’t complex — but the relationship between parameters and outcomes is.
Every setting in this backtest left a measurable fingerprint on the results.
Parameter Impact Summary
| Parameter | Impact | The Logic (Why) |
|---|---|---|
| Price Range $122.68–$147.48 | 🎯 Defines profitability zone | SOL stayed mostly inside range |
| 20 Grids | 🔁 High trade frequency | More levels, more triggers |
| Arithmetic Spacing | ⚖️ Consistent profit cycles | Equal spacing, equal gains |
| $50 Grid Size | 💰 Most capital idle | Fixed capital per level |
| 2% Profit/Grid | 📈 Reliable profit capture | Matched SOL's oscillation depth |
| 0.1% Fee Rate | ⚠️ Moderate fee drag/td> | 348 trades amplified fee cost |
348 trades. $138.62 grid profit. $0.27 net per completed cycle.
💰 The Bottom Line:
This strategy delivered $92.71 net profit on $1,000 capital — a 9.27% return over 44 days. The bot’s annualized projection of 105.27% uses compounding logic. A simpler monthly equivalent: (9.27% ÷ 44) × 30 = ~6.32%/month.
Project that linearly across 12 months and you get ~75.8%. Still exceptional — but less dramatic than the compounded headline number.
⚠️ The Fee Reality:
$16.02 in fees on $138.62 gross profit = 11.6% of every dollar earned went to the exchange. That’s the cost of 348 trades. Each trade cost just $0.046 in fees on average — tiny.
But stacked across a high-frequency grid, it adds up. At a higher fee tier (say 0.2%), that drag would have swallowed over 23% of gross profit. Fee rate matters enormously in grid strategies.
🔁 Capital That Worked Hard:
The 108.14% grid efficiency tells a specific story. The capital that was deployed worked more than it cost — every dollar in the market generated more than a dollar in grid profit. But here’s the other side: $399.88 in cash USDT sat uninvested at the end of the period.
That’s 40% of total capital that never entered a trade. The bot’s efficiency was real, but it was concentrated in only 60% of the deployed capital.
Here comes our A/B/C strategies quick comparison:
| Variant | Range | Grids | Trades | Grid Profit | ROI % |
|---|---|---|---|---|---|
| A | 30D | 20 | 198 | - | 3.79% |
| B | 30D | 20 | 130 | $84.54 | 3.93% |
| CThis Playbook | 7 Days | 20 | 348 | $138.62 | 9.27% |
Variant C didn’t just outperform — it lapped the field. The 7-day range placed the grid exactly where SOL was actually oscillating during the test period, while the 30-day variants cast a wider net and caught less.
Variant B ran 130 trades to generate $84.54 in grid profit. Variant C ran 348 trades for $138.62. The extra 218 trades cost more in fees — but they generated $54.08 more in gross profit, a net positive.
The 7-day range wasn’t lucky. It was calibrated to where the market actually was.
What the results are really telling you.
✅ what worked
The 7-day price range selector was the decisive parameter. It positioned the grid between $122.68 and $147.48 — precisely where SOL spent the majority of the 44 days oscillating.
The trade log confirms the early momentum: on March 5 alone, the bot fired rapid-fire sell orders at $144.66, $144.59, $144.71, $144.06, $146.12, and $147.48 — six completed cycles in the first 10.5 hours. $3.1570, $0.5077, $1.4872, $0.5577, and $3.1229 in individual trade profits inside a single session.
That’s the grid cycling exactly as designed — buying dips, selling recoveries, capturing the spread on every oscillation.
⚠️What didn't work
The final portfolio shows $399.88 in idle USDT — 40% of total capital sitting uninvested at period end.
This is the mechanical outcome of a falling market: as SOL declined toward the lower boundary, buy orders accumulated inventory that couldn’t sell because the price hadn’t recovered. The bot held 5.16 SOL at close with no upward triggers firing.
The 9.27% ROI figure includes this unrealized BTC-equivalent position. Cash-realized profit is lower. Before deploying this setup, understand that a significant portion of your capital will likely sit idle — and that “final portfolio value” and “cash in hand” are two different numbers.
💡 The key insight
Grid bots don’t need SOL to go up. They need SOL to move.
This is the fundamental truth that this backtest proves. SOL fell 15.95% over 44 days — and the bot made +9.27%. The mechanism is simple: every time the price dipped and recovered even slightly within the range, a buy-sell cycle was completed and profit locked in. Direction was irrelevant. Movement was everything.
The real risk isn’t a falling market. It’s a trending market — one that moves in a single direction without reversing. If SOL had dropped from $148.18 to $110 in a straight line without bouncing, the grid would have accumulated SOL at every level all the way down with nothing selling.
All buys, no sells. The strategy breaks not when price falls, but when it falls without recovering.
🚩 Watch out for - a potential red flag
The 26.64% max drawdown deserves a direct conversation.
This is the peak unrealized exposure during the backtest — the moment when open positions were furthest underwater relative to entry prices. With SOL dropping ~16% during the period, the grid was accumulating inventory on the way down. That inventory sat at a paper loss until (and if) the price recovered.
The drawdown exceeded SOL’s actual price decline because the grid was buying at multiple levels on the way down — amplifying the paper exposure relative to a single buy-and-hold position.
This is not a “loss” in the realized sense. But it is a number that will stress you out if you’re watching it live. Before running this setup: confirm that your full $1,000 is liquid, that you have no need for that capital during the session, and that you can psychologically tolerate watching a 26% unrealized drawdown without closing the bot early — because closing early is the only way to turn that paper loss into a real one.
Overall Performance Score, Strengths and Limitations
Strong Grid in a Hostile Market
9.27% net return while the underlying asset dropped 15.95% is a genuinely impressive result. The 108% grid efficiency and 348 completed trade cycles show the bot was active and productive throughout the period. The score is held back by the elevated 26.64% drawdown and 40% idle capital.
🧭 STRENGTHS
- Exceptional ROI vs. buy & hold delta (+16.59%)
- 348 trades across 44 days — consistently active
- 7-day range calibration was precise and effective
- Low per-trade fee cost ($0.046 avg per trade)
- Grid efficiency of 108% — deployed capital worked hard
🚫 LIMITATIONS
- 40% of capital ($399.88) stranded as idle USDT at end of period
- Max drawdown of 26.64% — elevated psychological and capital risk
- ROI includes unrealized SOL holdings — not fully cash-realized
- Range must be recalibrated before every new deployment
- Breaks completely in sustained directional downtrends
Quick Takeaways
- The 7-day range selector outperformed 30-day alternatives by 2.4× in ROI
- Falling markets can still be profitable — if the bot triggers sell cycles on recoveries
- High trade frequency (7.9/day) means fee rate selection is critical
- Idle capital is structural, not a flaw — but must be budgeted for
- Max drawdown exceeds price decline — grid amplifies paper exposure on the way down
What did spot buy & hold actually return?
If you had simply bought $1,000 of SOL on March 5 at $148.18 and held through April 18, here’s how that compares:
Winner: Grid Bot Strategy — by a margin of $165.91.
The difference between running the grid bot and holding spot: +$92.71 minus (−$73.20) = $165.91 advantage in a single 44-day period.
The grid bot didn’t need SOL to recover. It made its profit while SOL was falling. Buy-and-hold required a price recovery that never came.
Before you run this playbook, check these off.
Use this as your go/no-go checklist before deploying this exact parameter set.
🧠 Market Suitability Matrix
April 2025 was a Strong Bull Run scenario. The result — +7.35% vs. buy & hold’s +14.15% — is exactly what this matrix predicts.
The grid worked mechanically. The market condition was simply the worst possible fit for a tight, high-placed 7-day range.
| Market Condition | Rating | Strategic Notes |
|---|---|---|
| Sideways / Consolidating | ★★★★★ Excellent | Frequent triggers, consistent exits |
| High Volatility | ★★★★★ Excellent | Fast cycling through grid levels; maximum trade frequency |
| Mildly Bearish / Slow Bleed | ★★★★☆ Good | Longer hold cycles but price stays in range; drawdown manageable |
| Mildly Bullish / Slow Climb | ★★★☆☆ Moderate | Price drifts toward upper boundary; fewer return cycles |
| Strong Bull Run | ★★☆☆☆ Risky | Exactly what April 2025 showed — price leaves range, bot sits idle |
| Strong Bear / Crash | ★☆☆☆☆ Poor | Price falls through all buy levels; full capital locked in BTC, nothing selling |
| Very Low Volatility | ★☆☆☆☆ Poor | No price movement within range means no triggered trades; deadweight capital |
How to tune this playbook for different scenarios.
Disclaimer: All data sourced from CryptoGates Grid Backtest Bot. Results are historical simulations using Binance 1-minute OHLCV data. Past backtest performance does not guarantee future live trading results. DYOR.
Battle-Test Your Strategy
Before the Market Does.
Eliminate guesswork with institutional-grade backtesting for DCA, Grid, and Rebalance bots. Real historical data. Real-world results.