

 Bitcoin
 Ethereum
 Solana
 TRON
 Hyperliquid
 Zcash
 Dogecoin
 Monero
 Chainlink
 Cardano
 Stellar
 Uniswap
 Sui
 Hedera
 Shiba Inu
 Bittensor
 Ripple USD
 Aster
 Polkadot
 World Liberty Financial
 Render
 Artificial Superintelligence Alliance

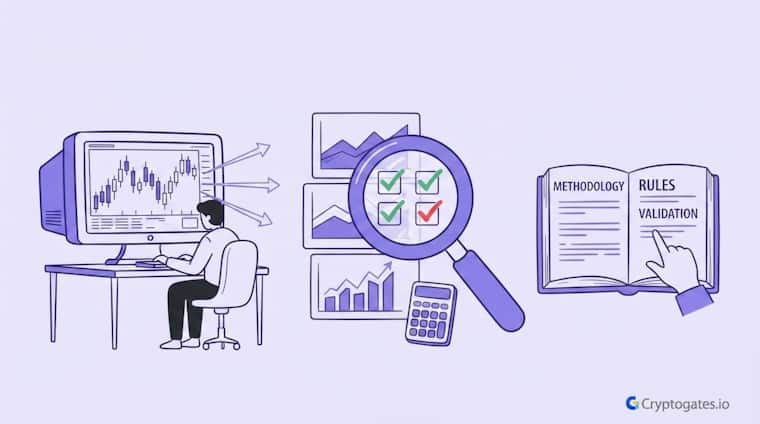
Most crypto strategies that look amazing on a chart never survive contact with a live market, a pattern that echoes why 97% of day traders lose money within their first year.
That gap between backtest and reality is the whole reason a proper crypto backtesting methodology matters more than any single win rate you see online.
Here’s the thing.
A backtest isn’t proof. It’s a claim. And claims need a process behind them, not vibes.
McLean & Pontiff, Journal of Finance
This piece walks through the actual process CryptoGates uses to test DCA, Grid, and Rebalance strategies before anyone treats them as real.
No performance promises here, ser. Just the method, laid out plain.
- The Problem: Most crypto strategies get judged on a single backtest run, which is basically judging a strategy on luck.
- The Solution: A fixed, repeatable testing process across multiple coins, timeframes, and market phases, checked against data the strategy never saw.
- The Incentive: Traders get a strategy that's actually been stress-tested, not just one that looked good once.
- The Risk: Even a well-tested strategy can still lose money live, and no backtest removes that risk entirely.
Why This Method Matters
Here’s what most beginners miss.
A strategy can look flawless on a chart and still fall apart the moment real money touches it. That’s not bad luck.
That’s usually a testing process that was never built to be honest in the first place.

ZAHEER, CEO CryptoGates
The problem isn’t that people don’t test strategies. It’s that most tests only prove a strategy worked once, on one dataset, under one set of assumptions. That’s not validation.
That’s a screenshot.
Battle-Test Your Strategy
Before the Market Does.
Eliminate guesswork with institutional-grade backtesting for DCA, Grid, and Rebalance bots. Real historical data. Real-world results.
A disciplined process forces you to ask harder questions. Did the strategy survive a real drawdown, or just a friendly bull run?
Would it still work if fees and slippage were counted honestly?
Does it hold up on data it never saw during setup? Most retail-level backtests skip these checks entirely, which is exactly why so many strategies feel bulletproof right up until they aren’t.
What We Tested
CryptoGates didn’t build this process around one lucky setup.
The framework covers DCA, Grid, and Rebalance strategies, run through the same standard every single time, across different coins and market conditions.
1. Strategy Types Covered
DCA, Grid, and Rebalance logic all went through identical testing standards. No favoritism.
No easier rules for the strategy we liked more going in. Honestly, that consistency is the point. If one strategy type got softer treatment, the whole comparison would mean nothing.
2. Coin and Market Selection
Testing spanned major assets and altcoins, not just BTC in isolation. Bull runs, bear markets, and long stretches of chop were all included.
A strategy that only gets tested during a euphoric uptrend isn’t tested. It’s flattered.

Crypto strategy backtesting means running a trading strategy against historical price data to see how it would have performed. It's a way to check a strategy's logic before risking real capital.
Data and Time Range
A backtest is only as honest as the data behind it.
Get the window wrong, skip a market phase, or feed it messy candles, and the whole result becomes noise dressed up as a signal.
1. Historical Data Window
The testing window was chosen to include real stress, not a comfortable stretch where everything went up.
A strategy that’s only ever seen a bull run hasn’t been tested. It’s been flattered. Multi-year windows covering full market cycles were used so drawdowns, chop, and recoveries all show up in the data.
2. Market Coverage
Bull phases, bear phases, and long sideways chop were all included on purpose. Here’s the interesting part.
Most retail backtests quietly skip the boring, range-bound stretches because they don’t produce exciting equity curves.
Those stretches are exactly where Grid strategies live or die, so leaving them out defeats the point entirely.
Research Highlight
A recurring pattern shows up when Grid strategies are tested specifically inside the range-bound stretches most public backtests skip. In one 60-day window where SOL drifted sideways through an $80–$97 post-crash range with no clear direction, a grid bot logged 146 trades and closed with a 10.88% advantage over simple buy-and-hold.
Sideways markets don’t produce dramatic equity curves, which is likely why they get left out of so many test windows — but they’re where a strategy’s structural logic is actually visible, without directional price movement doing the work for it.
View Complete Playbook: https://cryptogates.io/playbooks/sol-usdt-grid-bot-backtest-mar-apr-2026/
3. Data Quality Checks
Missing candles, exchange outages, and obvious price glitches were cleaned out before a single test ran.
Bad data creates fake signals. Wait, that’s actually the bigger risk than most people realize.
A strategy can look genius purely because of a data gap it never should have traded around in the first place.
Testing Framework
Entries, exits, sizing, and risk rules were locked in before any test began. None of it got adjusted after seeing how the results looked.
That part matters more than people think.
1. Entry Rules
Entry logic came from the strategy type itself, DCA intervals, Grid price bands, Rebalance drift thresholds, not from picking whichever entry made the chart prettiest in hindsight.
2. Exit Rules
Exits followed the exact same fixed logic as entries. Win or lose, the rule didn’t change mid-test. That’s the whole point of removing hindsight from the equation.
3. Position Sizing
Size was set by risk per trade, recalculated as capital changed, not a flat dollar amount pretending the account never grew or shrank.
4. Risk Controls
| Control | Purpose | Applied To |
|---|---|---|
| Stop-loss | Cap downside per trade | All three strategy types |
| Take-profit | Lock in gains at target | DCA, Grid |
| Drift threshold | Trigger rebalancing | Rebalance only |
5. Realistic Assumptions
Fees, slippage, and spread were built into every run, not added as an afterthought. Honestly, this is where most backtests quietly lie.
A strategy showing strong paper returns can look a lot less exciting once real trading costs get subtracted, and that’s the version that actually matters.
The Backtest Bot on CryptoGates applies this same cost logic automatically, so the numbers a user sees already account for friction, not a fantasy version of the market.
Real Backtest Example
Strategy: Grid | Coin: BNB/USDT | Market Condition: 33% post-ATH crash over 79 days | Objective: Test whether gross grid profit survives a real drawdown
The bot fired 171 trades and generated $163.94 in grid profit — a number that looks solid in isolation.
Once the price fell straight through the grid’s range, total ROI landed at −21.64%. That gap between gross grid profit and net portfolio result is the exact distinction this section is making: a backtest that only reports trade-level profit without accounting for unrealized exposure outside the range is reporting a fantasy number, not a real one.
View Complete Playbook: https://cryptogates.io/playbooks/grid-bot-vs-a-33-bnb-crash-what-the-backtest-data-actually-shows/
Validation Process
A backtest that only works on one dataset isn’t a strategy. Ngl, it’s a coincidence wearing a strategy’s clothes.
Enough to cover at least one full market cycle, bull, bear, and sideways phases included. A few months of data isn't enough to know if a strategy survives real conditions.
1. Avoiding Overfitting
Parameters were kept simple on purpose.
The temptation to tweak a setting until the equity curve looks perfect is real, and that’s exactly how a strategy ends up memorizing old price action instead of capturing something repeatable.
Fewer moving parts. Fewer chances to accidentally curve-fit the past.
Stop Guessing.
Stress Test Your Edge.
The market doesn't care about your backtest. Our engine simulates 1,000+ "what-if" scenarios to ensure your strategy is built for survival.
Run Crypto Strategy Engine →2. Out-of-Sample Checks
Every strategy was checked against data it never saw during setup.
This is the part most retail testing skips entirely. If a strategy only performs on the exact stretch of history it was built on, that’s not an edge. That’s memorization.

Mark Douglas
3. Robustness Across Runs
Interactive Checklist: Signs a Backtest Result Can Actually Be Trusted
- Performance holds up across multiple market phases, not just one
- Results don't collapse when a single parameter shifts slightly
- Fees and slippage were included from the start, not added later
- The strategy was tested on data it never saw during setup
- Win rate isn't suspiciously high, above 80% usually means overfitting
A strategy earns trust only after surviving many different runs.
One clean chart proves almost nothing on its own. Few people actually check for this, which is probably why so many “proven” strategies fall apart within a month of going live.
A tested strategy beats a hopeful one, every single time.
That’s the whole idea behind this process: DCA, Grid, or Rebalance, the same standard applies across the board: define the rules first, test them honestly, and only then decide if a strategy earns real capital.
Curious how your own idea holds up?
Run it through the Strategy Engine on CryptoGates and see what the data actually says before risking anything live.
FAQs
Does backtesting guarantee future profits?
No. A backtest shows how a strategy would have performed on past data, not what it will do next. Markets change, and past patterns don’t always repeat.
How long should a crypto backtest period be?
Long enough to cover a full market cycle, bull, bear, and sideways phases included. A few months of data usually isn’t enough to know if a strategy holds up.
What's the difference between backtesting and forward testing?
Backtesting runs a strategy against historical data. Forward testing runs it live, in real time, on data the strategy hasn’t seen yet. Both matter before risking real capital.