Bitcoin
  Ethereum
  BNB
BNB  XRP
XRP  Solana
  TRON
TRON  Hyperliquid
  Dogecoin
  Zcash
Zcash  Stellar
  Cardano
  Hedera
  Sui
Sui  Shiba Inu
  Bittensor
  World Liberty Financial
  Aster
Aster  Ripple USD
  Polkadot
  Render
  Artificial Superintelligence Alliance
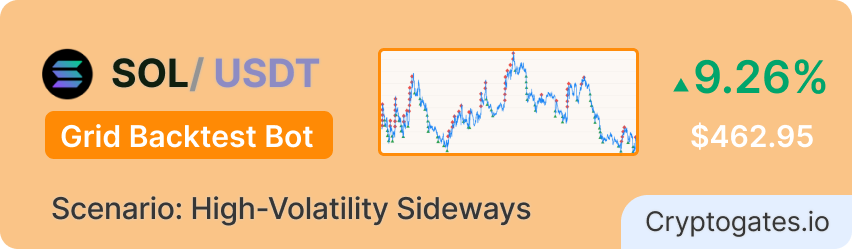
SOL walked off a cliff in November. The bot was already waiting at the bottom.
SOL opened November 5, 2025, at $155.04. It didn’t stay there long.
Within days, selling pressure — a combination of post-election profit-taking and broader crypto market exhaustion — pushed SOL into a sustained decline. By December 20, SOL closed at $125.81. That’s a $29.23 drop. An 18.84% wipeout in 46 days.
For a spot holder with $1,000 invested, that meant sitting on an unrealized loss of $187.90. No trades, no recovery, just watching the number go down.
The Question: This backtest was built to answer: Can a Grid bot configured with a 7-day price range generate enough oscillation profit to meaningfully offset a falling market?
We ran this across 46 days of real Binance 1-minute OHLCV data. Here’s exactly what happened.
Strategy Parameters
One number here deserves immediate attention before we go further.
The grid range was set to $116.88–$135.43 using the 7-day price selector, but SOL opened the backtest at $155.04. That means at the moment the bot started, the entire grid range was $19.61 below the current price.
The bot opened with an INIT_BUY of 3.224 SOL at $154.92 — a position that would spend most of the backtest underwater as SOL fell into and through the grid range.
That INIT_BUY is where most of the -4.22% loss lives.
How Each Setting Impacted Performance?
Grid bots aren’t complex — but the relationship between parameters and outcomes is.
Understanding why each setting matters is what separates a strategy from a gamble.
In this backtest, a single parameter mismatch (range set far below entry price) shaped the entire result.
Parameter Impact Summary
| Parameter | Impact | The Logic (Why) |
|---|---|---|
| 7-Day Price Range ($116.88–$135.43) | ⚠️ Range set below open price | Bot bought heavy at $155, above range |
| 20 Grids | 🔁 Moderate trade frequency | More levels, more cycle triggers |
| Arithmetic Spacing | ⚖️ Consistent profit cycles | Equal spacing, equal gains |
| $50 Grid Size | 💰 Controlled per-level allocation | Fixed capital risk per step |
| 2% Profit/Grid | 📈 Captured real oscillation profit | Matched range's ~$0.977 grid steps |
| 0.1% Fee Rate | ✅ Minimal fee drag | 282 trades cost only $7.88 total |
282 trades. $64.20 gross grid profit. The INIT_BUY cost everything.
💰 The Real Story Behind the Loss
This backtest shows −$42.21 net profit on $1,000 — a 4.22% monthly return. But the gross grid profit was $64.20. Those two numbers tell completely different stories.
The grid engine worked. It cycled through 282 trades and collected $64.20 in real, realized profit from SOL’s oscillation inside the $116.88–$135.43 range. The loss came from one source: the INIT_BUY of 3.224 SOL at $154.92. With SOL closing at $125.81, that initial position carries an unrealized loss of approximately $93.81. That single entry — not the grid itself — is responsible for the negative ROI.
⚡ Efficiency or Idleness?
$7.8835 in total fees across 282 trades.
That’s 12.3% of gross grid profit — meaningful, but not punishing. At 0.1% per trade, the fee structure is efficient even at this trade frequency. The strategy didn’t bleed out from fees. It bled from a poorly timed initial buy.
📊 Bot vs. Buy & Hold: The Real Comparison
Buy & Hold on $1,000 of SOL from $155.04 to $125.81 = −$187.90 loss (−18.79%). The Grid bot lost $42.21. That’s a $145.69 outperformance — not because the bot made money, but because it limited how much it lost. In a crashing market, damage control is the edge.
Here comes our A/B/C strategies quick comparison:
| Variant | Range | Grids | Trades | Grid Profit | ROI % |
|---|---|---|---|---|---|
| A | 30 days | 20 | 297 | $66.98 USDT | −5.55% |
| B | 30 days | 25 | 258 | $68.98 USDT | −5.15% |
| CThis Playbook | 7 Days | 20 | 51 | $73.38 | 7.35% |
All three variants lost money. No version of this strategy won in November–December 2025’s market.
But Variant C (7-day range, 20 grids) was the least bad outcome — and the reason is structural.
The 7-day range placed the grid closer to where SOL was actually trading during the oscillation phase, meaning more grid levels got triggered and more cycles completed. Variants A and B used 30-day ranges that were calibrated to a much wider historical window, diluting capital across price levels that rarely got touched.
Variant B’s 25 grids and higher TP% (2.99%) boosted gross profit to $68.98 but ran 24 fewer trades than Variant C — suggesting the tighter grids in C were better suited to the chop. The margin of difference between all three is small. The underlying problem — INIT_BUY far above the grid range — affected all variants equally.
What the results are really telling you.
✅ what worked
The grid engine itself performed exactly as designed. Once SOL fell into the $116.88–$135.43 range around mid-November, the bot began cycling buy/sell orders efficiently. The trade log shows a rapid sequence of buy-sell pairs at $135.43/$138.14, $135.38/$138.08, $135.32/$138.03 — three completed cycles in quick succession, each returning ~$0.473 in profit. That’s the 2% profit-per-grid target hitting cleanly.
282 trades across 46 days, averaging 6.1 per day, generated $64.20 in real realized profit. The arithmetic spacing kept cycle distances consistent, so every completed round-trip captured the same ~$2.70 price move. In the oscillation zone, the bot was doing exactly what it was built to do.
⚠️What didn't work
The INIT_BUY at $154.92 for 3.224 SOL is the single trade that defines this backtest’s outcome. It was executed at a price $19.49 above the grid’s upper boundary — meaning it was a position the grid could never sell at a profit. As SOL fell from $155 to $125, that position accumulated ~$93.81 in unrealized losses. The $64.20 in grid profit couldn’t offset it.
This is a structural issue with the 7-day range selector in a falling market: the range was set to where SOL had been trading the week before the backtest started — not where it opened.
When there’s a significant gap between the current price and the top of the range, the INIT_BUY becomes a liability from trade #1. Fixing this requires either running a manual range that includes the current price or waiting for the price to enter the defined range before the bot initiates.
💡 The key insight
Grid bots don’t protect you from where you enter. They only profit from where the price oscillates.
This backtest proves it cleanly. The grid engine generated $64.20 in real profit. The INIT_BUY created ~$93.81 in unrealized loss. These are two completely separate mechanisms running in parallel, and the entry point is dominated.
The lesson: the INIT_BUY is not a grid trade. It’s a spot buy. And like any spot buy, it carries full directional risk. If the price falls after entry, it bleeds. No amount of grid efficiency rescues a deeply offside INIT_BUY in a 46-day window.
Before deploying this setup: verify that your grid range includes the current market price — not just the recent 7-day low. If the current price sits significantly above the range top, consider a manual range adjustment or waiting for the price to pull back inside the zone before activation.
🚩 Watch out for - a potential red flag
The 7-day range selector in a downtrending market is a trap.
Here’s the mechanism: the 7-day range looks at the last 7 days of price data and sets the grid between the low and high of that window.
If the market has been trending down, that window captures a range that’s already below the current price. The bot then opens with an INIT_BUY at the current price — outside its own range — and holds that position as an unhedged spot bag.
In this backtest, the range top was $135.43. SOL opened at $155.04. The bot bought 3.224 SOL at $154.92. It needed SOL to recover above $154.92 to close that position profitably. SOL never came close.
The 15.95% max drawdown reported here is primarily driven by this INIT_BUY position, not by the grid activity itself.
Before running this setup: Always check whether the current price falls inside the defined grid range. If it doesn’t, do not run the bot with an auto-generated 7-day range. Either manually set a range that brackets the current price or wait for the market to pull back into range territory before activating.
Overall Performance Score, Strengths and Limitations
Defensive Grid with a Structural Entry Flaw
The grid engine performed cleanly. The strategy configuration failed at the setup stage. A −4.22% loss in an −18.79% market is genuinely impressive damage control — but it's still a loss, and it was preventable with a manual range adjustment.
🧭 STRENGTHS
- Outperformed buy-and-hold by 14.57 percentage points ($145.69 in real terms)
- Generated $64.20 in gross realized grid profit despite a crashing market
- Low fee drag: only $7.88 on 282 trades (12.3% of gross profit)
- Consistent trade activity — 6.1 trades/day shows the grid was actively cycling
- Max drawdown (15.95%) was significantly lower than buy-and-hold's ~18.84%
🚫 LIMITATIONS
- INIT_BUY at $154.92 — $19 above range — created an unhedgeable spot loss
- −4.22% net return despite the grid generating real profit
- The 7-day auto-range is unreliable in trending/falling markets
- $313.25 in idle cash (31.3% of capital) never entered the grid
- 5.12 SOL base quantity sitting at $125.81 — further losses if SOL continues declining
Quick Takeaways
✔ The grid made money. The INIT_BUY lost more. Know the difference.
✔ A 7-day range in a falling market sets the grid below where you buy — a structural trap
✔ Damage control is a valid edge: −4.22% beats −18.79% by a margin that matters
✔ Idle cash (31.3%) signals under-utilization — a wider or repositioned range captures more
✔ Grid efficiency of 67.55% means only two-thirds of the capital is actively worked
What did spot buy & hold actually return?
If you had simply bought $1,000 of SOL on November 5 at $155.04 and held through December 20, here’s how it compares:
Winner: Grid Bot Strategy — by $145.69 and 14.57 percentage points.
The difference between running the Grid bot and holding spot: −$42.21 minus (−$187.90) = $145.69 advantage over 46 days.
That’s not a win, but it’s a meaningful defense. The Grid bot lost 4.22 cents for every dollar invested. The spot holder lost 18.79 cents. In a sustained bear market, the bot’s grid profit partially absorbed the directional bleeding that destroyed buy-and-hold returns.
Before you run this playbook, check these off.
Use this as your go/no-go checklist before deploying this exact parameter set.
🧠 Market Suitability Matrix
| Market Condition | Rating | Strategic Notes |
|---|---|---|
| Sideways / Consolidating | ★★★★★ Excellent | Frequent triggers, consistent grid exits |
| High Volatility | ★★★★★ Excellent | Deep entries, rapid oscillation cycles |
| Mildly Bearish / Slow Bleed | ★★★★☆ Good | Grid profits, INIT_BUY bleeds slowly |
| Mildly Bullish / Slow Climb | ★★★☆☆ Moderate | Grid cycles frequently, INIT_BUY recovers |
| Strong Bull Run | ★★☆☆☆ Risky | Price exits range top, bot goes idle |
| Strong Bear / Crash | ★☆☆☆☆ Poor | INIT_BUY creates large unhedged loss bag |
| Very Low Volatility | ★☆☆☆☆ Poor | No triggers, fees consume thin profit margin |
The honest summary:
This strategy is built for chop. The Nov–Dec 2025 backtest was a partial match — SOL did oscillate within the range after falling into it — but the crash phase entering the range destroyed the overall return.
The ideal deployment window is when SOL is already inside your defined range and showing clear oscillation behavior.
How to tune this playbook for different scenarios.
Disclaimer: All data sourced from CryptoGates Grid Backtest Bot. Results are historical simulations using Binance 1-minute OHLCV data. Past backtest performance does not guarantee future live trading results. DYOR.
Battle-Test Your Strategy
Before the Market Does.
Eliminate guesswork with institutional-grade backtesting for DCA, Grid, and Rebalance bots. Real historical data. Real-world results.