Blog

  • Tether Just Moved $70M in Bitcoin: Here’s What 97,000 BTC in Reserves Really Means

    Tether Just Moved $70M in Bitcoin: Here’s What 97,000 BTC in Reserves Really Means

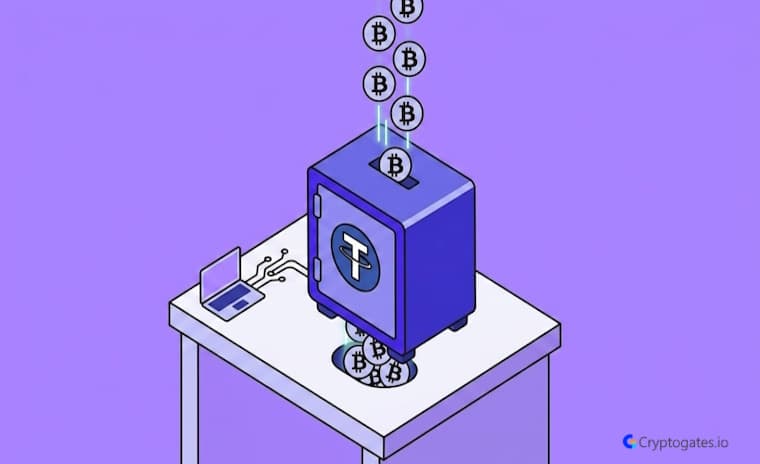
    Tether just transferred 951 BTC, worth roughly $70 million, from Bitfinex straight into its reserve wallet.

    That’s not a small move.

    And it tells you something important about where stablecoin issuers are putting their money right now.

    EXECUTIVE SUMMARY
    • The Problem: Stablecoin issuers holding cash-only reserves face inflation and trust risks.
    • The Solution: Tether recycles 15% of its profits directly into Bitcoin.
    • The Incentive: BTC acts as a harder, scarcer asset inside the reserve stack.
    • The Risk: If Bitcoin drops sharply, Tether’s reserve value drops with it.

    Why Tether Keeps Buying Bitcoin

    Tether’s strategy isn’t random.

    The company has a standing policy 15% of monthly profits go into BTC.

    No debate, no vote. Just execution.

    Tether now holds over 97,204 BTC, worth approximately $7.1 billion (Arkham Intelligence)

    Honestly, most people focus on USDT’s dollar peg and completely ignore what’s sitting underneath it. That’s a mistake.

    The reserve composition matters.

    A lot.

    Here’s the thing: this wasn’t a one-time purchase.

    It’s part of a slow, steady accumulation pattern that’s been building for some time now.

    What the 951 BTC Transfer Actually Means

    Look, on-chain data doesn’t lie.

    Arkham tracked this move wallet-to-wallet, from Bitfinex to Tether’s reserve address.

    No ambiguity.

    The single transfer added 951 BTC in one transaction                                         Arkham Intelligence / Crypto Briefing.

    Is Tether’s Bitcoin reserve strategy risky?

    It adds price volatility to a stablecoin’s backing; yes, that’s a real risk worth watching.

    Wait… Actually, the bigger question isn’t whether this is risky.

    It’s whether other stablecoin issuers follow.

    That’s the signal to watch.

    Before You Read Tether Reserve News:

    • Check on-chain data first, not just headlines
    • Verify the source wallet via Arkham or similar tools
    • Compare BTC reserve size vs total USDT supply
    • Track if the purchase was profit-recycled or new capital
    • Use the CryptoGates screener to monitor reserve wallet activity

    What This Means for the Market

    A company sitting on nearly a hundred thousand BTC isn’t just “holding.”

    It’s becoming one of the largest institutional Bitcoin holders on the planet.

    HISTORICAL DATA AUDIT

    Battle-Test Your Strategy
    Before the Market Does.

    Eliminate guesswork with institutional-grade backtesting for DCA, Grid, and Rebalance bots. Real historical data. Real-world results.

    EST. OPTIMIZATION +42% ROI Efficiency
    Start Backtest Now

    Sourced from 5+ Years of Exchange Data

    Here’s the interesting part.

    Tether’s buying isn’t correlated to Bitcoin’s price action.

    They buy on a schedule.

    That’s a very different behavior from retail traders chasing momentum.

    Should You Change Anything?

    Probably not today. But you should be watching.

    Swipe to view full data →
    Factor Tether’s Move Retail Impact
    Size 951 BTC / $70M Indirect
    Frequency Monthly Unpredictable
    Risk Level Moderate Low-Medium

    Mid-thought self-correction: This looks bullish at first, and it is, sort of, but don’t ignore the flip side.

    If Tether ever needed to liquidate, nearly a hundred thousand BTC hitting the market would hurt.

    The Bottom Line on Tether Bitcoin Reserves

    Tether’s Tether Bitcoin reserves now top 97,000 BTC.

    That’s not noise.

    That’s a strategy playing out in real time, on-chain, and verified.

    Watch the next monthly cycle. If they buy again, the pattern holds.

    Use CryptoGates to track institutional moves before acting on your own portfolio.

  •  $5.4 Million Crypto Fraud Recovery — And Why Most Victims Still Get Nothing Back

     $5.4 Million Crypto Fraud Recovery — And Why Most Victims Still Get Nothing Back

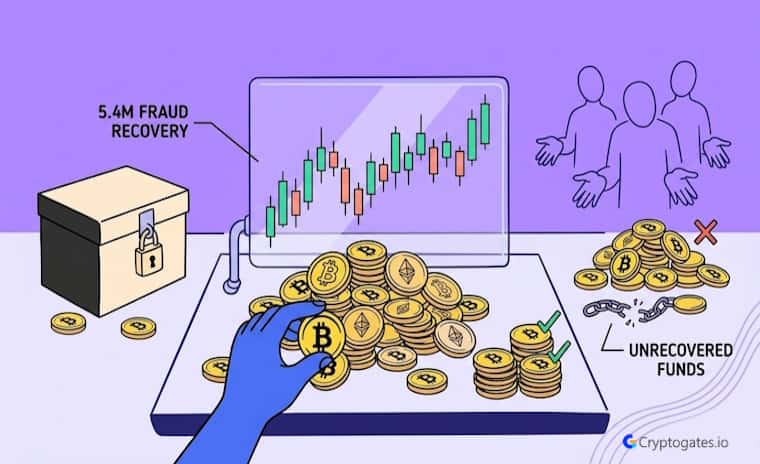
    A state attorney general just recovered $5.4 million from crypto fraudsters who specifically hunted older investors.

    That’s not a small number. And it’s not an isolated case.

    Over $1 billion in crypto fraud losses were reported by people over 60 in a single recent period. FTC Consumer Sentinel Network

    EXECUTIVE SUMMARY
    • The Problem: Crypto scammers are running coordinated campaigns against older, less tech-familiar investors with devastating results.
    • The Solution: A state-level legal recovery action clawed back $5.4 million from active fraud operations.
    • The Incentive: Authorities are getting better at tracing and recovering stolen crypto funds.
    • The Risk: Most victims never see their money again, and recoveries like this remain rare.

    How the $5.4 Million Crypto Fraud Recovery Happened

    The attorney general’s office traced the funds through multiple wallet addresses and fake platform operators.

    It wasn’t quick.

    It took coordinated legal action, blockchain forensics, and victim testimonies to build the case.

    That’s what a real recovery actually looks like behind the headlines.

    Who Was Targeted and How

    Look, this wasn’t random.

    Scammers picked their targets deliberately.

    Older investors were approached through fake investment platforms, romance-based trust building, and impersonation of real financial firms.

    Adults over 60 filed more fraud complaints than any other age group in crypto-related cases. FBI Internet Crime Complaint Center (IC3)

    The per-victim losses were also higher.

    Not because older investors are careless.

    Because the scams were designed specifically around their trust patterns.

    The Tactics Scammers Used

    The most common method was pig butchering.

    That’s where a scammer builds a relationship over weeks, sometimes months, before introducing a “can’t miss” crypto opportunity.

    By the time the victim realizes something’s wrong, the money is gone.

    Wait, actually, it’s not always that slow.

    Some victims reported losing funds within days of first contact. The timeline varies, but the outcome doesn’t.

    SYSTEM ACCESS: CG4.2

    Stop Guessing.
    Stress Test Your Edge.

    The market doesn’t care about your backtest. Our engine simulates 1,000+ “what-if” scenarios to ensure your strategy is built for survival.

    Run Crypto Strategy Engine →
    ROBUSTNESS SCORE
    75+ STRUCTURAL EDGE
    RISK OF RUIN < 1%
    TARGET HIT 92%
    Why do crypto scammers target older investors?

    Older investors often hold more savings, respond to trust-based pitches, and are less likely to report losses out of embarrassment.

    Roughly 9 out of 10 victims never reported the fraud at all.

    That’s the real problem here.

    Before putting a single dollar into any platform, run it through CryptoGates’ scam verification tool.

    It takes two minutes and can save you everything.

    What a Crypto Fraud Recovery Actually Means for Victims

    Honestly, $5.4 million sounds like a win.

    And it is.

    But let’s put it in context.

    Less than 25% of crypto fraud losses are ever successfully recovered after theft. Chainalysis Crypto Crime Report

    That means most victims get nothing back.

    The recovery here is significant because it happened at all, not because it’s the norm.

    Legal systems are still catching up to how fast crypto moves.

    5 Signs You’re Being Targeted by a Crypto Scam

    • Someone you met online introduces a “private” investment platform
    • Returns are guaranteed or shown as already happening in your account
    • You’re asked to recruit others to unlock your own withdrawal
    • Withdrawing funds suddenly requires an extra “fee” or “tax.”
    • The platform has no verifiable registration or public audit history

    Here’s the issue.

    Even when funds are recovered, distribution to victims is slow, partial, and legally complex.

    Getting $5.4 million back into the hands of the people it was stolen from takes time.

    HISTORICAL DATA AUDIT

    Battle-Test Your Strategy
    Before the Market Does.

    Eliminate guesswork with institutional-grade backtesting for DCA, Grid, and Rebalance bots. Real historical data. Real-world results.

    EST. OPTIMIZATION +42% ROI Efficiency
    Start Backtest Now

    Sourced from 5+ Years of Exchange Data

    Verify First. Always.

    Crypto fraud recovery at this scale makes headlines.

    But for every recovery, thousands of victims never get their money back.

    The system works slowly. Scammers move fast.

    Your job is to make sure you’re never the one waiting on a recovery that may never come.

    Use CryptoGates’ tools to check platforms and test strategies before any real money moves.

    FAQs

    How can I check if a crypto platform is legitimate before investing?

    Look for verifiable registration and independent audits, and test it with CryptoGate’s scam check tool before depositing anything.

    Stop all transfers immediately, document everything, and report to your local financial regulator and cybercrime authority.

    Less than 25% of crypto fraud losses are recovered, making prevention far more reliable than waiting on legal action.

  • Goldman Sachs Bitcoin ETF Filing: What the Premium Income Fund Means for Crypto Investors

    Goldman Sachs Bitcoin ETF Filing: What the Premium Income Fund Means for Crypto Investors

    Bitcoin’s dominance just hit 59.1% of the total crypto market.

    And Wall Street isn’t slowing down.

    Goldman Sachs has filed with the SEC to launch the Goldman Sachs Bitcoin Premium Income ETF, an options-based fund that sells options on BTC-linked assets to generate a regular yield.

    BTC market dominance stands at 59.1% of a $2.51T total crypto market cap. CoinMarketCap

    This isn’t a spot ETF.

    It’s a different structure entirely, and that difference matters a lot.

    EXECUTIVE SUMMARY
    • The Problem: Most retail investors want Bitcoin exposure without the full volatility risk of holding BTC directly.
    • The Solution: Goldman Sachs files an options-based Bitcoin ETF designed to produce regular income from BTC-linked funds.
    • The Incentive: Steady yield potential in flat or mildly trending markets without needing to own spot Bitcoin.
    • The Risk: The fund caps upside gains — in a strong Bitcoin rally, investors lose out on full price appreciation.

    What Goldman Sachs Actually Filed

    Here’s the thing: this filing is getting lumped in with spot Bitcoin ETFs in a lot of headlines.

    That’s not accurate.

    The Goldman Sachs Bitcoin Premium Income ETF is built around selling options on existing BTC-linked funds.

    It doesn’t hold Bitcoin directly.

    The income comes from option premiums collected over time, not from Bitcoin price gains.

    The total crypto market cap sits at $2.51T with 24-hour trading volume of $139.52B. CoinMarketCap

    That’s a meaningful structural difference and one that changes how you should think about this product entirely.

    How the Income Mechanism Works

    The fund sells covered calls or similar options strategies on BTC-linked assets.

    When those options expire, the premiums collected get distributed as income to fund holders.

    Think of it this way: instead of riding Bitcoin from, say, forty thousand to eighty thousand, you collect a smaller, steadier payment along the way.

    Around three to five percent in the right conditions, but that number depends heavily on market volatility.

    Why This Filing Matters Right Now

    It’s an exchange-traded fund that generates income by selling options on Bitcoin-linked assets rather than holding spot BTC, designed for yield-focused investors, not pure price speculators.

    Bitcoin ETF inflows have drawn significant institutional attention since spot products launched, with options-based structures now entering the pipeline.      SEC filing reference / Bloomberg

    Honestly, this filing tells us more about where institutional appetite is heading than it does about Bitcoin itself.

    Wall Street is moving toward yield-bearing crypto products.

    Spot ETFs opened the door.

    Now asset managers are building the next layer, income-generating structures designed for investors who want crypto exposure without the full ride up and down.

    The Risk Side No One Is Talking About

    Look, the income sounds attractive. But there’s a real cost buried in this structure.

    Options-overlay strategies on Bitcoin can work in range-bound conditions, but they systematically underperform in strong bull markets because the upside gets capped by the sold calls.

    ETF Analyst commentary via Bloomberg ETF Research

    When Bitcoin runs hard, this fund won’t keep up.

    The sold options create a ceiling on gains. That’s the trade-off you accept in exchange for the income stream.

    What to Watch Before This ETF Goes Live

    Goldman’s filing is in motion, but SEC approval isn’t guaranteed, and timing is uncertain. Watch for competing “premium income” BTC ETF filings that may reach approval first.

    Before this or any income ETF lands on your radar, use CryptoGates to stress-test the yield assumptions against real market scenarios.

    Data first. Decision second.

  • Strategy Bitcoin Accumulation: $1B Buy and What It Means for BTC at $70K

    Strategy Bitcoin Accumulation: $1B Buy and What It Means for BTC at $70K

    Bitcoin just got its biggest corporate signal yet.

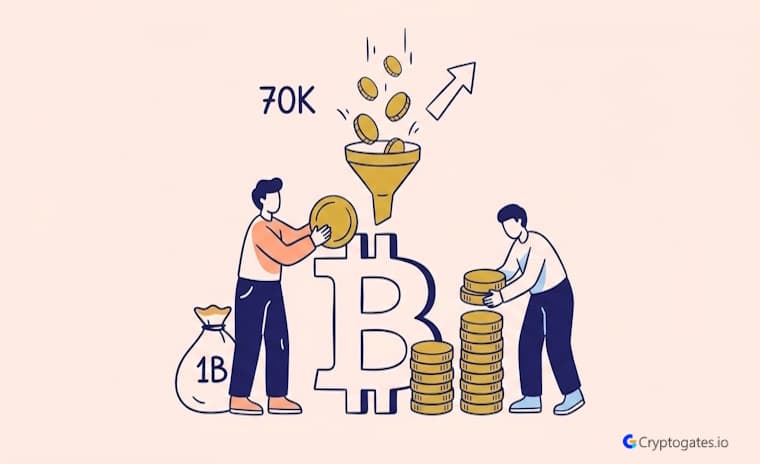
    Strategy purchased 13,927 BTC for roughly $1 billion last week, pushing total holdings to 780,897 BTC.

    This happened while most other corporate buyers had quietly stepped aside.

    EXECUTIVE SUMMARY
    • The Problem: Bitcoin is sitting near $70K under heavy macro pressure and extreme fear.
    • The Solution: Institutional buyers like Strategy are absorbing supply faster than miners can produce it.
    • The Incentive: $70K has held as a key floor for four straight days — and on-chain data points to a supply squeeze building.
    • The Risk: Strategy is carrying roughly $14.5 billion in unrealized losses, funded by a preferred stock program that needs Bitcoin to keep performing.

    What Strategy Just Did and What Saylor Is Signaling

    Look, most companies would stop buying an asset that’s dropped nearly 48% from its peak.

    Strategy did the opposite.

    The company bought 13,927 BTC between April 6 and April 12 at an average price of about $71,902 per coin.

    All of it was funded through sales of STRC, its preferred stock program. The total cost came to roughly $1 billion.

    That brings Strategy’s holdings to 780,897 BTC, acquired at an average cost basis of $75,577. At today’s price near $71,000, the company is sitting on roughly $14.5 billion in unrealized losses.

    Strategy purchased ~46,233 BTC in one month; miners produced around 16,200 BTC globally in the same period (CoinDesk)

    That’s nearly 3x what the entire mining network produced. One company.

    One month.

    Then on April 12, Saylor posted the “Think Bigger” chart — his BTC acquisition tracker — without any further context.

    Experienced traders didn’t need context.

    He has posted that chart 105 times since the accumulation began. Every single time, a new buy followed within days.

    The April 13 filing confirmed it.

    HISTORICAL DATA AUDIT

    Battle-Test Your Strategy
    Before the Market Does.

    Eliminate guesswork with institutional-grade backtesting for DCA, Grid, and Rebalance bots. Real historical data. Real-world results.

    EST. OPTIMIZATION +42% ROI Efficiency
    Start Backtest Now

    Sourced from 5+ Years of Exchange Data

    How Strategy Funds the Machine

    The buying engine runs on STRC, a preferred stock product that raised roughly $21 billion.

    As of April 12, Strategy still had over $21.6 billion remaining in STRC capacity, plus $27.1 billion available through its MSTR common stock program.

    Here’s the math.

    Saylor is using STRC dividends, which only require about a 2.05% annual Bitcoin return to be fully covered.

    That’s a very low bar.

    Does the strategy’s Bitcoin buying actually move the price?

    One company absorbing nearly 3x monthly mining output shrinks the liquid supply and can create upward pressure when retail demand returns.

    What This Means for Bitcoin at $70K

    Honestly, the macro picture right now is ugly.

    US-Iran talks collapsed. Oil spiked.

    Bitcoin fell 3.1% in a single session as the Fear & Greed Index dropped to 16.

    It has since recovered to hover just above $70,000.

    Saylor had said earlier that Bitcoin likely bottomed near $60K.

    If that holds, $70K starts to look like a staging zone rather than a danger zone.

    Fear & Greed Index at 12 — Extreme Fear — as of mid-April (CoinMarketCap)

    Here’s the thing: extreme fear zones have historically been where patient, process-driven buyers build positions.

    Not gamblers.

    Not trend-followers.

    Buyers with a plan.

    On-chain, whale addresses absorbed over 61,000 BTC in 30 days (Santiment).

    Exchange reserves are sitting at 6-year lows. Less supply on exchanges means less selling pressure when demand picks back up.

    The key number to watch is $75,000. A clean close above that level opens the next leg. Below it, Bitcoin likely stays range-bound while macro forces play out.

    Coin Bureau CEO Nic Puckrin laid out three conditions for Bitcoin to reach $90K: a stable ceasefire, oil back below $80, and easing stagflation concerns.

    (CoinMarketCap, April 2026)

    The risks are real and specific. Geopolitical escalation, persistent inflation, and oil staying elevated all work against Bitcoin’s short-term recovery. Don’t dismiss them.

    Before You Buy Bitcoin Near $70K, Check This:

    • Is the Fear & Greed Index below 20? (Extreme fear zone—historically a patient buyer’s window)
    • Is BTC holding above $70K for 4+ consecutive days?
    • Are ETF flows positive week-over-week?
    • Does your position size allow a 30–40% further drop without forcing a sale?

    Use the CryptoGates screener to stress-test your entry level against historical drawdown scenarios before sizing any position.

    SYSTEM ACCESS: CG4.2

    Stop Guessing.
    Stress Test Your Edge.

    The market doesn’t care about your backtest. Our engine simulates 1,000+ “what-if” scenarios to ensure your strategy is built for survival.

    Run Crypto Strategy Engine →
    ROBUSTNESS SCORE
    75+ STRUCTURAL EDGE
    RISK OF RUIN < 1%
    TARGET HIT 92%

    Bitcoin is holding near $70K.

    The biggest corporate accumulator in history is buying through losses that would stop most companies cold.

    Exchange supply is tightening. Extreme fear is historically a zone where the patient outperforms the reactive.

    Watch $75K—That’s the Number That Changes Everything

    Bitcoin is holding near $70K.

    The biggest corporate accumulator in history is buying through losses that would stop most companies cold.

    Exchange supply is tightening. Extreme fear is historically a zone where the patient outperforms the reactive.

    None of this means the bottom is confirmed.

    What it means is that the data deserves attention before any decision does.

    Run your entries through CryptoGates before risking real money. Verify the setup. Size appropriately. Process over FOMO.

  •  XRP Hits $1.37: But the Breakout That Actually Matters Hasn’t Happened Yet

     XRP Hits $1.37: But the Breakout That Actually Matters Hasn’t Happened Yet

    XRP just jumped 3%, moving from $1.32 to $1.37 on strong volume.

    Social sentiment around the token has dropped to one of its most bearish readings in two years.

    XRP had 15,795 buyers versus 8,220 sellers in the last 24 hours. (Coinbase Data)

    That’s the part most traders are ignoring.

    Historically, that exact combination, rising price, strong volume, and extreme bearish sentiment, has set up sharper moves.

    EXECUTIVE SUMMARY
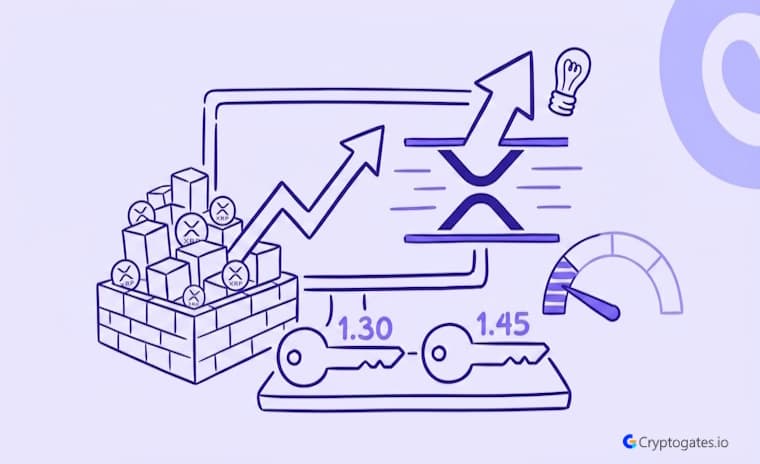
    • The Problem: XRP is climbing but still capped below the $1.42–$1.45 resistance zone.
    • The Solution: Rising volume and steady accumulation signal pressure building for a larger move.
    • The Incentive: Bearish sentiment extremes like this have historically preceded strong XRP rallies.
    • The Risk: A drop below $1.32–$1.30 invalidates the current setup and resets downside risk.

    What’s Actually Driving XRP Higher Right Now

    Look, price doesn’t grind higher on strong volume by accident.

    XRP has been posting a sequence of higher lows, from $1.32 up to $1.37, and that move came with follow-through buying, not a quick pump and fade.

    That’s the difference between accumulation and speculation.

    Roughly 62% of the XRP supply is currently in profit, with long-term holder supply increasing, a sign that patient money is building positions, not exiting.

    When price rises and volume confirms while sentiment stays deeply negative, that’s often where the real setup forms. Not after the breakout — before it. At CryptoGates, we track this signal specifically because it’s where most retail traders are looking the wrong way. Don’t be that trader.

    ZAHEER, CEO CryptoGates

    Here’s the thing.

    Sentiment being this bearish doesn’t mean the price will crash.

    It often means the people most likely to sell already have.

    The $1.42 Level — What Happens If It Clears (or Doesn’t)

    $1.35 is now the line XRP must hold.

    Lose that, and momentum stalls.

    The breakout target is $1.42 to $1.45; that’s the resistance zone where sellers have capped every recent recovery attempt.

    Honestly, a lot of traders are already pricing in a breakout that hasn’t been confirmed.

    That’s the dangerous part. Wait — a confirmed close above $1.42 on strong volume is the signal.

    Not a touch. Not a wick. A close.

    “If XRP holds above $1.37, the next target is the $1.40–$1.42 resistance zone. However, a break below the $1.32–$1.30 support range would invalidate the breakout and likely lead to a retest of lower levels.”

    CoinMarketCap Price Analysis

    There’s also a macro trigger worth watching.

    The market’s near-term ceasefire, set to expire around April 22, acted as the catalyst for the broader crypto relief rally that pushed XRP higher.

    If that situation shifts, sentiment could flip fast.

    U.Today

    XRP’s short liquidations hit $2.63 million in just 12 hours during the recent rally.

    The short squeeze amplified the move.

    That’s not a bad thing.

    But it does mean some of the recent price gain was forced, not organic.

    Before you act on XRP’s move:

    • Is XRP holding above the $1.35 support right now?
    • Has volume confirmed, or has it faded since the initial move?
    • Is BTC stable, or is it showing signs of declining?
    • Is your position size decided before entry — not during?
    HISTORICAL DATA AUDIT

    Battle-Test Your Strategy
    Before the Market Does.

    Eliminate guesswork with institutional-grade backtesting for DCA, Grid, and Rebalance bots. Real historical data. Real-world results.

    EST. OPTIMIZATION +42% ROI Efficiency
    Start Backtest Now

    Sourced from 5+ Years of Exchange Data

    Use the CryptoGates signal tracker to set level alerts for $1.35 and $1.42, so you’re watching the data, not refreshing a price app every ten minutes.

    Is XRP ready to break out?

    Not yet, price needs a confirmed close above $1.42 on strong volume before calling it a breakout.

    Watch the Level, Not the Hype

    Accumulation is building.

    Volume is confirming.

    Sentiment is near historic lows.

    But none of that matters if $1.42 doesn’t clear on a real close.

    SYSTEM ACCESS: CG4.2

    Stop Guessing.
    Stress Test Your Edge.

    The market doesn’t care about your backtest. Our engine simulates 1,000+ “what-if” scenarios to ensure your strategy is built for survival.

    Run Crypto Strategy Engine →
    ROBUSTNESS SCORE
    75+ STRUCTURAL EDGE
    RISK OF RUIN < 1%
    TARGET HIT 92%

    Watch that level, watch April 22, and don’t chase a movie that hasn’t been confirmed yet.

    Use CryptoGates to track the signals before making any decision.

    FAQs

    What does XRP accumulation at bearish sentiment extremes mean for price?

    Historically, when the XRP price rises on strong volume while sentiment hits bearish extremes, it has often preceded sharper rallies.

    A confirmed close above $1.42 on strong volume would signal a shift in momentum, with the next target zone around $1.50 and beyond. Without volume confirmation, a touch of resistance doesn’t count as a breakout and can quickly reverse.

    Volume should rise as price approaches and clears resistance. If price breaks a level but volume is flat or declining, the move lacks conviction and is more likely to fail. A real breakout shows expanding volume on the breakout candle itself.

  • Trump’s Fed Chair Pick Just Cleared a Big Hurdle: But There’s Still a Catch

    Trump’s Fed Chair Pick Just Cleared a Big Hurdle: But There’s Still a Catch

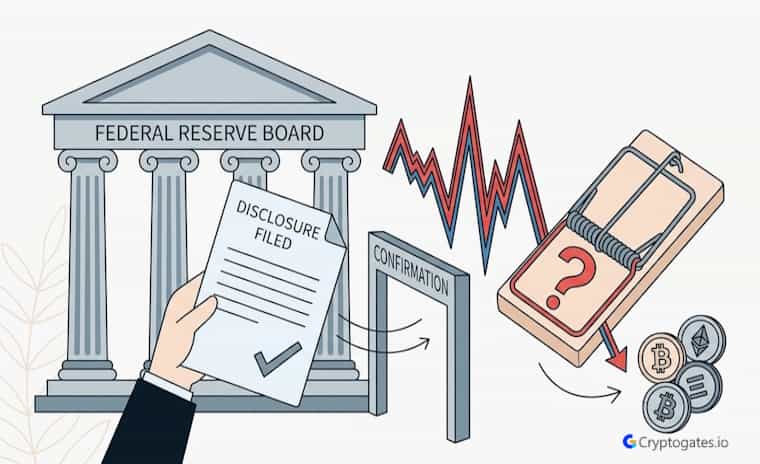
    Trump’s pick to run the Federal Reserve just cleared a key paperwork hurdle.

    Kevin Warsh has filed the financial disclosures the Senate Banking Committee needs to schedule his confirmation hearing.

    Warsh’s wife, Estée Lauder heir Jane Lauder, has an estimated net worth of $1.9 billion, making his financial disclosures unusually complex. (Forbes)

    That filing had been holding everything up.

    With Jerome Powell’s term ending on May 15, the window to appoint a new Fed chair is narrowing, and crypto markets are paying attention.

    EXECUTIVE SUMMARY
    • The Problem: The Senate couldn’t schedule Warsh’s hearing because his financial disclosures weren’t filed on time.
    • The Solution: Warsh submitted the required paperwork Monday, clearing the procedural block.
    • The Incentive: Getting a new Fed chair confirmed before Powell’s May 15 term expiry keeps monetary policy on stable footing.
    • The Risk: Senator Thom Tillis is blocking the nomination until a separate criminal probe into Powell is resolved.

    What Just Happened

    Look, this isn’t a done deal yet. But it’s a real step forward.

    Kevin Warsh filed his financial disclosures with the Senate Banking Committee on Monday.

    That paperwork is required before the committee can formally schedule a confirmation hearing.

    A hearing planned for April 16 had to be postponed because the filing wasn’t ready. Now that it’s in, the hearing could happen as early as next week.

    Here’s the thing: the delay wasn’t random. Warsh’s finances are genuinely complicated.

    Why the Paperwork Took So Long

    Warsh is married to Jane Lauder, an heir to the Estée Lauder cosmetics empire.

    His earlier financial disclosure listed roughly 1,200 assets, the vast majority tied to his wife’s holdings.

    Warsh’s prior financial disclosure listed nearly 1,200 assets, most held by his wife. (CNBC)

    That’s not a quick form to fill out.

    Actually, it’s worth noting that this same issue delayed SEC Chair Paul Atkins’ hearing, too.

    Marrying into a billion-dollar family creates paperwork. That’s just the reality.

    This is exactly the kind of macro signal we track at CryptoGates. Fed leadership transitions don’t just move bond yields — they move Bitcoin. A delayed or contested confirmation creates uncertainty, and uncertainty is what shakes retail traders into bad decisions. Verify the macro picture before you move.

    ZAHEER, CEO CryptoGates

    The CryptoGates macro news feed flags these confirmation milestones in real time, so you’re not caught off guard when the market reacts.

    HISTORICAL DATA AUDIT

    Battle-Test Your Strategy
    Before the Market Does.

    Eliminate guesswork with institutional-grade backtesting for DCA, Grid, and Rebalance bots. Real historical data. Real-world results.

    EST. OPTIMIZATION +42% ROI Efficiency
    Start Backtest Now

    Sourced from 5+ Years of Exchange Data

    Who Is Kevin Warsh and Why Does He Matter for Crypto?

    Warsh is Trump’s nominee to replace Jerome Powell as Federal Reserve Chair, and his stance on interest rates directly affects liquidity, risk appetite, and crypto prices.

    The Real Obstacle: Tillis and the Powell Probe

    But here’s the problem.

    Filing the paperwork doesn’t mean Warsh gets confirmed.

    Senator Thom Tillis, a Republican on the Senate Banking Committee, has publicly said he won’t vote to confirm Warsh until the federal criminal investigation into Jerome Powell is fully resolved.

    That probe is tied to a $2.5 billion renovation of the Fed’s headquarters and Powell’s related Senate testimony.

    The Senate Banking Committee has 13 Republicans and 11 Democrats. Tillis alone can block the committee from advancing Warsh’s nomination to a full Senate vote. (CNBC/Wikipedia)

    Honestly, this is the part most traders are ignoring.

    Everyone’s focused on the paperwork drama.

    The Tillis blockade is the actual risk.

    If Warsh Isn’t Confirmed by May 15

    Powell’s term as Fed Chair expires May 15.

    If Warsh isn’t confirmed by then, the Fed chair seat could be left in a holding pattern.

    Fed Governor decisions on rates would continue, but markets hate leadership uncertainty, and crypto tends to feel that volatility faster than most assets.

    Can Trump replace Jerome Powell before his term officially ends?

    Powell’s chair term expires May 15; Trump cannot remove him before that date but can only replace him once the term ends.

    What Crypto Traders Should Watch Next

    The paperwork is filed.

    The hearing is coming. But Tillis hasn’t moved, and the Powell probe isn’t closed.

    Watch the Senate Banking Committee’s public schedule for a confirmed hearing date; that’s the next real signal.

    If you want to track how this confirmation battle is shaping macro conditions for Bitcoin and altcoins, the CryptoGates news feed breaks it down without the noise.

    SYSTEM ACCESS: CG4.2

    Stop Guessing.
    Stress Test Your Edge.

    The market doesn’t care about your backtest. Our engine simulates 1,000+ “what-if” scenarios to ensure your strategy is built for survival.

    Run Crypto Strategy Engine →
    ROBUSTNESS SCORE
    75+ STRUCTURAL EDGE
    RISK OF RUIN < 1%
    TARGET HIT 92%

    FAQs

    What is Kevin Warsh’s position on interest rates, and how could it affect crypto prices?

    Warsh has recently supported lower rates in the near term, citing potential productivity-driven growth—lower rates historically increase liquidity and tend to be bullish for risk assets, including crypto.

    A leadership vacuum at the Fed creates policy uncertainty, which typically triggers risk-off behavior across markets — Bitcoin included — as traders wait for clearer signals.

    Tillis has said he won’t support any Fed nominee until a federal criminal investigation into current Chair Jerome Powell is fully and transparently resolved.

  • Quantum Computing Is Coming for Crypto: What Traders Need to Know

    Quantum Computing Is Coming for Crypto: What Traders Need to Know

    Quantum computing just moved from theory to urgent reality.

    New research has slashed the qubit count needed to break blockchain encryption.

    Your wallet runs on cryptography that wasn’t built for this threat.

    Breaking crypto encryption now requires under 500,000 qubits, down from 20 million. Google Quantum AI.

    EXECUTIVE SUMMARY
    • The Problem: Blockchain encryption was never built to survive a quantum attack.
    • The Solution: Post-quantum cryptography standards now exist, and some blockchains are already adopting them.
    • The Incentive: Knowing which projects are being prepared helps you make smarter long-term decisions.
    • The Risk: Slow-moving projects could lose trader trust before any attack even happens.

    What Quantum Computing Actually Does to Crypto

    Most people think quantum computing is just a faster computer.

    It’s not.

    Classical computers use bits, a 0 or a 1. Quantum computers use qubits, which can be both at once.

    That lets them crack the math protecting your private keys.

    The same math Bitcoin and Ethereum have relied on for years.

    SYSTEM ACCESS: CG4.2

    Stop Guessing.
    Stress Test Your Edge.

    The market doesn’t care about your backtest. Our engine simulates 1,000+ “what-if” scenarios to ensure your strategy is built for survival.

    Run Crypto Strategy Engine →
    ROBUSTNESS SCORE
    75+ STRUCTURAL EDGE
    RISK OF RUIN < 1%
    TARGET HIT 92%
    Michele Mosca
    Estimates roughly a 1-in-7 chance that public-key cryptography gets broken in the near term.

    Michele Mosca, University of Waterloo

    Honestly, around four million Bitcoin wallets already have exposed public keys.

    That number should concern every serious trader.

    Which Chains Face the Most Risk

    Swipe to view full data →
    Blockchain Encryption Risk Level
    Bitcoin ECDSA High
    Ethereum ECDSA High
    Solana Ed25519 Medium-High
    PQC Chains Lattice-based Low

    CryptoGates’ portfolio tracker lets you check your chain exposure without guessing.

    Can quantum computers break Bitcoin today?

    No, but the Global Risk Institute says a cryptographically relevant machine is possible within 10 years.

    What the Crypto Industry Is Doing About Quantum Computing Crypto Security

    Look, progress is happening. Just not evenly.

    NIST finalized three post-quantum cryptography standards.

    Ethereum created a dedicated quantum research team.

    Their plan is a gradual migration, not a sudden switch.

    HISTORICAL DATA AUDIT

    Battle-Test Your Strategy
    Before the Market Does.

    Eliminate guesswork with institutional-grade backtesting for DCA, Grid, and Rebalance bots. Real historical data. Real-world results.

    EST. OPTIMIZATION +42% ROI Efficiency
    Start Backtest Now

    Sourced from 5+ Years of Exchange Data

    2026 is officially the “Year of Quantum Security,” backed by NIST, the FBI, and CISA. NIST

    Here’s the thing:

    Bitcoin has a harder road.

    Post-quantum signatures run several kilobytes versus the usual 70 bytes.

    That creates real on-chain friction.

    Is your project preparing now or waiting to react? Preparation costs less. Reaction costs more. Verify the roadmap before you trust the asset.

    ZAHEER, CEO CryptoGates

    Solana is testing optional quantum-safe vaults using hash-based, one-time signatures.

    Early stage, but it’s a real movement.

    Checklist

    • Bitcoin on a bc1 address (SegWit or Taproot)?
    • Does your chain have a post-quantum roadmap?
    • Stopped reusing wallet addresses?
    • Checked if your wallet supports PQC schemes?
    Should I switch to a quantum-safe wallet now?

    Not urgently, but watch which projects are actively building post-quantum defenses.

    Watch the Timeline, Not the Hype

    This isn’t today’s emergency.

    But it’s no longer a distant theory.

    The projects being prepared now are worth watching.

    Use CryptoGates to track your portfolio by chain and stay ahead as this develops.

    FAQs

    What is quantum computing, and why does it matter for crypto security?

    Quantum computers can break the elliptic curve cryptography protecting most blockchain wallets. The timeline is shrinking faster than most traders realize.

     Bitcoin and Ethereum carry the highest risk. Legacy Bitcoin addresses are especially exposed once a transaction reveals the public key.

    Move to BC1 Bitcoin addresses, stop reusing wallet addresses, and hold assets on chains with active post-quantum roadmaps.

  • Strategy’s Next Bitcoin Buy Comes With a $14.5B Warning

    Strategy’s Next Bitcoin Buy Comes With a $14.5B Warning

    Michael Saylor just posted “think bigger” on social media.

    If you’ve followed the strategy at all, you know what that usually means.

    Another Bitcoin buy is coming.

    Strategy currently holds 766,970 BTC, purchased at an average price of $75,644 per coin. CoinDesk

    The company bought nearly three times more Bitcoin in March than miners produced that same month.

    That’s not a small position.

    That’s a company consuming supply faster than the network can create it.

    EXECUTIVE SUMMARY
    • The Problem: Strategy holds 766,970 BTC at an average price of $75,644, sitting on roughly $14.5 billion in unrealized losses with no pause in sight.
    • The Solution: Its STRC preferred equity structure only needs a 2.05% annual Bitcoin return to cover dividends, keeping the model technically alive even at low growth.
    • The Incentive: Buying well above new miner supply means Strategy is betting hard on scarcity-driven price appreciation to validate the position over time.
    • The Risk: A prolonged Bitcoin stall or price drop stress tests the entire preferred equity structure, and that risk doesn’t disappear just because the threshold looks small.

    What the “Think Bigger” Signal Actually Means for Bitcoin

    Saylor has used this kind of language before major purchases.

    It’s a pattern.

    Retail traders who aren’t watching it are missing a real market signal.

    Look, the supply math here matters more than most people realize.

    When a single company absorbs close to three times the monthly miner output, that directly tightens available Bitcoin on the open market.

    Strategy bought nearly 3x more Bitcoin than miners produced in March. CoinDesk

    Honestly, that pace of accumulation is extraordinary.

    Most institutional buyers work quietly.

    Strategy does the opposite, and the market watches every move.

    Strategy’s buying pace is removing significant liquid supply from the market, which structurally supports price over the medium term.

    Wait — it’s worth being clear here.

    This doesn’t mean the price goes up automatically.

    Supply tightening creates conditions. It doesn’t guarantee outcomes.

    Why Does Strategy Keep Buying Bitcoin Even When It’s Losing Money?

    Strategy’s STRC structure only needs a 2.05% annual BTC return to cover dividends, so it’s built to bet on long-term scarcity rather than short-term prices.

    The $14.5 Billion Hole, Risk Traders Can’t Ignore

    HISTORICAL DATA AUDIT

    Battle-Test Your Strategy
    Before the Market Does.

    Eliminate guesswork with institutional-grade backtesting for DCA, Grid, and Rebalance bots. Real historical data. Real-world results.

    EST. OPTIMIZATION +42% ROI Efficiency
    Start Backtest Now

    Sourced from 5+ Years of Exchange Data

    Here’s the thing.

    Unrealized losses at this scale aren’t just a number on a screen.

    They represent real structural pressure if Bitcoin doesn’t cooperate.

    The company funds its accumulation through STRC, a preferred equity product.

    The math sounds almost too clean: just a 2.05% annual Bitcoin return covers the dividend obligation.

    That’s roughly one decent price move in a normal market cycle.
    But that’s exactly what makes it fragile.

    A market that stops moving, or worse, moves the wrong way for an extended stretch, puts that 2.05% threshold under real pressure.

    Expert Tip:

    Preferred equity structures tied to volatile assets like Bitcoin carry compounding risk when prices flatline. The low threshold is a feature in bull markets and a liability in extended sideways or bear conditions.

    What to Watch Before Trading Around Strategy’s Moves

    • Is Bitcoin currently trading above or below $75,644, Strategy’s average buy price?
    • Has Saylor posted a “think bigger” or similar signal on social media recently?
    • Is Bitcoin miner supply expanding or tightening this month?
    • Is the broader market in risk-on or risk-off mode right now?

    Before reacting to Strategy’s next move, it’s worth stress-testing your own BTC exposure first.

    CryptoGates lets you model different price scenarios, so you know exactly what your position looks like before you risk real money… not after.

    Strategy’s Position at a Glance

    Swipe to view full data →
    Metric Current Number What It Means
    Total BTC Held 9766,970 Largest corporate BTC holder globally
    Average Buy Price $75,644 Unrealized loss if BTC trades below this
    Unrealized Loss ~$14.5 billion Paper loss, not realized unless sold
    STRC Dividend Threshold 2.05% annual BTC return Minimum growth needed to cover dividends
    March Buy vs. Mined ~3x miner output Shows the accumulation pace vs. the new supply
    Does Strategy’s buying directly push Bitcoin’s price up?

    It reduces available supply significantly, which can create upward pressure, but it doesn’t guarantee price moves.

    What Traders Should Watch Next

    Strategy is signaling another buy while sitting on billions in unrealized losses, but its structure only needs minimal BTC growth to stay functional.

    Watch Bitcoin’s price relative to the $75,644 average, watch Saylor’s social signals, and watch miner output trends.

    Don’t trade the headline. Use CryptoGates to map your risk before the next move hits.

    SYSTEM ACCESS: CG4.2

    Stop Guessing.
    Stress Test Your Edge.

    The market doesn’t care about your backtest. Our engine simulates 1,000+ “what-if” scenarios to ensure your strategy is built for survival.

    Run Crypto Strategy Engine →
    ROBUSTNESS SCORE
    75+ STRUCTURAL EDGE
    RISK OF RUIN < 1%
    TARGET HIT 92%

    FAQs

    What is Strategy’s average Bitcoin buy price?

    Strategy holds 766,970 BTC at an average purchase price of $75,644 per coin. Depending on where Bitcoin trades today, the company is carrying significant unrealized losses on its books.

    STRC is Strategy’s preferred equity instrument used to fund ongoing Bitcoin purchases, requiring only about a 2.05% annual BTC return to cover its dividend obligations. If Bitcoin stagnates or drops for an extended period, this structure faces serious financial stress.

  • Crypto Analysis for Beginners 📊: Buy with Evidence 📈 Instead of Emotion ⚠️

    Crypto Analysis for Beginners 📊: Buy with Evidence 📈 Instead of Emotion ⚠️

    You bought a coin because someone in a Telegram group said it was “the next 100x.”

    Sound familiar?

    Most people’s first crypto trade goes exactly like that. No research. No plan. Just vibes and hope, and the data backs it up: most day traders lose money within their first year of getting started.

    That’s not investing. That’s gambling with extra steps.

    Mark Douglas,
    “Most traders lose not because the market is rigged, but because they act before they think.”

    Mark Douglas, Trading in the Zone

    The traders who actually build wealth in crypto, the ones who don’t get wiped out every bear market, aren’t smarter than you.

    They just analyze before they act.

    And crypto analysis for beginners isn’t nearly as complicated as most people make it sound.

    EXECUTIVE SUMMARY
    • The Problem: Most crypto beginners buy based on hype and tips, not research, and lose money because of it.
    • The Solution: Crypto analysis combines fundamental, technical, and sentiment approaches to help you verify before you buy.
    • The Incentive: Test any strategy against real historical data before risking actual money, not after.
    • The Risk: Analysis isn’t about being perfect. It’s about making fewer emotional decisions and more data-backed ones.

    Why Most Beginners Skip Analysis (And Regret It)

    Here’s the truth: analysis feels boring. Charts, whitepapers, tokenomics—none of it gives you the same rush as seeing a coin go up 40% in a day.

    So people skip it.

    Do I need to understand charts before buying any crypto?

    Not fully, but knowing basic trend direction (up, down, sideways) alone protects you from most beginner mistakes.

    They chase the pump.

    They buy at the top.

    Then they watch it crash and tell themselves crypto is a scam.

    It’s not a scam.

    It’s just that most people enter without doing the homework.

    There are basically two types of people in crypto: those who verify before they buy and those who find out the hard way why they should have.

    LIVE DATA FEED // UNFILTERED

    The Truth in Numbers.

    Designed for the 10% who require absolute clarity. We strip away the hype to reveal the structural reality of the crypto markets.

    11.6M TOKENS DEFUNCT (2025)
    “The Illusion of the Infinite Pump.” Most assets are designed to fail. We track the ones that don’t.
    ⚠ Shocking Crypto Statistics

    The Two Pillars: Fundamental and Technical Analysis

    Crypto analysis for beginners starts with understanding two main approaches. Both matter. Neither one alone is enough.

    “Projects with active GitHub development are 3x more likely to survive a bear market than those with little to no code commits.” Messari Crypto Research

    1. Fundamental Analysis

    Fundamental analysis is about asking: Is this project actually worth anything?

    You’re looking at what problem the coin solves, who’s building it, whether the technology is real, and whether people are actually using it.

    You’d check things like the team’s track record, tokenomics and supply structure, development activity on GitHub, and whether the project has real partnerships or just a flashy website.

    Ethereum is a classic example of strong fundamentals, a real use case, a massive developer community, and a roadmap that kept delivering.

    That’s why it survived multiple crashes that wiped out hundreds of other coins.

    Research Insight

    Dogecoin’s 2021 sentiment-driven spike is a useful cautionary tale, but it also raises a fair question: what does a disciplined approach look like when a coin is being driven by hype rather than fundamentals?

    CryptoGates ran a systematic DCA test on DOGE during a separate 60-day stretch where the coin dropped 34.4% following a wave of concentrated, whale-driven selling — the mirror image of a sentiment-fueled pump. Rather than reacting emotionally to the drop, the bot executed 14 scheduled sessions with fixed rules, and 13 of them closed in profit, returning $924.23 net.

    The result isn’t proof that timing doesn’t matter — it’s evidence that removing emotion from execution reduces the damage sentiment-driven volatility usually causes. That’s the same discipline this section is asking beginners to build manually.

    View Complete Playbook: DOGE Crashed 34% in 60 Days — Our DCA Bot Made +$924.23 Anyway

    2. Technical Analysis

    Technical analysis is different. It doesn’t care about what a project does; it only looks at price and volume on a chart.

    The idea is that market behavior follows patterns, and those patterns repeat.

    Things like moving averages, support and resistance levels, and momentum indicators help you figure out when to enter a trade or when to stay out.

    Swipe to view full data →
    Factor Fundamental Analysis Technical Analysis
    Focuses on Project value & team Price & volume patterns
    Best used for What to buy When to buy
    Key tools Whitepapers, GitHub, tokenomics Charts, moving averages, RSI
    Time horizon Long term Short to medium term
    Works alone? Partially Partially

    In April 2019, Bitcoin crossed above its 200-day moving average, a signal that technical analysts watch closely.

    Combined with rising volume, it pointed to the rally that followed months later.

    You don’t need to master all of it at once.

    Even understanding basic support and resistance levels puts you ahead of most beginners.

    Sentiment Analysis: The Wild Card

    There’s a third layer worth knowing about, especially in crypto. “Sentiment analysis” means reading the room; what’s the mood on Twitter, Reddit, and Telegram?

    Is everyone excited or panicking?

    Sentiment doesn’t tell you if a project is good. Dogecoin proved that.

    “In early 2021, Dogecoin surged over 15,000% driven almost entirely by social media sentiment before losing over 80% of its value.”                         CoinMarketCap historical data

    Sentiment can create short-term price explosions that have nothing to do with reality.

    Knowing how to read it helps you avoid buying into the frenzy at exactly the wrong time.

    The lesson isn’t to ignore sentiment; it’s to never let it be your only signal.

    Why Combining Methods Beats Picking Just One

    Here’s where beginners go wrong, even after they learn the basics.

    They pick one method and stick to it religiously. Pure technical traders sometimes miss massive moves that were obvious from the fundamentals.

    Before You Buy Any Crypto

    • Does this project solve a real problem?
    • Is the team active and experienced?
    • What is the chart trend right now (up, down, sideways)?
    • Is the crowd calm or in full hype mode?
    • Have I tested this strategy on historical data?

    Pure fundamental investors sometimes buy too early or too late because they ignore what the chart is saying.

    The traders who consistently do well use all three.

    They find a project with solid fundamentals.

    They check whether the sentiment is reasonable or in pure mania mode.

    Then they use the technical chart to find a smarter entry point instead of just buying whenever they feel ready.

    We built CryptoGates because we kept watching people buy on hope and lose on reality. Analysis isn’t about being right every time. It’s about not being reckless any time. Verify first. Risk later.

    ZAHEER, CEO CryptoGates

    Think of it this way:

    Fundamentals tell you what to buy, technicals tell you when to buy, and sentiment tells you how crazy the crowd is right now.

    You need all three pieces.

    The Mistake That Costs People the Most

    Confirmation bias. It’s when you’ve already decided you love a coin and you only look for information that backs that up.

    You ignore the red flags. You dismiss the critics. You convince yourself the crash is temporary.

    How do I avoid confirmation bias in crypto?

    Before buying, spend five minutes actively looking for reasons NOT to buy. If it still holds up, your conviction is real.

    This happens to everyone, including experienced traders.

    The fix is simple but uncomfortable: actively look for reasons not to buy something.

    If a coin still makes sense after you’ve tried to poke holes in it, that’s a much stronger signal than one you only viewed through rose-colored glasses.

    Real Backtest Example

    Strategy: DCA
    Coin: BTC/USDT
    Market Condition: Sharp macro-driven crash (BTC fell from $87K to $74K in weeks)
    Objective: Test whether a rules-based DCA approach holds up during a fear-driven sell-off triggered by external news, not project fundamentals

    Key Result: 16 of 17 sessions closed via take-profit, delivering $349.61 in net profit while spot holders were sitting on unrealized losses through the same window.

    Expert Interpretation: This is precisely the kind of scenario where beginners abandon a plan mid-drawdown because the news cycle feels urgent. The backtest shows the strategy’s rules didn’t need to predict the recovery — they just needed to be tested in advance so the trader already knew how the system behaved under pressure, before real money was on the line.

    View Complete Playbook: The Tariff Trap Playbook — How a DCA Bot Turned BTC’s Worst April in Years Into +$349 Profit

    How to Start Without Getting Overwhelmed

    You don’t need to become a data scientist.

    Start with three questions before any trade: What does this project actually do, and does anyone need it? What does the chart look like? Is the trend up, down, or sideways? And what’s the general mood around it? Calm and steady, or everyone screaming about Lambos?

    That simple checklist beats 90% of decisions made purely on gut feeling.

    The other thing beginners skip is testing. Most people jump straight to real money without ever checking whether their approach actually works. That’s backwards. You’d never open a restaurant without tasting the food first.

    That’s exactly what the Crypto Backtesting Guide at CryptoGates.io is built for.

    HISTORICAL DATA AUDIT

    Battle-Test Your Strategy
    Before the Market Does.

    Eliminate guesswork with institutional-grade backtesting for DCA, Grid, and Rebalance bots. Real historical data. Real-world results.

    EST. OPTIMIZATION +42% ROI Efficiency
    Start Backtest Now

    Sourced from 5+ Years of Exchange Data

    Before you risk a single dollar, you can run your strategy against five-plus years of real historical data and see how it would have actually performed.

    The Monte Carlo simulator takes it further, running over a thousand what-if scenarios, so you understand your risk before it becomes your reality.

    SYSTEM ACCESS: CG4.2

    Stop Guessing.
    Stress Test Your Edge.

    The market doesn’t care about your backtest. Our engine simulates 1,000+ “what-if” scenarios to ensure your strategy is built for survival.

    Run Crypto Strategy Engine →
    ROBUSTNESS SCORE
    75+ STRUCTURAL EDGE
    RISK OF RUIN < 1%
    TARGET HIT 92%

    When you combine your own analysis with that kind of data-backed testing, you stop guessing.

    You start trading with evidence.

    Start With Data, Not Hype

    Crypto doesn’t have to be a minefield. The people who lose money aren’t unlucky; they’re usually just skipping the steps that protect them.

    Fundamental research, chart awareness, sentiment reading, and backtesting before real money—that’s the process.

    It’s not flashy. It won’t make you feel like a genius at a party. But it works.

    FAQs
    What’s the difference between fundamental and technical analysis in crypto?

    Fundamental analysis checks if a project is worth something. Technical analysis reads price charts to figure out when to buy. Serious traders use both.

    Yes, no degree needed. Start with three questions: does it solve a problem, what’s the chart doing, and is the crowd hyped or calm?

    Run it on historical data first. CryptoGates.io’s Backtesting Lab tests your strategy across real market conditions before you risk a dollar.