

 Bitcoin
 Ethereum
 Solana
 TRON
 Hyperliquid
 Zcash
 Dogecoin
 Monero
 Chainlink
 Cardano
 Stellar
 Uniswap
 Sui
 Hedera
 Shiba Inu
 Bittensor
 Ripple USD
 Aster
 Polkadot
 World Liberty Financial
 Render
 Artificial Superintelligence Alliance

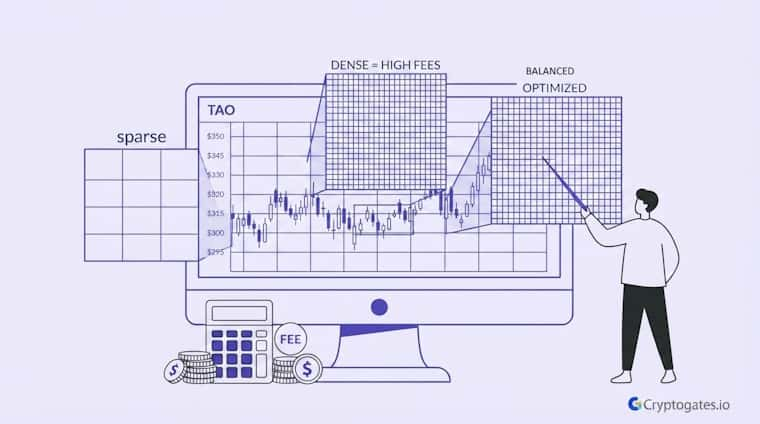
TAO spent weeks doing something most traders hate: nothing.
No breakout, no crash, just a slow bounce between $295 and $350, over and over.
Feels boring, right?
But here’s the thing. That “boring” chop is exactly where a TAO grid trading strategy either quietly prints or quietly bleeds out on fees, and almost nobody checks which one is actually happening until it’s too late.
Most guides tell you to just add more grids for more profit. Sounds logical. Except it’s not that simple, and the data from this exact setup proves it.
- The Problem: Traders assume more grids always means more profit, so they max out grid count without checking what it does to fees.
- The Solution: Testing the same range and capital across sparse, dense, and optimized grid counts shows where returns actually improve and where they just add noise.
- The Incentive: Understanding this tradeoff means you stop guessing grid settings and start setting them based on what the range and fee structure actually support.
- The Risk: Overgridding a range can quietly erode gains through fee drag, even when the strategy looks "more active" on paper.
The Setup - TAO's $295 to $350 Chop Zone
After a sharp run-up from the $170s, TAO’s rally stalled out near $370. Momentum just kind of ran out of gas.
What followed was a defined range: price kept testing $295 on the low end and getting rejected between $345 and $350 on the high end.
Confused about
market outlook?
Trading without a plan is just gambling. Our strategy architect analyzes your risk tolerance and capital to match you with a proven algorithmic framework.
Zoom out for a second, and this is a textbook range-bound setup.
Not trending up, not trending down, just chopping between two walls.
For grid bots specifically, that’s exactly the condition range-bound grid trading is designed to exploit.
1. Why TAO Stopped Trending and Started Ranging
Here’s the interesting part.
Strong rallies almost always cool off the same way: buyers who chased the top start taking profit, new buyers hesitate, and price gets stuck between the last group defending their entry and the next group waiting for a discount.
That tug-of-war is what creates a range.
Real Backtest Example
TAO’s $295–$350 chop isn’t a one-off pattern – grid bots have been tested in nearly identical dead-zone conditions before, with results that back up why range-bound markets suit this strategy.
Strategy: Grid Bot
Coin: SOL/USDT
Market Condition: 60-day range-bound “dead zone” following a post-crash drift, no clear directional trend
Objective: Extract profit from sideways price action without predicting direction
Key Result: 146 trades executed, $462.95 in net profit, a +10.88% advantage over simple buy-and-hold
Expert Interpretation: A moderate grid count matched to a defined range produced steady fills without excessive trading — the same principle that determines whether TAO’s setup rewards a sparse, dense, or optimized grid count.
SOL’s “Institutional Purgatory”: Extracting Grid Profits from the $80–$97 Post-Crash Dead Zone
TAO’s case wasn’t unusual. Once the move above $370 lost steam, the price didn’t reverse hard either.
It just settled.
And a settled market with no clear direction is where directional strategies like spot buy and hold tend to underperform, while a range-bound grid trading strategy gets its shot.
2. Mapping the Battle Zone - Support at $295, Resistance at $345–350
This range wasn’t picked randomly. $295 held multiple times as support, and $345 to $350 kept capping upside attempts.

BYDFi Grid Trading Analysis, Novinite, 2026
That gave a clean, repeatable boundary to build a grid around, which matters because a grid bot is only as good as the range it’s told to work inside.
The Grid Density Face-Off - 15 vs 35 vs 60 Grids
So here’s where it gets interesting. Same $295 to $350 range. Same 3,500 USDT in capital.
Same 3% profit target per grid.
The only thing that changed across the three tests was grid density and price boundary optimization — specifically, how many grids were packed into that range.
That’s it. One variable, isolated on purpose.
Stop Guessing.
Stress Test Your Edge.
The market doesn't care about your backtest. Our engine simulates 1,000+ "what-if" scenarios to ensure your strategy is built for survival.
Run Crypto Strategy Engine →Why does that matter?
Because it’s the only way to actually see what grid count does on its own, without other settings muddying the result.
Test A - Sparse Grid (15 Grids)
Fifteen grids across that range means each grid level sits pretty far apart.
Fewer trigger points, fewer fills, but each fill captures a bigger chunk of price movement.
Think of it like fishing with a few large nets instead of a hundred small ones. You catch less often, but what you catch tends to be bigger per catch.
Test B - Dense Grid (35 Grids)
Thirty-five grids more than double the density.
More levels packed into the same $55 wide range mean the bot reacts to smaller price wiggles, not just the big swings.
More trades fire here, and each one captures a smaller slice of movement.
Test C - Optimized Grid (60 Grids)
At 60 grids, spacing gets tight.
Really tight.
This setup trades the most often out of the three, reacting to almost every minor wobble inside the range. On paper, that sounds like the “best” version.
In practice, this is exactly the kind of overgridding that shows up among the grid trading mistakes real backtests expose, where fee drag chips away at each individual win.

Not automatically. More grids mean more trades, but each trade also pays fees. Past a certain density, the extra fills stop adding meaningful profit and start adding meaningful cost.
Honestly, this is the setup most beginners default to, because more feels like it should mean better.
What the Backtest Data Actually Shows
Here’s what most people miss. When you actually run the numbers across all three configurations, the return profile doesn’t scale the way instinct suggests.
Going from 15 grids to 60 grids didn’t produce a dramatically better outcome. It produced a slightly better one, with a lot more activity required to get there.
ROI and Grid Profit Side by Side
All three tests landed in a surprisingly tight band.
The sparse setup, the dense setup, and the optimized setup all delivered returns that were close to each other, not wildly different.
The gap between “few grids” and “a lot of grids” was smaller than you’d expect given how differently they trade.
| Setup | Grid Density | Trade Frequency |
|---|---|---|
| Test A | Sparse (15) | Low |
| Test B | Dense (35) | Moderate |
| Test C | Optimized (60) | High |
That’s the part that catches people off guard.
More grids meant meaningfully more trades. It did not mean a proportionally bigger return.
Fee Drag - The Hidden Cost of Density
This is where it clicks.
Every single fill, buy, or sell pays a fee. Sixty grids mean far more fills than fifteen grids across the same range and timeframe. Each individual fee is small.
Tiny, even.
But stack hundreds of them, and it starts eating into the raw grid profit before it ever reaches your total return.
Research Highlight
One pattern shows up consistently across CryptoGates grid backtests: the gap between gross grid profit and net profit widens as trade count climbs — the exact fee-drag dynamic Test C is built to expose.
Strategy: Grid Bot
Coin: XRP/USDT
Market Condition: 90-day near-perfect flatline, price essentially unchanged from start to finish
Objective: Test how a high-density grid performs when a market goes nowhere
Key Result: 875 trades fired, generating $1,817.91 in gross grid profit — but fees trimmed that down to $1,387.14 net, a 27.74% return
Expert Interpretation: Even in a strategy built for chop, roughly a quarter of gross profit was absorbed by trading costs at high density. That’s the same tradeoff sitting underneath the 60-grid “optimized” test – more fills don’t automatically mean more money left over.
XRP Went Nowhere for 3 Months — Our Grid Bot Made +27.74% Anyway
The denser setup traded the most, and it also handed the most back in fees. Which means the “optimized” label wasn’t about being the most active.
It was about the setup where trade frequency and fee cost balanced out best against the range width.
That’s the overlooked factor. Not activity. Balance.
What This Means for Your Own Grid Setup
Look, grid count isn’t a “set it high and walk away” decision.
It depends on how wide your range is, how volatile the asset has been, and what your exchange charges per trade.

Zaheer's take on this one is simple. More activity looks impressive on a dashboard, but it's not the same thing as more edge. Verify what a denser grid actually costs you in fees before assuming it's the better setup.
A $55 range on a mid-cap asset behaves very differently than a $5,000 range on BTC.
1. When Sparse Grids Make Sense
Wider, choppier ranges with real distance between support and resistance tend to favor fewer grids.
Fewer fills, sure, but each one captures a bigger swing, and fee drag stays low because there just aren’t that many trades happening.
2. When Dense Grids Make Sense
Tighter ranges with frequent small oscillations can justify more grids, but only if the exchange fee is low enough that each tiny fill still nets something after costs.
Otherwise, you’re just generating fee volume for the exchange, not profit for yourself.
Interactive Checklist
- Confirm your range width before setting grid count
- Check your exchange's per-trade fee percentage
- Match grid density to the asset's recent volatility, not a fixed number
- Backtest at least two grid densities before going live
- Re-check spacing if price starts approaching your range boundary
Ser, this is exactly why testing beats guessing.
There's no fixed number that works everywhere. Start with a moderate density, backtest it against your exact range and fee rate, and adjust from there instead of guessing high or low.
Running your own parameters through the Grid Strategy Backtest Bot shows you where your specific range and fee setup lands, instead of copying someone else’s grid count and hoping it holds up.
The Real Takeaway From TAO's Grid Face-Off
At the end of the day, grid density changes how a bot trades, not automatically how much it earns.
TAO’s $295 to $350 range showed that sparse, dense, and optimized setups all landed in a similar return zone, but they got there through very different amounts of activity and fee exposure.
Battle-Test Your Strategy
Before the Market Does.
Eliminate guesswork with institutional-grade backtesting for DCA, Grid, and Rebalance bots. Real historical data. Real-world results.
The lesson isn’t “use more grids” or “use fewer grids.” It’s to test your specific range and fee structure before assuming either extreme works.
If you want to see how your own capital and pair behave across different grid counts, the Grid Strategy Backtest Bot lets you run it before risking anything real.
FAQs
What is grid density in a grid trading bot?
Grid density refers to how many buy and sell levels are placed within a set price range. Higher density means tighter spacing and more frequent trades.
Does a tighter grid range always mean higher returns?
Not always. Tighter spacing increases trade frequency, but it also increases fee exposure, which can offset the extra activity.
How do fees affect grid bot profitability?
Every filled grid order pays a fee. In dense setups with many small fills, those fees can meaningfully reduce the raw profit the bot generates.