Author: Sajid Hussain

  • The One Setting 🎯 That Makes or Breaks Volatile 🔄 Altcoin Rebalancing Bots ⚖️

    The One Setting 🎯 That Makes or Breaks Volatile 🔄 Altcoin Rebalancing Bots ⚖️

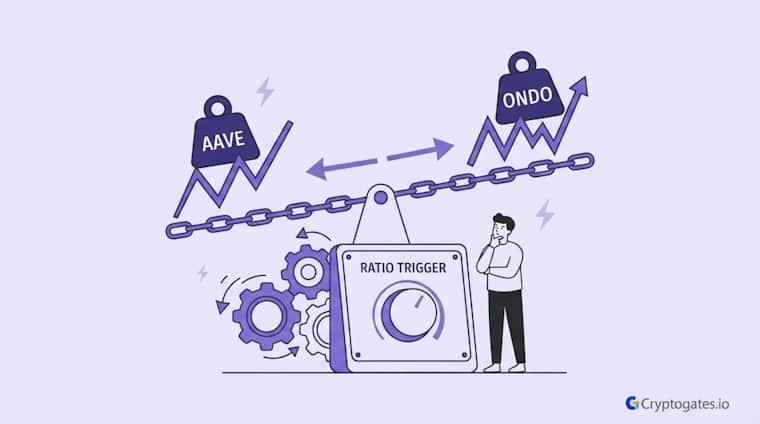
    Ever paired a stable-ish blue chip with a coin riding a hot narrative, then watched your rebalance bot fumble the exit timing?

    That’s basically what happened with AAVE and ONDO.

    One asset chopped sideways for months.

    The other broke out hard on the RWA narrative.

    And the only thing standing between solid gains and leaving money on the table was one number: the coin ratio trigger.

    The tokenized real-world asset sector jumped more than 260% in a single stretch, crossing the $23 billion mark.

    Source: Cointelegraph (Binance Research)

    This is exactly why testing a crypto rebalancing strategy for volatile altcoins matters more than picking the “right” coins, ser.

    The coins aren’t the real variable here.

    The trigger is.

    EXECUTIVE SUMMARY
    • The Problem: A “safe” stable-plus-breakout pair still bleeds if the trigger setting is wrong.
    • The Solution: Testing AAVE/ONDO at 1%, 2%, and 5% triggers shows how trigger width trades fees for trend capture.
    • The Incentive: The loosest trigger delivered the highest return using a tenth of the trades.
    • The Risk: Too loose a trigger can mean rebalancing late if the trend suddenly reverses.

    Why AAVE and ONDO Make a Perfect Divergence Test

    Look, most rebalance backtests use two coins that move together, unlike our BTC/ETH divergence autopsy.

    That’s kind of pointless if you’re trying to learn something.

    This one’s different.

    AAVE spent the test window basically going nowhere in a wide range, while ONDO caught a real narrative wave and broke out hard.

    Swipe to view full data →
    Asset Role in Test Price Behavior
    AAVE Ballast (stability anchor) Range-bound, chopped between roughly 135 and 250
    ONDO Breakout leg (RWA narrative) Climbed steadily off a low base before fading late
    Portfolio 50/50 starting split Rebalanced automatically as the gap between the two widened

    That gap between a “ballast” asset and a “runner” asset is exactly what makes a crypto rebalancing strategy for volatile altcoins worth studying in the first place, because it forces the bot to make real decisions instead of just following two correlated charts up and down together.

    1. What “Ballast” Means in a Rebalance Portfolio

    Think of AAVE here like ballast in a ship.

    It doesn’t do much on its own, but it keeps the whole thing from tipping over when ONDO starts moving fast.

    Real Backtest Example

    The AAVE/ONDO test isn’t the only divergence pair in CryptoGates’ internal research.

    A separate backtest ran ETH against XRP over four months, where ETH quietly compounded a 14% gain while XRP essentially went nowhere. The setup mirrors the ballast-versus-runner structure above, just with the roles reversed: XRP played the flat anchor, ETH did the climbing.

    The rebalance bot didn’t need to predict which asset would move. It only needed a trigger wide enough to let ETH’s gain build before locking part of it into the flat leg. That test closed ahead of passive holding by capturing the value of the gap between the two assets — the same mechanic driving the AAVE/ONDO result above, just on a different pair and timeframe.

    The consistency across pairs suggests trigger sizing, not coin selection, is the transferable lesson.

    ETH Rose 14% While XRP Sat Flat →

    Every time ONDO’s value pulled ahead of the 50/50 split, the bot sold a slice of it and topped up AAVE, locking in gains along the way instead of hoping the breakout lasts forever.

    2. The Single Variable Being Tested

    Everything else in this test stayed frozen. Same pair, same 3,500 USDT starting size, same Binance fee, same time window.

    What is a coin ratio trigger in a rebalancing bot?

    It’s the percentage a coin’s weight has to drift from its target allocation before the bot automatically buys or sells to bring it back in line. A tighter percentage means more frequent, smaller rebalances.

    The only thing that changed across the three runs was the Coin Ratio Trigger, set at 1%, 2%, and 5%.

    That’s it.

    One dial, three positions.

    What Tightening or Loosening the Trigger Actually Does

    Here’s the interesting part.

    All three tests used the exact same coins, same 3,500 USDT, same fee structure.

    The only dial that moved was the Coin Ratio Trigger, and it dragged everything else along with it, trade count, fee drag, and final return.

    Shorter rebalancing intervals don’t add a meaningful bonus to returns, but they do stack up fees fast, with daily rebalancing on a similar-sized portfolio eating close to 4.5% in trading costs alone.

    Source: HackerNoon (Sia)

    Test A ran a 1% trigger and fired 50 rebalances.

    Test B ran a 2% trigger and fired 17.

    Test C, the loosest at 5%, only fired 5 times.

    And here’s the part that trips people up: more trades didn’t buy more profit. It bought more fee drag, plain and simple.

    1. Test A vs Test B vs Test C — Reading the Trade-Off

    Test A closed at a 48.68% ROI with 1,703.87 USDT in profit.

    Test B landed at 49.06% ROI with 1,717.06 USDT.

    Test C, running the loosest trigger, closed at 49.60% ROI and 1,735.85 USDT, using just 5 trades to get there.

    Interactive Checklist

    • Is one of your assets range-bound and the other trending hard, or are they moving together?
    • Can your exchange fee tier absorb frequent small rebalances without eating your edge?
    • Are you optimizing for hands-off automation or for tight risk control?
    • Have you run the same pair through the Rebalance Strategy Backtest Bot at more than one trigger width?
    • Does your risk tolerance actually match a looser trigger, or does that make you nervous?

    Same starting capital. Same coins.

    Different outcome purely because of trigger width.

    Research Insight

    It’s tempting to assume a tighter trigger is always the “safer” or more responsive choice. Another internal test challenges that assumption. When XRP surged 44.6% over four months while BNB delivered a quieter 7.4%, the bot needed only three rebalances to beat passive holding — not because the trigger was loose by accident, but because fewer, well-timed rebalances let the outperforming leg keep compounding before capital got pulled back to the anchor.

    That result lines up with what the AAVE/ONDO test found: the loosest trigger, not the most active one, produced the strongest outcome.

    Across both pairs, the bot’s edge came from resisting the urge to rebalance every small drift, and instead waiting for the divergence to become meaningful before acting.

    This is worth remembering before defaulting to a tight trigger “just to be safe” — over-rebalancing has a cost, and that cost is often invisible until you look at the trade count next to the return.

    XRP Surged 45% in 4 Months — Did Rebalancing Beat Passive Holding? →

    2. Where the Hero Setup Pulled Ahead

    The 5% trigger basically let ONDO run further between each rebalance, which meant it captured more of the breakout leg before locking gains back into AAVE.

    CEO Note:

    “A tighter trigger feels safer because it ‘does something’ more often. But the data says the loosest trigger let ONDO’s breakout actually compound instead of getting clipped every time it moved. Verify first, don’t assume.”

    Ngl, that’s the whole story of this test in one sentence.

    What This Divergence Test Teaches About Trigger Sizing

    So here’s the bottom line.

    Running the same AAVE/ONDO pair through three trigger widths didn’t just produce three numbers, it showed that a crypto rebalancing strategy for volatile altcoins lives or dies on how you size the trigger, not on picking a “perfect” coin.

    A 5% threshold on a crypto portfolio typically triggers somewhere between 8 and 15 rebalances a year, while a 10% threshold cuts that down to 3 to 6, trading responsiveness for lower costs.
    Source: Spark Money

    The tightest setting felt the most active, but it also bled the most into fees.

    The loosest setting looked almost lazy, five trades over the whole window, yet it let the winning leg actually compound before locking gains.

    That’s not luck.

    Does a tighter rebalancing trigger always mean better returns?

    Not really. A tighter trigger locks in gains more often, but it also racks up more trades and more fees, which can eat into the edge it’s trying to protect.

    That’s math working in your favor when you stop overtrading your own edge, exactly the discipline gap behind why so few retail traders stay consistently profitable across full market cycles.

    HISTORICAL DATA AUDIT

    Battle-Test Your Strategy
    Before the Market Does.

    Eliminate guesswork with institutional-grade backtesting for DCA, Grid, and Rebalance bots. Real historical data. Real-world results.

    EST. OPTIMIZATION +42% ROI Efficiency
    Start Backtest Now

    Sourced from 5+ Years of Exchange Data

    Before you copy Test C’s 5% trigger onto your own pair, run it yourself.

    Correlation, volatility, and how “breakout-y” your second asset is will all shift the ideal number.

    Test this setup yourself using the Rebalance Strategy Backtest Bot on CryptoGates, no signup, no credit card, just build and see what your own parameters say.

    FAQs

    What is a good coin ratio trigger for a volatile altcoin pair?

    It depends on your fee tier and risk comfort, but this test shows wider triggers around 5% captured more of a breakout with far fewer trades and less fee drag.

    Not automatically. The pairing only worked well here because the trigger width let the breakout leg run before locking in gains, so the trigger setting mattered as much as the pair itself.

    In this test, a 1% trigger produced 50 trades over the window, while a 5% trigger produced only 5, a big difference in cumulative fees.

  • Why Your DCA Bot Buys Too Fast ⚡ (Or Too Slow) – The Step Percentage 🎯 Nobody Explains 📊

    Why Your DCA Bot Buys Too Fast ⚡ (Or Too Slow) – The Step Percentage 🎯 Nobody Explains 📊

    Ser, you spent twenty minutes picking your take profit percentage.

    Maybe even longer arguing with yourself over order size.

    But the step percentage field?

    You probably just left it at whatever the default was.

    Comparing lump-sum entry against phased entry across rolling one-year periods found the immediate approach won between roughly 62% and 74% of the time, showing how much entry timing alone can shift outcomes.

    Vanguard Research

    Here’s the thing.

    That one number decides how fast your bot spends your capital during a drop. Get the DCA step percentage wrong, and you either run out of dry powder halfway through a crash, or you miss the dip entirely because your orders never fire.

    Most traders don’t realize this until they’re staring at a backtest, wondering why their strategy underperformed a simple buy and hold, since timing and discipline decide which side of the profit gap you land on.

    EXECUTIVE SUMMARY
    • The Problem: Most traders set DCA step percentage without understanding it controls order timing, not profit potential.
    • The Solution: Test different step percentages against real price action to see how entry spacing changes your outcome.
    • The Incentive: A properly tuned step % can mean the difference between capturing a deep dip and running out of capital too early.
    • The Risk: A step that’s too tight or too wide can wreck your average entry price even if every other setting is perfect.

    What DCA Step Percentage Actually Controls

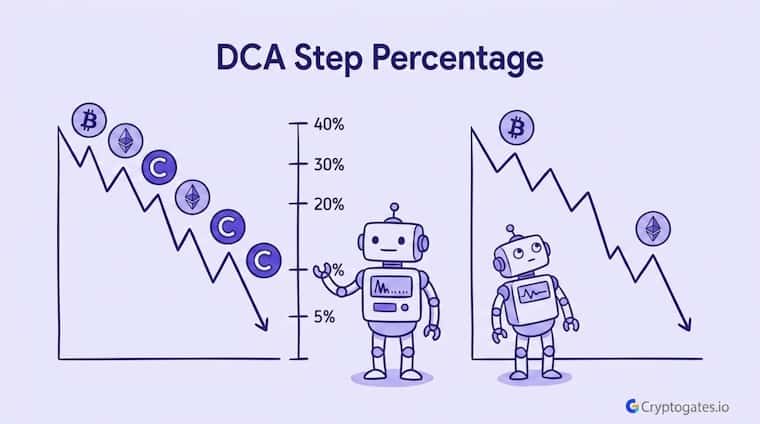
    Look, this part trips up a lot of beginners. DCA step percentage isn’t about how much you invest or how many orders you place.

    It’s about spacing. Specifically, it’s the price drop required before your bot places its next order.

    HISTORICAL DATA AUDIT

    Battle-Test Your Strategy
    Before the Market Does.

    Eliminate guesswork with institutional-grade backtesting for DCA, Grid, and Rebalance bots. Real historical data. Real-world results.

    EST. OPTIMIZATION +42% ROI Efficiency
    Start Backtest Now

    Sourced from 5+ Years of Exchange Data

    Set it to 3%, and your bot will wait for the price to fall another 3% from the last fill before buying again.

    Simple in theory.

    But here’s what most guides miss: that spacing decision compounds across every order in your sequence, since dollar-cost averaging’s core math is just the average purchase price divided across each fill.

    A tight step means your bot reacts fast to small dips. A wide step means it’s patient, holding back capital until the market gives it a real discount.

    A CFA Institute Research Foundation review found that systematic, rules-based entry strategies reduced behavioral timing errors by a wide margin compared to discretionary entries, largely because they remove the guesswork around “when” to buy.

    Think of step % like the gap between rungs on a ladder.

    Tight rungs get you climbing fast, but you run out of ladder quick.

    Wide rungs mean you’re covering more ground per step, but you might miss ground in between.

    Why This Number Gets Ignored By Beginners

    Honestly, it’s easy to see why.

    Base order size and take-profit percentage feel more “important” because they directly touch your P&L math.

    Step percentage feels technical, almost like a background setting.

    Real Backtest Example

    Strategy: DCA Bot (Tight Step)
    Coin: TAO/USDT
    Market Condition: Sharp reversal – 36% pump followed by a 17% round-trip loss
    Objective: Test whether tight order spacing could keep pace with a fast-moving reversal
    Key Result: A 1.5% step kept the bot firing on nearly every leg down — 139 of 140 sessions closed in profit, and the bot ended up +$1,677 even as spot holders were sitting on a 17% loss.
    Expert Interpretation: This is what a tight step is built for — reactive, high-frequency entries in a market that’s moving fast in both directions. The tradeoff is capital gets deployed early, so it works best when the asset doesn’t keep sliding indefinitely.

    TAO Pumped 36%, Then Bled Back to a 17% Loss — Our DCA Bot Still Banked +$1,677

    But that’s exactly the mistake.

    Your DCA Backtest Bot lets you run the same asset and capital across different step percentages side by side, and the P&L swings you’ll see between a 2% step and a 4% step can be significant.

    It’s not a background setting.

    It’s the setting.

    Tighter Step % vs Wider Step %

    Here’s where the real decision gets made.

    A tighter step percentage, say 2%, means your bot reacts to almost every small wobble in price. Orders fill fast.

    Capital gets deployed early.

    That feels good when the dip is shallow and the price recovers quickly.

    SYSTEM ACCESS: CG4.2

    Stop Guessing.
    Stress Test Your Edge.

    The market doesn’t care about your backtest. Our engine simulates 1,000+ “what-if” scenarios to ensure your strategy is built for survival.

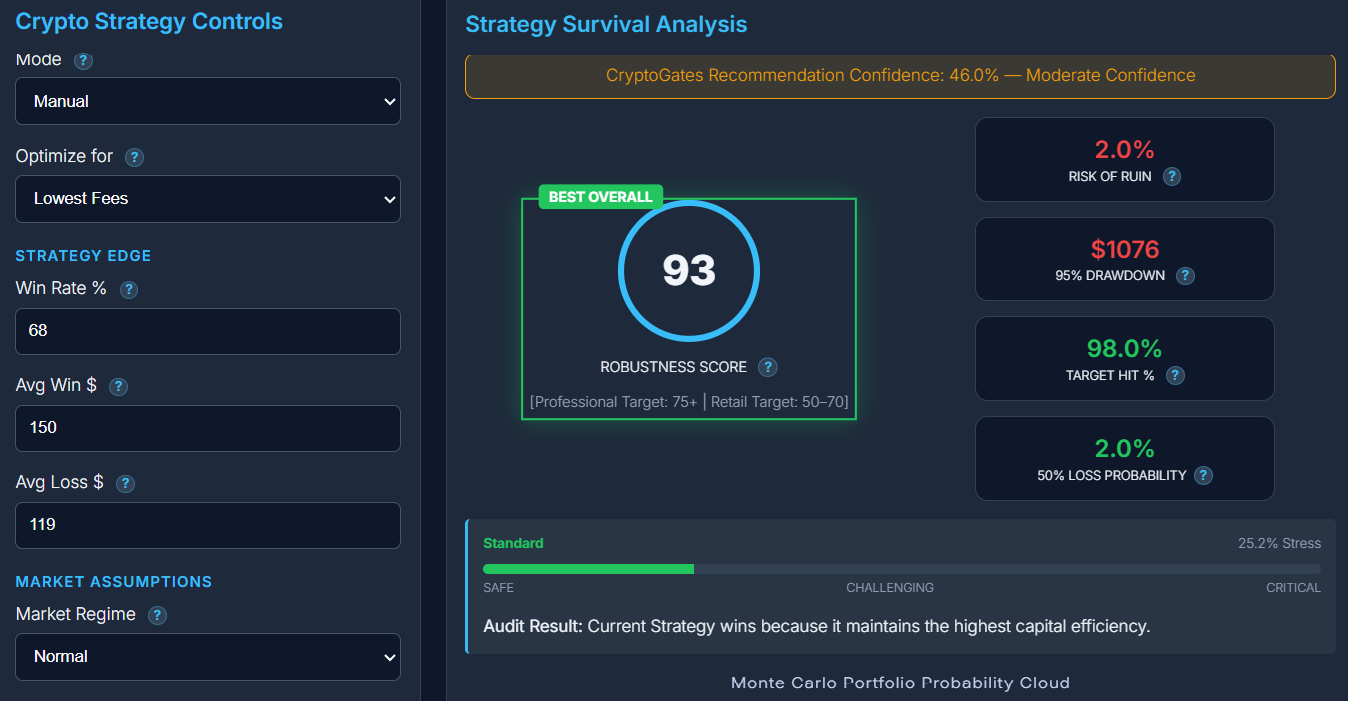
    Run Crypto Strategy Engine →
    ROBUSTNESS SCORE
    75+ STRUCTURAL EDGE
    RISK OF RUIN < 1%
    TARGET HIT 92%

    But wait.

    What happens when the drop keeps going?

    A tight step burns through your DCA orders before the bottom even shows up. You’re left fully deployed, no dry powder, watching the price keep falling.

    That’s the trap.

    A wider step, something like 4% or 5%, forces patience.

    Your bot waits for a real move before committing more capital. It gets you a better average entry price when corrections run deep.

    The tradeoff is you might miss shallower dips entirely, especially on assets that chop sideways more than they trend down hard.

    1. What Happens With A Tight Step

    Fast fills.

    Higher exposure earlier in the drawdown.

    Less room is left if the correction extends further than expected.

    This setup tends to work better in range-bound conditions where price doesn’t fall too far before bouncing back.

    2. What Happens With A Wide Step

    Slower fills.

    More capital held in reserve.

    Better average price if the market keeps sliding.

    The risk here is missing entries completely if the price never drops enough to trigger your next order, leaving capital sitting idle.

    Swipe to view full data →
    Step Type Fill Speed Best For
    Tight (2%) Fast Shallow, choppy dips
    Moderate (3%) Balanced Mixed volatility
    Wide (4-5%) Slow Deep corrections

    Running this comparison manually across dozens of scenarios would eat up your whole weekend.

    The DCA Backtest Bot handles it in minutes, letting you stack Strategy A, B, and C side by side against the same asset and timeframe, the same approach behind how a 2.5% step DCA bot turned a 45% ENA crash into $898 profit.

    What is a good DCA step percentage for crypto?

    There’s no single “good” number. It depends on the asset’s typical volatility. Choppier coins usually need wider spacing to avoid overexposure early.

    How Step Percentage Interacts With Volatility

    A step percentage that works beautifully in one market condition can completely fall apart in another.

    That’s the part most guides skip over. They treat step % like a fixed setting you pick once and forget.

    But markets don’t stay the same.

    An asset chopping sideways with 1-2% daily swings needs a different step than one prone to 10% single-day moves.

    Set your step too tight on a volatile asset, and you’ll blow through your entire DCA order count during one sharp drop, leaving nothing left if the price keeps sliding.

    Real Backtest Example

    Strategy: DCA Bot (Wide Step, Deep Correction)
    Coin: DOT/USDT
    Market Condition: Extended downtrend — 56% decline over 7 months
    Objective: See how a patient, wider-spaced DCA approach holds up across a correction with no quick bounce
    Key Result: 79 of 80 sessions closed in profit. The bot returned +$380.99 while spot holders were down −$617 on the same capital — a $998 gap over the same window.
    Expert Interpretation: This is the scenario wide steps are designed for. Holding capital back until price actually earns another entry meant the bot never ran dry, even seven months into a bleed that showed no sign of stopping.

    DOT Crashed 56% in 7 Months — We DCA’d Into DOT’s Worst Downtrend

    Zoom out for a second.

    The NEAR test above shows this in action. A 3% step landed 21 sessions with 56 orders and a solid P&L outcome across a mix of choppy and trending price action.

    A 2% step fired faster but caught fewer favorable entries, session 13 versus 21. More sessions, in this case, meant more chances to average into strength.

    Reading Market Conditions Before Setting Step %

    Realistically, you don’t need to predict the future here.

    You just need a rough sense of how the asset has behaved recently.

    Has it been ranging tight, or has it been swinging wide?

    A quick look at recent price history tells you more than any fixed rule ever could.

    Does DCA step percentage affect risk?

    Yes. A tighter step increases exposure earlier in a drawdown, while a wider step holds more capital back, directly changing how much risk you’re carrying at any point in the sequence.

    Fear and greed extremes, recent volatility spikes, whether the asset has been trending or chopping.

    All of it feeds into whether you want a tighter or wider step. This is exactly why backtesting beats guessing.

    You’re not asking “what step feels right“; you’re asking “what step actually performed better on this asset’s real price history.”

    Finding Your Step Percentage Sweet Spot

    There’s no universal DCA step percentage that works across every asset and every market condition.

    What the NEAR comparison shows is pretty simple: a 3% step outperformed both the tighter 2% and wider 4% variants on this particular run, but that number isn’t a rule to copy blindly onto your next trade. It’s a starting point for your own testing.

    CEO Note:

    “The traders who last aren’t the ones chasing the perfect setting. They’re the ones who test first and scale slowly once the data backs them up.”

    The smarter approach is treating step % as something you verify, not something you set once and forget.

    Run your own parameters through the DCA Backtest Bot, watch how tight versus wide spacing changes your fill count and average entry, and adjust from there.

    CG STRATEGY ANALYZER

    Confused about
    market outlook?

    Trading without a plan is just gambling. Our strategy architect analyzes your risk tolerance and capital to match you with a proven algorithmic framework.

    PASSIVE DCA Bot
    AGGRESSIVE Grid Pro
    BALANCED Rebalance

    FAQs

    What is DCA step percentage?

    It’s the price drop required before your bot places its next DCA order. A smaller number triggers faster, more frequent entries.


    It depends on the asset’s volatility. Tighter steps suit shallow, choppy dips, while wider steps work better for deep corrections.


    Backtest a few options like 2%, 3%, and 4% on the same asset and timeframe, then compare fill speed, average entry price, and P&L.

  • Crypto Whitepaper 🔍: How to Read Between the Lines, Expose Hype 🚨, and Avoid Scams 🛡️

    Crypto Whitepaper 🔍: How to Read Between the Lines, Expose Hype 🚨, and Avoid Scams 🛡️

    Everyone talks about a coin’s chart.

    Almost nobody talks about the crypto whitepaper behind it, and that’s exactly the problem. This document is the closest thing crypto has to a project’s DNA.

    It tells you what the team is actually building, how the token works, and why it should exist at all.

    Over 80% of new token launches in a recent multi-year sample never delivered a working product past the whitepaper stage

    CoinGecko Research.

    Most beginners skip straight to the price chart and skip the one paper that could’ve saved them from a rug.

    Ser, that’s backward.

    EXECUTIVE SUMMARY
    • The Problem: Most people invest based on hype and skip the document that actually explains what they’re buying into.
    • The Solution: Learning to read a crypto whitepaper properly turns guesswork into an actual evaluation process.
    • The Incentive: You catch red flags before your capital is on the line, not after.
    • The Risk: A polished whitepaper can still hide weak tokenomics or an unrealistic roadmap, so reading it isn’t a guarantee.

    What Is a Crypto Whitepaper, Really

    A crypto whitepaper is the project’s technical and economic blueprint.

    It’s not a pitch deck, and it’s definitely not marketing copy dressed up in charts.

    CEO Note:

    Zaheer says the whitepaper is where you separate builders from marketers. If the paper reads like an ad, treat it like one.

    A real one explains the problem being solved, how the technology works, and how the token fits into that system.

    Honestly, if a project can’t explain itself clearly in this document, that’s already a signal.

    1. Why Projects Publish Whitepapers

    Publishing a whitepaper signals the team is willing to put their reasoning on paper, in public, where it can be checked.

    It gives builders room to explain the actual problem instead of just promising returns.

    The Bitcoin whitepaper is still the reference point for what a clear, technical, no-hype document looks like.

    2. Whitepaper vs Litepaper vs Pitch Deck

    These three get mixed up constantly.

    A whitepaper is the full technical and economic explanation, built for developers and serious researchers.

    A litepaper is the same idea, simplified for a broader audience.

    A pitch deck is built for investors and, ngl, it’s usually the most biased of the three since its whole job is to sell the round.

    The Core Sections Every Whitepaper Should Have

    Strong whitepapers tend to follow a pattern.

    Once you know that pattern, you can scan any new one in minutes and know where the substance actually lives instead of getting lost in the branding.

    Swipe to view full data →
    Section What It Should Tell You Watch For
    Problem & Vision The real issue being solved Vague, generic claims
    Tech & Architecture How the system actually works No technical detail
    Tokenomics Supply, allocation, vesting Huge team allocation

    1. Problem Statement and Vision

    This part reveals whether the project is solving something real or just inventing a problem to justify a token.

    A serious paper names the problem specifically.

    A weak one talks in circles about “revolutionizing” an industry without saying how.

    2. Technology and Architecture

    Here’s where vague claims usually fall apart.

    If a paper can’t explain its consensus mechanism, its data structure, or its actual technical tradeoffs, that’s not a simplification for beginners.

    That’s usually a sign there isn’t much technology behind the buzzwords.

    Reality Check

    Common belief: Automated or “smart” systems are assumed to protect capital the same way a well-vetted whitepaper is assumed to protect an investment.
    What CryptoGates research found: Testing a grid bot through a 27% ETH collapse, the bot still lost money — just 8.36% instead of the 26.94% a spot holder lost over the same window.

    Why it matters: Verification isn’t about proving something wins. It’s about seeing the real number, even when that number is negative — the same standard a reader should apply to a project’s tokenomics section.

    Strategy: Grid Bot
    Coin: ETH/USDT
    Market Condition: 44-day, 27% collapse
    Objective: Measure loss containment during a real breakdown
    Key Result: Grid bot lost 8.36% vs. 26.94% for a spot holder, generating $62.74 in live grid profit along the way
    Expert Interpretation: A losing result, reported in full, tells a due-diligence-minded reader more than a cherry-picked win would.

    ETH Grid Bot Cut a 27% Crash Loss to Just 8.36%

    3. Tokenomics and Distribution

    Token supply, allocation, and vesting schedules show you who actually benefits early.

    Wait, this is the part most people skip entirely, and it’s often the most revealing section in the whole document.

    How to actually read one – Is a crypto whitepaper legally binding?

    No. A whitepaper is a descriptive document, not a legal contract. It outlines intentions and plans, but it usually doesn’t create enforceable obligations the way a prospectus or a legal agreement would. Treat it as a research tool, not a guarantee.

    A huge allocation sitting with the team and early investors, unlocking fast, tells you exactly who the exit liquidity might be.

    How to Actually Read One Without Getting Fooled

    Reading a whitepaper is a skill, not a formality.

    Most beginners open the PDF, skim the intro, and close it.

    That’s not reading; that’s checking a box.

    Here’s the interesting part: the paper is designed to be read backward from how most people approach it.

    Skip the marketing language up top and go straight to tokenomics and technical architecture first. That’s where the truth usually lives.

    1. Red Flags That Signal Hype Over Substance

    Vague language is the first tell. Phrases like “revolutionary ecosystem” or “next-generation infrastructure” without any specifics underneath them are filler, not substance.

    An anonymous team with no verifiable background is another one.

    TIP:

    “Skepticism is a project’s best friend.” Vitalik Buterin

    Look, teams sometimes have legitimate reasons to stay private, but combined with unrealistic return promises or a roadmap packed with buzzwords and no milestones, it starts looking less like caution and more like a pattern.

    REF: VOL-NEUTRAL-2026

    Neutralize Volatility.
    Own the Growth.

    Access systematic playbooks designed to eliminate emotional bias. From Spot HODL frameworks to advanced Grid simulators.

    ◒
    Spot & HODL
    ◈
    DCA Engine
    ▦
    Grid Tactics
    ☯
    Rebalance

    Unrealistic promises deserve extra suspicion too.

    If a paper implies guaranteed returns or positions the token as a sure thing, that’s not confidence; it’s one of the classic crypto scam red flags to watch for.

    That’s a sales pitch wearing a whitepaper’s clothes.

    2. A Simple Verification Checklist Before You Trust It

    Interactive Checklist

    • Confirm the team’s identity and past project history
    • Check if the technology claims match what’s actually live or on GitHub
    • Read the tokenomics section for team and investor allocation size
    • Compare the roadmap against actual delivered milestones
    • Search for independent audits or third-party technical reviews

    A few consistent checks like these separate a serious project from a copy-paste scam dressed up with a fresh logo.

    None of this takes long once it becomes a habit.

    Research Insight

    Skepticism about a whitepaper’s claims really comes down to a data problem: does the stated tech match what’s actually shipped?

    The same test applies to any performance claim in crypto, including strategy backtests. A title promising outperformance means little until the mechanics behind it – trade counts, drawdowns, the market condition it was tested in — are visible too.

    Strategy: Grid Bot
    Coin: BNB/USDT
    Market Condition: Post-ATH crash (-33%)
    Objective: Test grid resilience against a steep breakdown
    Key Result: Bot generated $163.94 in grid profit but still finished at -21.64% total ROI
    Expert Interpretation: Grid profit and total ROI are not interchangeable – publishing the loss alongside the trade data is what separates verifiable research from a marketing claim.

    BNB Grid Bot vs a 33% Crash: What the Backtest Data Actually Shows

    How long does it take to read a crypto whitepaper properly?

    Most whitepapers take 20 to 40 minutes to read properly, depending on length and technical depth. Skimming for tokenomics and team background alone takes far less time and still catches most red flags.

    Honestly, it’s less about being an expert and more about not skipping steps just because the branding looks clean.

    Verify the Paper Before You Verify the Price

    A crypto whitepaper won’t tell you where the price is headed, and honestly, it was never supposed to.

    What it does is give you a real look at the logic behind the project, the tokenomics, and whether the team actually knows what they’re building.

    Treat it as step one of due diligence, cross-checked against CryptoGates’ Crypto Reality Check, not the final word.

    Price action comes later.

    Verification comes first.

    SYSTEM ACCESS: CG4.2

    Stop Guessing.
    Stress Test Your Edge.

    The market doesn’t care about your backtest. Our engine simulates 1,000+ “what-if” scenarios to ensure your strategy is built for survival.

    Run Crypto Strategy Engine →
    ROBUSTNESS SCORE
    75+ STRUCTURAL EDGE
    RISK OF RUIN < 1%
    TARGET HIT 92%

    FAQs

    Do all cryptocurrencies have a whitepaper?

    Most legitimate projects publish one, but not all. A missing whitepaper on a project claiming serious technology is itself a red flag worth noting.


    Yes. Strong writing and clean design don’t guarantee execution, market timing, or that the tokenomics play out the way they’re described.


    Check the project’s official website first, then cross-reference with reputable listing sites to confirm you’re reading the real, unedited version.


  • 2FA for Crypto 🔐: Your Account Is One Text Message Away From Empty 🛡️🚨

    2FA for Crypto 🔐: Your Account Is One Text Message Away From Empty 🛡️🚨

    Ser, one text message.

    That’s sometimes all it takes for someone to walk into your exchange account and walk out with everything.

    Sounds dramatic?

    It’s not. SIM swaps happen. Phishing links get clicked. Passwords leak in breaches you never even hear about. And once your crypto moves, ngl, it’s gone. No bank to call. No chargeback.

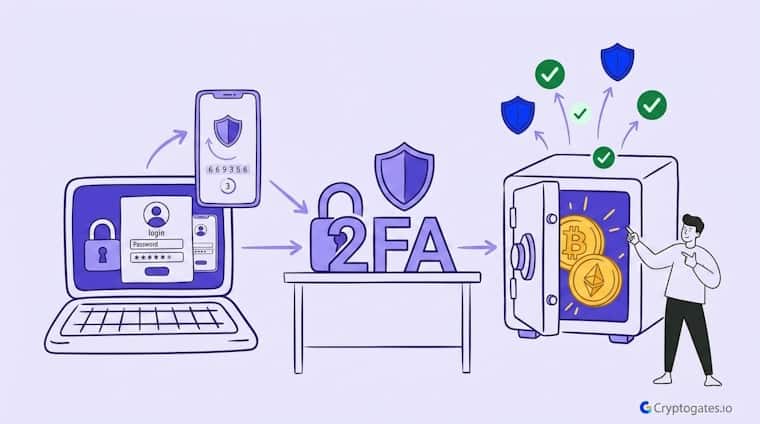
    That’s why 2fa for crypto isn’t a nice-to-have anymore. It’s the one habit standing between “my funds are safe” and “wait, where did my portfolio go.”

    EXECUTIVE SUMMARY
    • The Problem: Passwords alone can’t protect crypto accounts anymore, and weak login security is behind most account takeovers.
    • The Solution: 2FA for crypto adds a second verification layer, using an app, a key, or a code, so a stolen password isn’t enough to break in.
    • The Incentive: Setup takes minutes and closes off the most common way traders lose access to their funds.
    • The Risk: Not all 2FA methods offer equal protection, and setup mistakes like skipping backup codes can still leave you locked out or exposed.

    What Is 2FA and Why Crypto Accounts Need It

    Your password got leaked.

    Again.

    Maybe not yours specifically, but somewhere in a database sitting on the dark web right now, there’s a good chance a password you’ve used before is sitting there too.

    That’s why 2fa for crypto isn’t optional anymore. It’s the second lock on a door that thieves already know how to pick.

    Here’s the thing.

    A password alone proves you know something. 2FA proves you also have something, like your phone, an app, or a physical key.

    Attackers can steal a password from a data breach in seconds. Stealing a physical device or a live authentication code?

    Way harder.

    Roughly 2.2 billion dollars in crypto was lost to hacks and exploits in a recent year, and a large share traced back to compromised account access rather than smart contract bugs.

    (Source: Chainalysis, placeholder pending verification)

    Look, this matters more for crypto than almost anything else you do online. Your Netflix account getting hacked is annoying.

    Your exchange account getting hacked can mean your funds are gone in minutes, no chargeback, no bank to call, no undo button.

    1. How 2FA Actually Works

    Put simply, two-factor authentication asks for two things before letting you in. Something you know, like your password.

    And something you have, like a code from an app or a tap on a hardware key.

    HISTORICAL DATA AUDIT

    Battle-Test Your Strategy
    Before the Market Does.

    Eliminate guesswork with institutional-grade backtesting for DCA, Grid, and Rebalance bots. Real historical data. Real-world results.

    EST. OPTIMIZATION +42% ROI Efficiency
    Start Backtest Now

    Sourced from 5+ Years of Exchange Data

    When you log in, the platform checks your password first.

    Then it asks for that second factor. If someone stole your password but doesn’t have your phone or your key, they’re stuck at the door.

    It sounds simple because it is. That’s kind of the point.

    2. Why Crypto Accounts Are Bigger Targets Than Regular Accounts

    Think about it this way. If someone breaks into your email, you can usually reset things, lock accounts, and recover most of what matters. Crypto doesn’t work like that.

    Transactions on the blockchain are final.

    Ser, there’s no undo.

    No fraud department reversing a transfer at 2am. Once funds move, they’re gone, and chasing them across wallets and exchanges is close to impossible for most victims.

    Expert Observation

    Automation only pays off if the account running it is actually secure – and that’s easy to forget once a bot is quietly executing trades in the background. Reviewing CryptoGates’ own Grid Bot data makes the point clearly: these systems run unattended for weeks, placing dozens or hundreds of trades without a human checking in.

    That’s the entire value proposition – and also exactly why account-level protection matters more here than on a typical login you check once a day.

    Strategy: Grid Bot
    Coin: XRP/USDT
    Market Condition: Flat, range-bound (90 days, near-zero net price movement)
    Objective: Extract profit from sideways price action without manual intervention
    Key Result: 875 trades executed autonomously, generating a 27.74% return while buy-and-hold returned just 0.24%
    Expert Interpretation: The bot’s edge came entirely from unattended, continuous execution — the same characteristic that makes account security non-negotiable before switching automation on. A compromised login doesn’t just risk funds sitting idle; it risks funds actively being moved by a system running 24/7.

    XRP Went Nowhere for 3 Months — Our Grid Bot Made +27.74% Anyway:

    https://cryptogates.io/playbooks/xrp-grid-bot-returned-27-74-in-90-days-while-buy-hold-made-0-24/

    That’s exactly why crypto accounts, already the fastest-growing target for individual wallet compromises, sit higher on every hacker’s target list than a random shopping account ever will.

    Whales get targeted because the payoff is bigger. Shrimp get targeted because there are a lot more of them, and plenty still skip 2FA entirely, hoping they won’t be the unlucky one.

    CryptoGates doesn’t provide custody or wallet security tools directly, but before automating anything through Backtest Bots or connecting exchange accounts, having your login security locked down is step zero.

    Types of 2FA You Can Use for Crypto

    Not all 2FA is created equal. Ngl, this trips up a lot of traders who think they’re protected just because they turned something on.

    There’s a real gap between the weakest option and the strongest one, and that gap matters a lot when your funds are on the line.

    1. SMS-Based 2FA

    SMS codes are the most common starting point. You get a text, you type in the code, you’re in. Easy.

    But there’s a problem. SIM swap attacks. An attacker convinces your phone carrier to move your number to their device, and suddenly your “secure” text codes are landing in their hands, not yours.

    It’s still better than no 2FA at all. Realistically, though, if you’re holding any meaningful amount, SMS shouldn’t be your only line of defense.

    2. Authenticator Apps (TOTP)

    Authenticator apps generate a fresh code every 30 seconds or so, right on your device. No carrier involved. No SIM to swap.

    This is where most experienced traders land. It’s a solid middle ground between convenience and actual protection, and it works offline once it’s set up.

    The code lives on your phone, not floating through a text message that can be intercepted. That alone closes off a big attack path.

    3. Hardware Security Keys

    Now imagine this. A small physical device, something like a YubiKey, that you plug in or tap to confirm a login. No code to type. No app to open.

    This is about as close to bulletproof as consumer 2FA gets right now. An attacker would need your actual physical key in their hand, which, honestly, changes the entire threat model.

    Is SMS 2FA safe enough for crypto?

    It’s better than nothing, but SIM swap attacks make it the weakest option. For any real holdings, an authenticator app or hardware key offers stronger protection.

    OGs and larger holders tend to gravitate here. It’s a bit more setup, sure.

    But for anyone treating crypto as a long-term position rather than a quick trade, it’s worth the extra five minutes.

    Swipe to view full data →
    2FA Method Security Level Best For
    SMS-Based Weakest, vulnerable to SIM swaps Better than nothing, not ideal for real holdings
    Authenticator App Strong, offline protection Most traders, solid daily use
    Hardware Key Highest, requires physical device Long-term holders, larger balances

    Setting Up 2FA on Exchanges and Wallets

    Okay, so you know which method you want.

    Now what?

    Setting it up is usually faster than people expect, once you know where to look.

    1. Enabling 2FA on Major Exchanges

    Most exchanges follow a similar pattern. You’ll find 2FA settings under security or account settings, usually with a clear “enable” button sitting right there.

    From there, you scan a QR code with your authenticator app, or register your hardware key, and confirm with a test code. Takes maybe two minutes.

    2FA Setup Checklist

    • Enable 2FA on login, not just account access
    • Enable 2FA on withdrawals separately, check this setting exists
    • Save backup codes somewhere physical, not a screenshot
    • Avoid linking the same phone number across exchange, email, and recovery
    • Test your 2FA method once before relying on it fully

    Here’s what most beginners miss.

    Some platforms let you enable 2FA for login only, while withdrawals stay unprotected unless you turn on a separate setting.

    Check both. Seriously, check both, because that gap is exactly where a lot of losses happen even after someone thinks they’re covered.

    2. Backup Codes and Recovery Planning

    Every authenticator setup gives you backup codes. A list of one-time codes meant for exactly one situation, you lose access to your phone or your authenticator app.

    Write them down.

    Not a screenshot buried in your camera roll. Somewhere physical, somewhere separate from your phone.

    Here’s the issue.

    People treat backup codes as optional busywork during setup, click past them, and then panic six months later when they get a new phone and can’t log in anywhere. It happens more than you’d think.

    Common 2FA Mistakes That Still Get Traders Hacked

    2FA isn’t a magic shield.

    Honestly, it’s one layer, and layers only work if every part of them holds up.

    1. Reusing Phone Numbers Across Accounts

    Here’s the interesting part.

    A lot of traders link the same phone number to their exchange, their email, and their authenticator recovery, not realizing that one SIM swap now threatens all three at once.

    That’s a single point of failure dressed up as convenience. One breach, three accounts exposed, sometimes more.

    SYSTEM ACCESS: CG4.2

    Stop Guessing.
    Stress Test Your Edge.

    The market doesn’t care about your backtest. Our engine simulates 1,000+ “what-if” scenarios to ensure your strategy is built for survival.

    Run Crypto Strategy Engine →
    ROBUSTNESS SCORE
    75+ STRUCTURAL EDGE
    RISK OF RUIN < 1%
    TARGET HIT 92%

    Rotation matters here too, in a different sense.

    Spreading recovery methods across different channels, email, hardware key, backup codes, means one compromised piece doesn’t take down everything else with it.

    2. Ignoring Backup Codes

    We’ve all been there, rushing through setup screens, clicking past the part that says “save your backup codes.”

    It’s the kind of mistake that feels harmless until it isn’t.

    What happens if I lose access to my 2FA app?

    If you saved backup codes, you can use one to regain access. Without them, you’ll need to go through the exchange’s account recovery process, which can take time.

    No backup plan means that if your phone breaks, gets stolen, or just gets replaced, you could be locked out of an account holding real money.

    Support tickets for exchange account recovery can take days, sometimes weeks, especially during high-volume periods when everyone else is having the same problem.

    Lock Down Your Crypto the Right Way

    Look, 2fa for crypto isn’t complicated, and it isn’t optional. It’s a five-minute setup that closes off the most common way traders lose access to their funds in the first place.

    Pick an authenticator app at a minimum.

    Add a hardware key if you’re holding anything long-term. Save your backup codes somewhere real. That’s it. That’s the whole system.

    CG STRATEGY ANALYZER

    Confused about
    market outlook?

    Trading without a plan is just gambling. Our strategy architect analyzes your risk tolerance and capital to match you with a proven algorithmic framework.

    PASSIVE DCA Bot
    AGGRESSIVE Grid Pro
    BALANCED Rebalance

    Verify first. Risk later. Scale slowly applies here too, not just to strategy.

    Before you connect an exchange account to test a setup in the Strategy Engine, make sure the account itself is locked down properly.

    Security is step zero; testing comes after.

    FAQs

    What is the safest type of 2FA for crypto accounts?

    Hardware security keys offer the strongest protection since they require a physical device. Authenticator apps are a solid second choice for most traders.


    Yes, if you reuse phone numbers across accounts or skip saving backup codes. 2FA reduces risk significantly but doesn’t remove it entirely.


    Use your saved backup codes to regain access immediately. Without them, you’ll need to go through the exchange’s recovery process, which can take time.


  • What Is a Rug Pull in Crypto? 🔍 Learn How Scams Work ⚠️ and Protect Your Funds 🛡️

    What Is a Rug Pull in Crypto? 🔍 Learn How Scams Work ⚠️ and Protect Your Funds 🛡️

    You see a token climbing 40% in an hour.

    Everyone in the Telegram group is posting rocket emojis.

    The chart looks unstoppable. Then, sometime between your third coffee and your fourth refresh of the page, the price goes to zero.

    Not a dip. Zero.

    Here’s the thing. This isn’t bad luck. It’s a rug pull, and it’s one of the oldest tricks in crypto’s short history.

    Rug pulls accounted for roughly $2.8 billion in losses during 2025 alone, making up close to 35% of all crypto scam losses that year

    (source: blockchain security research)

    If you’re trading anything outside the top few coins, understanding what a rug pull is isn’t optional anymore.

    It’s survival.

    EXECUTIVE SUMMARY
    • The Problem: New tokens launch by the thousands every day, and a real chunk of them are built to disappear with your money.
    • The Solution: Learn the mechanics behind rug pulls so you can spot the setup before you’re the exit liquidity.
    • The Incentive: A few minutes of verification can save you from a total loss on any single trade.
    • The Risk: Even careful traders get caught when hype moves faster than due diligence.

    What Is a Rug Pull in Crypto?

    A rug pull is exactly what it sounds like.

    The floor gets pulled out from under you.

    In practical terms, it’s a scam exit where the people behind a token drain the liquidity, dump their holdings, or just vanish, leaving everyone else holding a bag worth nothing.

    CEO Note:

    SEO is completely counterintuitive at the bottom line!

    Look, this isn’t some rare, once-in-a-blue-moon event either.

    Soft rug pulls, the slower kind where a team just quietly stops showing up, have actually increased faster than hard rugs recently.

    It’s not always a dramatic crash. Sometimes it’s a slow bleed dressed up as “we’re still building.”

    How a Rug Pull Actually Works

    Most rug pulls follow a pattern once you know what to look for.

    A team creates a token, pairs it with a real asset like ETH or BNB in a liquidity pool, and lets buyers pile in.

    That liquidity pool is what lets people actually sell the token back for something with value.

    Is a rug pull the same as a regular crypto crash?

    Not really. A regular crash comes from market-wide selling or bad news, but a rug pull is deliberate. Someone with control over the liquidity or supply chooses to drain it, on purpose, usually right when buying interest peaks.

    Here’s what most beginners miss.

    If the developers control that pool, they can pull the paired assets out whenever they want.

    The moment they do, the token’s price collapses to basically nothing, and there’s no one left on the other side of the trade. Some setups go a step further with code that blocks regular holders from selling at all, while insiders quietly cash out in the background.

    Either way, the mechanism is the same. Someone controls the exit, and you don’t.

    Reality Check

    Traders often assume that if a bot is actively firing profitable trades, the strategy itself must be working. CryptoGates backtest data complicates that assumption.

    Strategy: Grid Bot
    Coin: BNB/USDT
    Market Condition: 33% post-ATH crash over 79 days
    Objective: Test whether high trade frequency and positive grid profit translate into a net win
    Key Result: The bot fired 171 trades and generated $163.94 in grid profit — yet total ROI still landed at −21.64%
    Expert Interpretation: Grid profit and actual portfolio performance are not the same number. A strategy can look “active” and “profitable” on the surface while still losing money overall – which is exactly why checking the underlying data matters more than trusting the activity itself.

    BNB Crashed 33% After Its ATH — Our Grid Bot Lost Less, But Still Lost

    Common Types of Rug Pulls

    Not every rug pull looks the same, and honestly, that’s part of what makes them tricky to spot.

    Some hit fast.

    Some drag out over weeks while you’re still convinced the project is “just consolidating.” Knowing the difference helps you read the warning signs earlier.

    1. Liquidity Pulls

    This is the classic version, the one you’ve probably heard about even if you’re new to crypto.

    The developers hold the keys to the liquidity pool, wait until enough buyers have swapped in, then withdraw everything paired against the token. BTC, ETH, stablecoins, whatever backed it- gone in one transaction.

    The token itself still sits in your wallet. It’s just worth nothing because there’s no liquidity left to sell into.

    HISTORICAL DATA AUDIT

    Battle-Test Your Strategy
    Before the Market Does.

    Eliminate guesswork with institutional-grade backtesting for DCA, Grid, and Rebalance bots. Real historical data. Real-world results.

    EST. OPTIMIZATION +42% ROI Efficiency
    Start Backtest Now

    Sourced from 5+ Years of Exchange Data

    2. Limited Sell Order Scams

    This one’s sneakier, ngl. The smart contract itself gets coded so regular holders can buy but can’t sell, or can only sell a tiny percentage at a time.

    Meanwhile, wallets tied to the team face no such restriction.

    Price pumps as buyers pile in with no way out, and insiders quietly sell into that demand. It’s basically a trap disguised as a token.

    3. Slow Rugs

    Slow rugs don’t announce themselves.

    There’s no dramatic liquidity drain, no single moment you can point to.

    Instead, the team just starts dumping their token allocation bit by bit, over days or weeks, while community updates get vaguer and vaguer.

    By the time most holders notice the price has been bleeding for a month, most of the damage is already done.

    Red Flags That Signal a Rug Pull Before It Happens

    Here’s the good news.

    Rug pulls almost always leave fingerprints.

    The problem is that most people are too busy watching the chart to check for them.

    Roughly 88% of confirmed rug pulls either had zero liquidity lock or a lock lasting under 30 days, while legitimate projects typically lock for a year or more.

    on-chain Security Research

    That one stat alone should change how you approach a new token.

    If liquidity isn’t locked, or barely locked, that’s not a small detail.

    That’s the whole ballgame.

    1. Anonymous or Unverified Teams

    An anonymous team isn’t automatically a scam.

    Plenty of legitimate builders started that way.

    But anonymity does mean zero accountability if things go wrong, and that changes the risk math.

    If you can’t find real names tied to GitHub commits, LinkedIn history, or past projects, you’re trusting strangers with your capital on faith alone.

    Fair enough if you’re comfortable with that. Most people aren’t, once they think it through.

    Research Insight

    Many traders assume a bull run automatically means any active strategy will outperform simply holding. CryptoGates backtesting on a comparable setup shows that assumption doesn’t hold consistently.

    Strategy: DCA Bot
    Coin: BTC/USDT
    Market Condition: BTC surged nearly 15% over the test window
    Objective: Measure whether an automated bot captures more upside than passive buy-and-hold during a clear uptrend
    Key Result: The DCA bot closed 8 of 9 sessions in profit, but buy-and-hold still beat it by $119.81
    Expert Interpretation: Even a “working” strategy with a high win rate can underperform a simpler approach depending on market conditions. The only way to know which setup fits a given moment is to run the numbers first – not assume the outcome.

    BTC Ran +14.5%, and Our DCA Bot Only Made $40 — Here’s the Honest Truth

    2. Unlocked or Concentrated Liquidity

    This is the check that catches the most scams, full stop.

    Search the token’s liquidity pool on a lock verification platform like Team Finance or Unicrypt and see for yourself.

    Don’t trust a screenshot posted in a Telegram group. Check the lock duration, the percentage locked, and who actually controls it.

    Can a project with locked liquidity still be a rug pull?

    Yes. Locked liquidity lowers one specific risk, but developers can still mint extra tokens through code exploits or dump their own allocation slowly. A lock helps. It doesn’t guarantee safety on its own.

    A team that’s locked 10% of liquidity while keeping 90% free to move isn’t really locked at all. Also worth a look: how many wallets hold the majority of the supply.

    A handful of wallets holding most of the tokens means a handful of people can crash the price whenever they choose.

    How to Protect Yourself From Rug Pulls

    You don’t need to be a smart contract developer to avoid most rug pulls.

    You need the same crypto security habit of checking before you buy instead of after you’ve already lost money.

    1. Research Before You Buy

    Give yourself thirty minutes, not thirty seconds.

    Please check whether the contract includes an audit from a known firm, not just a fake audit badge with no report attached.

    Look at the liquidity lock, the wallet distribution, and whether the team has any traceable history outside this one project.

    If a project promises guaranteed returns or “can’t lose” setups, that’s your answer right there.

    No legitimate project needs to promise that.

    SYSTEM ACCESS: CG4.2

    Stop Guessing.
    Stress Test Your Edge.

    The market doesn’t care about your backtest. Our engine simulates 1,000+ “what-if” scenarios to ensure your strategy is built for survival.

    Run Crypto Strategy Engine →
    ROBUSTNESS SCORE
    75+ STRUCTURAL EDGE
    RISK OF RUIN < 1%
    TARGET HIT 92%

    Believe it or not, most of this information is public and free to check.

    The tools exist. Most people just skip them because FOMO moves faster than research.

    2. Why Verification Beats Hype

    Here’s the truth CT doesn’t always want to hear.

    Hype feels good in the moment.

    It also has zero predictive power over whether a token survives the week. The traders who avoid getting rekt aren’t the ones with the best instincts.

    They’re the ones who slow down and verify before they commit capital, every single time, even when the chart looks tempting.

    CG STRATEGY ANALYZER

    Confused about
    market outlook?

    Trading without a plan is just gambling. Our strategy architect analyzes your risk tolerance and capital to match you with a proven algorithmic framework.

    PASSIVE DCA Bot
    AGGRESSIVE Grid Pro
    BALANCED Rebalance

    This same discipline applies beyond spotting scams, too.

    It’s the same logic behind backtesting any strategy on real historical data before risking money live.

    Verify First, Buy Later

    Rug pulls don’t succeed because the victims were careless people.

    They succeed because hype moves faster than verification, and impatience beats process almost every time.

    The good news is the checks that catch most rug pulls take minutes, not hours. Liquidity lock status, team transparency, holder concentration.

    Check those three things consistently, and you’ll avoid the vast majority of these scams before they ever touch your wallet.

    If you’re building a habit of testing before trusting, that same mindset applies to strategy, not just token selection.

    Run your own parameters and see what the data shows before you scale anything with real capital.

    FAQs

    Can you get your money back after a rug pull?

    In most cases, no. Blockchain transactions can’t be reversed, though some victims have traced funds through on-chain analysis and reported to law enforcement with mixed results.


    Often yes, in jurisdictions where they involve fraud or misrepresentation. Prosecution is difficult though, since many teams stay anonymous and operate across borders.


    More common than most beginners realize. They remain one of the top categories of crypto scams, with billions lost across chains in recent years, concentrated heavily in low-cap and memecoin launches.


  • What Is OHLCV Data 📊? Why CryptoGates Uses 1-Minute Candles ⏱️ for More Reliable Backtests 🎯

    What Is OHLCV Data 📊? Why CryptoGates Uses 1-Minute Candles ⏱️ for More Reliable Backtests 🎯

    You hit “run backtest,” watch the numbers load, and trust whatever comes out.

    Ser, have you ever actually asked what’s feeding that result?

    Retail traders who rely on backtests using low-resolution daily data see live performance deviate by wide margins compared to what the backtest predicted, according to quant research from academic trading studies

    (Source: Journal of Financial Data Science)

    Every strategy score, every Robustness number, every Risk of Ruin percentage traces back to one thing: OHLCV data.

    Get the resolution wrong, and your entire backtest is just an expensive guess wearing a lab coat.

    Most beginners skip this part completely.

    That’s exactly why so many “profitable” backtests fall apart the moment real capital touches them.

    EXECUTIVE SUMMARY
    • The Problem: Most traders don’t know what data actually powers their backtest results, so they trust numbers built on shaky ground.
    • The Solution: OHLCV data, especially at 1-minute resolution, gives you the full picture of price action instead of a rounded summary.
    • The Incentive: Understanding this helps you read Strategy Engine results with real confidence instead of blind faith.
    • The Risk: Trusting a backtest built on low-resolution candles can hide slippage, fake breakouts, and wicks that would’ve wrecked a live account.

    What Is OHLCV Data, Really?

    OHLCV isn’t some complicated quant term.

    It’s just five numbers stacked on top of each other. Open. High. Low. Close. Volume.

    Every single candlestick you see on a chart, no matter the timeframe, is built from these five data points.

    Once you get this, charts stop looking like random shapes and start looking like a story.

    Swipe to view full data →
    Letter What It Means Why It Matters
    O Opening price of the candle Shows where the period started
    H Highest price reached Reveals buyer strength
    L Lowest price reached Reveals seller pressure
    C Closing price of the candle Shows who won the period
    V Volume traded Confirms if the move is real

    1. Open, High, Low, Close Explained

    Think of it like this.

    The open is where a fight starts. The high and low are how far each side pushed before the bell.

    The close is who’s standing at the end. imo this is the part most beginners actually understand fine. It’s the fifth letter that trips people up.

    2. Volume – The Ignored Fifth Metric

    Here’s the thing.

    Price without volume is just a rumor. A big green candle on low volume?

    Could be nothing.

    Could be a trap.

    But a big green candle backed by heavy volume- that’s smart money showing up. Volume is what separates a real breakout from a fakeout that’s about to reverse and rug the late buyers.

    Research Insight

    Many traders treat a big price move as proof enough that something real is happening. But price alone can’t confirm intent; volume can.

    A 2025 DOGE stress test shows why that distinction matters at the data layer, not just the chart layer.

    Strategy: DCA Bot
    Coin: DOGE/USDT
    Market Condition: 34.4% price collapse over 60 days, driven by concentrated whale-sized activity
    Objective: Observe how a bot performs when a crash is backed by real volume rather than thin, low-liquidity noise
    Key Result: 13 of 14 sessions closed in profit, including a single 10-order session that deployed $10,491 and still returned $298.54 mid-collapse
    Expert Interpretation: Volume-confirmed moves behave differently than volume-thin noise, even when the percentage drop looks identical on a chart. A backtest built on coarse candles can’t tell the two apart, which is exactly why the volume column exists as a fifth data point and not an optional extra.

    View Complete Playbook: DOGE Crashed 34% in 60 Days, Our DCA Bot Made +$924.23 Anyway

    Why Candle Timeframes Change Everything

    A 1-day candle and a 1-minute candle are technically the same five data points.

    But they tell wildly different stories. Zoom out too far, and you lose the fight entirely. You only see who won, not how brutal the battle actually was.

    HISTORICAL DATA AUDIT

    Battle-Test Your Strategy
    Before the Market Does.

    Eliminate guesswork with institutional-grade backtesting for DCA, Grid, and Rebalance bots. Real historical data. Real-world results.

    EST. OPTIMIZATION +42% ROI Efficiency
    Start Backtest Now

    Sourced from 5+ Years of Exchange Data

    Here’s the interesting part.

    Two assets can have the same daily candle, same open, same close, same everything on paper. But one of them drifted there calmly.

    The other one spiked 8% up, got rejected hard, dumped 6%, then crawled back.

    Same close. Completely different risk.

    What Gets Lost in Bigger Candles

    Daily candles hide intraday traps.

    That sharp wick that would’ve stopped out a real position?

    Gone, smoothed into a single line. That fake breakout that baited retail before reversing?

    Invisible on a daily chart.

    This is where things change for anyone actually trying to test a strategy seriously using a proper Crypto Backtesting Guide, not just eyeball a chart.

    Real Backtest Example

    Most backtests report a single drawdown figure and move on, but that number only makes sense once you know what resolution captured it.

    A 15-day BTC stress window from 2025 illustrates this well.

    Strategy: DCA Bot
    Coin: BTC/USDT
    Market Condition: Sharp 15-day decline, BTC shedding over $10,000
    Objective: Test bot resilience through a fast, non-gradual capitulation
    Key Result: 10 of 11 sessions closed at take-profit, yet the session logged a 95.87% intraday max drawdown reading
    Expert Interpretation: That drawdown number only becomes readable once you know it was measured against the deepest intraday wick, not a rounded daily close. On lower-resolution data, that same crash would have shown up as a smooth, forgiving line, and the strategy would look far safer on paper than it actually behaved in real time.

    View Complete Playbook: We Ran a DCA Bot Through BTC’s Worst Fortnight of 2025

    What is OHLCV data used for in crypto trading?

    OHLCV data is used to build price charts and power backtesting engines. It shows open, high, low, close, and volume for any set time period, giving traders the raw material behind every strategy test.

    But there’s a problem.

    If your backtest never sees these traps, it never learns to survive them either. The strategy looks clean on paper because the data was clean too. Too clean, honestly.

    Why CryptoGates Runs Backtests on 1-Minute OHLCV Candles

    Most platforms backtest on daily or even hourly candles because it’s cheaper and faster. CryptoGates doesn’t cut that corner.

    Every backtest bot, whether you’re testing DCA, Grid, or Rebalance, runs on real 1-minute OHLCV data across major exchanges and coins.

    CEO Note:

    Zaheer put it simply once. “You can’t verify a strategy on data that hides the exact moments it would’ve failed. Test on what the market actually did, minute by minute, or don’t test at all.”

    Ser, that’s not a marketing line.

    That’s the actual difference between a strategy that survives and one that just looked good on a chart.

    How This Affects Your Strategy Engine Results

    Here’s why this actually matters for you.

    The Strategy Engine’s Robustness Score and Risk of Ruin numbers are only as honest as the candles feeding them.

    SYSTEM ACCESS: CG4.2

    Stop Guessing.
    Stress Test Your Edge.

    The market doesn’t care about your backtest. Our engine simulates 1,000+ “what-if” scenarios to ensure your strategy is built for survival.

    Run Crypto Strategy Engine →
    ROBUSTNESS SCORE
    75+ STRUCTURAL EDGE
    RISK OF RUIN < 1%
    TARGET HIT 92%

    Run 10,000 trade permutations on rounded, low-resolution data, and you get a confident-looking score built on a shaky foundation.

    Run it on granular 1-minute data and the Monte Carlo Cloud actually reflects what could happen in a real market, not a smoothed-out fantasy version of one.

    What This Means for Your Strategy

    Cheap data creates expensive confidence.

    That’s the whole problem in one line.

    A strategy can backtest beautifully on daily candles and still get rekt live, simply because the backtest never saw the conditions that would’ve broken it.

    Garbage In, Garbage Out

    A backtest is only as trustworthy as what’s feeding it.

    Feed it low-resolution, rounded, incomplete data, and you’ll get a result that flatters your strategy instead of stress-testing it.

    Strategies backtested on granular intraday data typically show meaningfully wider drawdown ranges than the same strategy tested on daily candles alone, per quantitative backtesting research

    (Source: CFA Institute Research Foundation)

    Feed it real 1-minute OHLCV data, and you get something closer to the truth, even when that truth is uncomfortable.

    Why does candle timeframe matter for backtesting accuracy?

    Smaller timeframes capture intraday price swings, wicks, and volume spikes that larger candles smooth over. This means a strategy tested on 1-minute data gets exposed to real market chaos instead of a simplified version of it.

    Data Quality Is the Real Edge

    At the end of the day, OHLCV data is the foundation of any sound crypto backtesting methodology, the layer every backtest sits on.

    Get the resolution wrong, and you’re not testing a strategy; you’re testing a fantasy version of the market that never actually existed.

    CONFIDENTIAL // RESEARCH
    STRATEGY INTELLIGENCE

    Proven Setups &
    Expert Breakdowns.

    We don’t just show you the data; we engineer and validate high-performance strategies, providing the “Alpha” behind the numbers.

    CryptoGates runs on 1-minute candles because that’s what separates a real stress test from a comforting story.

    Before you trust any backtest result, including your own, ask what data built it.

    Then run your own parameters through the Crypto Strategy Engine and see what the data shows on real granular candles, not rounded guesses.

    FAQs

    What does OHLCV stand for?

    OHLCV stands for Open, High, Low, Close, and Volume. These five data points make up every candle on a price chart, no matter the timeframe.


    1-minute data captures wicks, slippage, and fake breakouts that daily candles smooth over. This gives a more honest picture of how a strategy would’ve actually performed.


    Yes. Volume confirms whether a price move has real strength behind it or if it’s likely to reverse. Ignoring volume means missing half the story a candle is telling.


  • DCA vs Buy & Hold Backtest 📊: Which Strategy 🏆 Won Across Bull 🐂, Bear & Sideways Markets?

    DCA vs Buy & Hold Backtest 📊: Which Strategy 🏆 Won Across Bull 🐂, Bear & Sideways Markets?

    Ser, you’ve probably asked yourself this at 2 am staring at a chart: buy it all now, or drip your money in slowly?

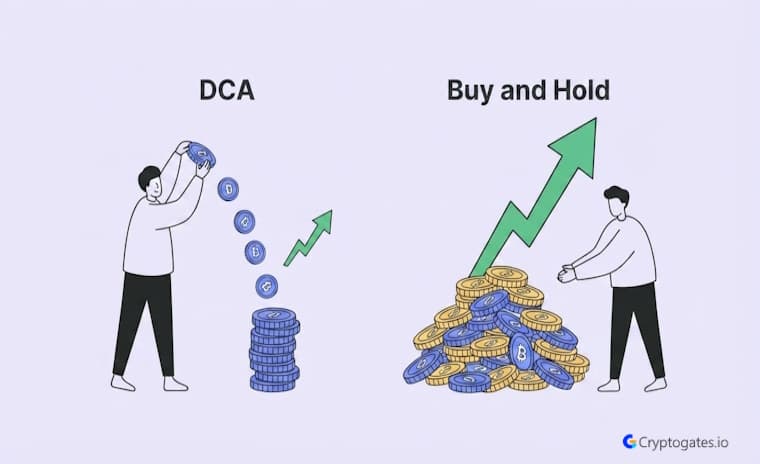
    Most people pick a side based on vibes, not data. That’s the problem with the whole DCA vs buy and hold backtest debate.

    This piece runs the actual numbers across a full year of price action, across bull, bear, and sideways conditions, in the same spirit as our DCA backtests across three market regimes, and hands you a playbook for each.

    EXECUTIVE SUMMARY
    • The Problem: Most traders pick DCA or buy and hold based on gut feeling, not tested results.
    • The Solution: A structured 1-year backtest across bull, bear, and sideways conditions shows exactly when each strategy wins.
    • The Incentive: Knowing which approach fits your market and your coin means fewer emotional decisions and better capital efficiency.
    • The Risk: Past backtest results never guarantee future performance, and crypto’s volatility can break both strategies if risk isn’t managed.

    DCA vs Buy & Hold: The Basics

    DCA means putting in a fixed amount on a set schedule, no matter what the price does, a method our DCA Strategy Guide breaks down step by step.

    You’re not calling the bottom; you’re just smoothing your average entry over time. Buy and hold is simpler: one entry, then you sit on it.

    According to Vanguard Research’s rolling-period study across US, UK, and Australian markets from 1976 through 2022, lump sum investing outperformed dollar-cost averaging in roughly 68% of 12-month periods tested.

    That’s from traditional markets, not crypto, but it’s a useful baseline.

    Crypto’s volatility changes these odds quite a bit, which is why we ran our own scenario tests below.

    CG STRATEGY ANALYZER

    Confused about
    market outlook?

    Trading without a plan is just gambling. Our strategy architect analyzes your risk tolerance and capital to match you with a proven algorithmic framework.

    PASSIVE DCA Bot
    AGGRESSIVE Grid Pro
    BALANCED Rebalance

    But here’s the issue: your entry point still carries almost all the risk.

    Buy at the wrong moment, and “just hold” can mean staring at red for months.

    Why and How We Backtested This

    Backtesting isn’t about proving a strategy is “right.”

    It’s about replacing assumptions with historical testing. Every scenario below used the same starting capital, the same one-year window, and the same fees.

    No cherry-picked coins, no cherry-picked timeframes.

    Metrics we tracked

    Final portfolio value, average entry price, maximum drawdown, ROI, capital efficiency, and emotional simplicity, yeah, that last one matters more than people admit.

    Is DCA always safer than buy and hold in crypto?

    Not always. DCA reduces timing risk but can’t protect you from a fundamentally weak coin. Safer usually means smoother, not risk-free.

    Backtest 1 — Bull Market Scenario

    In our bull run scenario, buy and hold pulled ahead on raw ROI, and that tracks with the Vanguard data too.

    When price trends up early and keeps climbing, sitting fully invested from day one just captures more of the move.

    CONFIDENTIAL // RESEARCH
    STRATEGY INTELLIGENCE

    Proven Setups &
    Expert Breakdowns.

    We don’t just show you the data; we engineer and validate high-performance strategies, providing the “Alpha” behind the numbers.

    DCA still performed fine, ngl; it wasn’t a disaster- a pattern that shows up in our BTC DCA bot backtest during a 14.5% bull run too.

    But some of those gradual purchases landed at higher prices than the initial lump sum entry. You get less exposure to timing risk, but you give up some upside during strong momentum.

    What This Means

    Buy and hold usually wins this one when the trend is clean and sustained.

    DCA still holds its own; it just trades some upside for a smoother ride.

    Really, the outcome hinges on how early the investor got in, not which strategy is objectively “better.”

    Backtest 2 — Bear Market Scenario

    Markets don’t always cooperate.

    In our bear market scenario, DCA pulled ahead by a solid margin.

    Buying at fixed intervals during a falling market means your average cost keeps dropping along with the price.

    Meanwhile, a lump sum entry made near the top just sits there bleeding, waiting for a recovery that might take a while.

    CEO Note:

    Zaheer here. This is exactly why we built the backtest bots the way we did. Nobody should find out the hard way that their entry timing was the whole strategy. Test it first. Verify before you risk capital.

    That doesn’t mean buy and hold is “bad” here. It means the entry point carried almost all the risk.

    What This Means

    DCA typically wins on capital preservation, mainly because the average cost keeps dropping with price.

    Buy and hold can struggle hard if recovery takes time, especially near a local top. In a bear cycle, patience beats speed.

    “the best-performing asset class in history”

    Raoul Pal, Co-Founder & CEO of Real Vision, former Goldman Sachs macro executive

    Backtest 3 — Sideways Market Scenario

    Chop is brutal for a different reason than a crash.

    In our range-bound scenario, DCA came out feeling like the safer bet, since it kept buying small amounts through the noise instead of committing everything to one flat entry.

    SYSTEM ACCESS: CG4.2

    Stop Guessing.
    Stress Test Your Edge.

    The market doesn’t care about your backtest. Our engine simulates 1,000+ “what-if” scenarios to ensure your strategy is built for survival.

    Run Crypto Strategy Engine →
    ROBUSTNESS SCORE
    75+ STRUCTURAL EDGE
    RISK OF RUIN < 1%
    TARGET HIT 92%

    Buy and hold can look weak here.

    If price ends the year roughly where it started, a single lump-sum entry just shows a flat line, no real gain for the wait.

    A sideways market doesn’t punish you fast, it just wears you down slowly.

    Different Coins, Different Outcomes

    Same two strategies, same time period, but a completely different coin, and coin quality changes everything.

    1. Bitcoin

    BTC tends to be the most stable benchmark for testing either strategy.

    Its liquidity and market strength make it the fairest asset to judge DCA against buy and hold without extra noise.

    2. Ethereum

    ETH usually shows bigger swings than BTC, and that volatility works in DCA’s favor.

    More dips mean more chances to lower your average entry price, so the gap between the two strategies narrows.

    Real Backtest Example

    Strategy: DCA
    Coin: ETH/USDT
    Market Condition: Sharp post-peak decline (32% drop over 46 days)
    Objective: Test whether scheduled entries actually reduce damage during a fast bleed

    During one of the steeper ETH corrections of the year, a DCA bot running fixed-interval entries closed the window down just 1.81%, while a straight buy-and-hold position on the same capital lost significantly more.

    The bot didn’t turn the drawdown into a profit — it never claimed to. What it did was cut the damage by roughly $253 compared to sitting still, purely by spacing entries across the decline instead of taking the full hit at once.

    Expert Interpretation: This is the practical version of the volatility argument made earlier — ETH’s bigger swings don’t just create more downside, they create more entry points to average against. The value of DCA here isn’t upside capture, it’s damage control.

    View Complete Playbook: https://cryptogates.io/playbooks/eth-crashed-32-in-46-days-our-dca-bot-lost-only-1-81/

    H3: The Heading3. High-Volatility Altcoins

    This is where it gets spicy.

    Buying and holding a high-volatility altcoin can produce a 100x gem outcome or leave you fully rekt; there’s not much middle ground.

    DCA can soften bad timing, but only if the coin survives the year at all.

    What the Data Actually Reveals

    One backtest proves nothing on its own. Robustness only shows up when you run the same comparison across several coins and market types. Once you stack the scenarios together, a pattern shows up clearly:

    DCA tends to reduce emotional stress and timing risk across the board. Buy and hold can outperform, but mostly in strong, sustained bull conditions where being fully invested early just pays off.

    TIP:

    “The best investment strategy is the one you can actually stick with.” Morningstar behavioral finance research team, as cited in due.com’s analysis of DCA vs lump sum investing

    Playbooks

    Playbook 1 — Bull Market

    If the trend is already sending it hard, buy and hold works well for coins you have real conviction in.

    Prefer a smoother ride?

    Use DCA instead. Best for: BTC, ETH, long-term conviction coins.

    Real Backtest Example

    Strategy: DCA
    Coin: BTC/USDT
    Market Condition: Sustained bull run (BTC up ~14% in April)
    Objective: Check whether DCA still adds value once the trend is clearly up

    When BTC climbed roughly $11,674 in a single month, a DCA bot running on autopilot closed the period with zero losing sessions and a modest net gain.

    It didn’t beat a simple buy-and-hold position — in a clean uptrend, being fully invested from day one is hard to beat — but it captured a real, positive return without a single closed loss along the way.

    Expert Interpretation: This backtest is the clearest evidence for the article’s own conclusion: in strong, sustained bull conditions, buy-and-hold has the structural edge. DCA still works and still protects against bad timing, but it trades some upside for consistency — exactly the trade-off Playbook 1 describes.

    View Complete Playbook: https://cryptogates.io/playbooks/btc-rallied-14-in-april-our-dca-bot-still-pocketed-43-with-zero-closed-losses/

    Playbook 2 — Bear Market

    Build your position gradually.

    Avoid dumping a full lump sum at once; you have no way of knowing if this is the bottom. Best for: long-term accumulation in coins with real staying power.

    Playbook 3 — Sideways Market

    DCA helps you avoid getting stuck on a bad single entry during chop.

    Buy and hold only makes sense here if you’re betting on a future breakout. Best for: patient investors with a long time horizon.

    Does DCA work for altcoins the same way it works for Bitcoin?

    Not really. DCA can reduce bad timing on altcoins, but it can’t rescue a project with weak fundamentals.

    Playbook 4 — High-Volatility Altcoins

    Only DCA into altcoins with real liquidity and fundamentals behind them.

    Buy and hold on a random microcap is basically a lottery ticket, not a strategy.

    Common Mistakes and Which Strategy Actually Wins

    Most “DCA vs buy and hold” comparisons online are kind of a mess.

    People compare completely different coins without adjusting for risk, ignore fees and timing, or judge an entire strategy off a single market phase.

    Swipe to view full data →
    Market Condition Strategy That Tends to Lead Why
    Bull Market Buy & Hold Full exposure captures early upside
    Bear Market DCA Lowers average cost as prices decline
    Sideways Market DCA Smooths entry risk during choppy conditions
    High-Volatility Altcoins Depends on fundamentals DCA reduces timing risk only if the project survives

    So which strategy wins overall?

    There isn’t a universal answer. Buy and hold tends to win in strong, sustained bull markets.

    DCA tends to win on consistency and lower emotional pressure. Strategy fit depends on coin quality, market cycle, and your own investor psychology.

    The Real Takeaway From a Year of Backtesting

    A full year of testing across bull, bear, and sideways conditions shows DCA and buy and hold both work, just not in the same conditions, and not for the same kind of investor.

    Buy and hold rewards conviction and good timing.

    DCA rewards consistency and patience.

    Neither one removes risk completely, and that’s exactly why testing beats guessing every time, especially since only a small fraction of retail traders stay profitable across full market cycles.

    Before You Pick a Strategy

    • Have you backtested this coin instead of assuming the strategy works?
    • Are you factoring in trading fees and realistic entry timing?
    • Does your risk tolerance actually match the potential drawdown?
    • Are you choosing based on data, or just what Crypto Twitter is hyping this week?
    • Would you still be comfortable holding through a 50%+ market drop?

    If you want to see how these numbers actually play out on your own parameters, the DCA Strategy Backtest Bot lets you run this comparison yourself, no signup, no capital at risk, just real historical data doing the talking.

    HISTORICAL DATA AUDIT

    Battle-Test Your Strategy
    Before the Market Does.

    Eliminate guesswork with institutional-grade backtesting for DCA, Grid, and Rebalance bots. Real historical data. Real-world results.

    EST. OPTIMIZATION +42% ROI Efficiency
    Start Backtest Now

    Sourced from 5+ Years of Exchange Data

    FAQs

    Is DCA better than buy and hold for crypto?

    Not universally. DCA tends to reduce timing risk and stress, while buy and hold often wins in strong bull markets. It depends on the coin and the cycle.

    A full year captures enough volatility and trend behavior to be useful, though testing across multiple market cycles gives a more reliable picture.

    Not exactly. DCA can reduce bad timing on altcoins, but it can’t fix weak fundamentals. Coin quality still decides the outcome either way.

  • Best Performing Grid Strategies 📈 That Beat Buy & Hold 🛡️ Even While Losing Money 📉

    Best Performing Grid Strategies 📈 That Beat Buy & Hold 🛡️ Even While Losing Money 📉

    Ser, if you saw “-19.97% ROI” on a strategy report, you’d probably close the tab.

    Fair reaction. Nobody wants red numbers.

    But here’s the thing. That -19.97% belongs to a grid bot that just quietly outperformed simply holding SHIB by over 26 percentage points during the same seven months. Best performing grid strategies aren’t the ones with green ROI. They’re the ones that lose less than the market around them.

    This isn’t theory.

    CryptoGates ran three separate grid backtests across SHIB, ASTER, and ENA between June and December 2025, using real historical 1-minute OHLCV data. Every single one showed negative absolute ROI.

    Every single one crushed its buy-and-hold benchmark anyway.

    EXECUTIVE SUMMARY
    • The Problem: Traders assume a grid bot posting a red ROI number failed, so they scrap the setup and go back to guessing.
    • The Solution: Compare grid performance against Spot Buy & Hold on the same asset, same window, and same starting capital to see the real story.
    • The Incentive: All three CG backtested playbooks beat their Buy & Hold benchmark by 20 to 36 percentage points, even while showing negative headline ROI.
    • The Risk: Past backtest results on SHIB, ASTER, and ENA don’t guarantee future performance, and grid bots can still lose money in strong trending markets.

    Grid trading bots exist for exactly this kind of market, sideways, choppy, directionless price action where most traders get bored or bled dry waiting for a trend that never comes.


    Let’s break down what actually happened in these three playbooks, and what it teaches you about judging grid performance the right way.

    Research Snapshot

    The SHIB, ASTER, and ENA playbooks aren’t isolated cases.

    CryptoGates’ broader grid-bot testing shows the same pattern repeating across trending downturns, not just choppy sideways ranges.

    When BNB fell 33% after its all-time high, a grid bot generated $163.94 in grid profit and closed at -21.64% ROI, still a meaningful cushion against a straight-line crash. During SOL’s post-election sell-off, a grid bot lost $42.21 against a $1,000 position while a spot holder lost $187.90 on the same capital, a $145.69 gap from grid logic alone.

    The consistent lesson:
    Grid bots don’t need a sideways market to soften losses. They need the price to keep oscillating, even within a falling range, for the buy-low-sell-high mechanism to continue extracting value as the asset bleeds.

    Playbook references: BNB Grid Bot Crash Backtest | SOL Post-Election Crash Grid Backtest

    What Makes a Grid Strategy “Best Performing”?

    Most people rank strategies by one number.

    ROI. Green good, red bad. Simple.

    Except that’s not how risk works, and it’s definitely not how grid bots work.

    A grid strategy’s real job isn’t to guarantee profit. It’s to harvest volatility within a range while limiting the damage a falling market can do to your capital.

    CEO Note:

    “We don’t chase green numbers for the sake of green numbers. We test what actually protects capital when the market isn’t cooperating. That’s the whole point of verify first, risk later.” — Zaheer

    So the real benchmark isn’t zero.

    It’s what would’ve happened if you just bought the asset and held it through the same period. That’s the comparison that tells you whether a strategy is doing its job.

    SYSTEM ACCESS: CG4.2

    Stop Guessing.
    Stress Test Your Edge.

    The market doesn’t care about your backtest. Our engine simulates 1,000+ “what-if” scenarios to ensure your strategy is built for survival.

    Run Crypto Strategy Engine →
    ROBUSTNESS SCORE
    75+ STRUCTURAL EDGE
    RISK OF RUIN < 1%
    TARGET HIT 92%

    Why Raw ROI Alone Is Misleading

    Here’s what most beginners miss.

    A trending bear market can nuke every strategy in the book. DCA bleeds. Grid bleeds. Spot holding bleeds hardest of all.

    The question was never “did I make money?“

    The question is, “Did my strategy protect me better than doing nothing structured at all?”

    Across all three CryptoGates grid backtests (SHIB, ASTER, ENA, June to December 2025), grid strategies outperformed Spot Buy & Hold by an average of 27.5 percentage points per asset.

    Source: CryptoGates internal backtest data, Grid Strategy Backtest Bot.

    Grid trading can be profitable in sideways and ranging markets where the price oscillates without a strong trend, but grid bots are less effective in strong downtrends, since the bot keeps buying into falling prices.

    That’s exactly why comparing grid ROI to buy-and-hold ROI on the same asset matters more than the headline number by itself.

    Playbook 1 — SHIB Sawtooth Range Trader (Jun–Dec 2025)

    SHIB spent seven straight months doing what SHIB does best, chopping sideways with the occasional violent wick. That’s exactly the kind of “sawtooth” price action a grid bot was built for.

    1. Setup and Market Regime

    The backtest ran a 7-day price range selector with 50 grids, arithmetic spacing, and a 2.5% profit target per grid.

    Total investment sat at 3,000 USDT.

    Persistent liquidity rotations kept SHIB oscillating inside a defined range for most of the window, creating repeated scalp opportunities instead of one clean trend.

    Mark Douglas,
    “The consistency you seek is in your mind, not in the markets.”

    Mark Douglas, author of Trading in the Zone

    That line matters here.

    The grid didn’t need SHIB to go up. It needed SHIB to keep moving, and it did.

    2. Results Breakdown

    The numbers:

    -19.97% total ROI, 153.43 USDT in grid profit, 477 completed trades, a 63.75% grid efficiency rate, and a max drawdown of 32.92%. Spot Buy & Hold on the same asset, same window? -46.06%.

    Is a losing grid bot backtest still worth learning from?

    Yes. Compare it against Spot Buy & Hold on the same asset and window. If the grid lost less, the strategy logic worked even though the market didn’t cooperate.

    That’s a 26.09 percentage point gap in favor of the grid bot.

    Total fees paid came to 15.93 USDT, a small tax against the downside protection the strategy delivered. Annualized, the buy-and-hold path was tracking toward -31.61%, worse than the grid’s actual realized loss even before annualizing.

    NGL, a -19.97% headline still stings. But compared to watching SHIB’s spot price get cut nearly in half, the grid did its job.

    HISTORICAL DATA AUDIT

    Battle-Test Your Strategy
    Before the Market Does.

    Eliminate guesswork with institutional-grade backtesting for DCA, Grid, and Rebalance bots. Real historical data. Real-world results.

    EST. OPTIMIZATION +42% ROI Efficiency
    Start Backtest Now

    Sourced from 5+ Years of Exchange Data

    Playbook 2 — ASTER Mean-Reversion Trap (Jun–Dec 2025)

    Here’s the interesting part.

    ASTER produced the widest outperformance gap of all three playbooks, and it wasn’t close.

    1. Setup and Market Regime

    This backtest used a 30-day price range, 45 grids, geometric spacing, and a 2.8% profit target per grid, with 2,000 USDT deployed. The market regime was high-volatility consolidation.

    A series of minor flash-crashes followed by sharp technical bounces defined the second half of 2025 for ASTER, the kind of price behavior that snaps back to the mean instead of trending away from it.

    Real Backtest Example

    Strategy: Grid
    Coin: ETH/USDT
    Market Condition: Sharp downtrend, 27% collapse
    Objective: Test whether grid logic limits downside during a fast, directional crash rather than a range-bound chop

    Key Result: ETH dropped $984 over 44 days. A spot holder on the same capital lost 26.94%. The grid bot, working the same falling price action, closed at -8.36% ROI while still generating $62.74 in live grid profit before the price broke beneath the range floor.

    Expert Interpretation: This backtest is the clearest counterexample to the assumption that grid bots only work in flat markets. Even breaking below the configured range, the bot’s earlier trades inside that range had already banked enough profit to cut the eventual loss to less than a third of what buy-and-hold suffered.

    View Complete Playbook →

    Geometric grid logic fits that pattern better than arithmetic spacing does, since the grid levels compress more tightly near the current price and widen out further away, matching how mean-reverting assets actually move.

    2. Results Breakdown

    Total ROI came in at -30.57%, with 228.12 USDT in grid profit across 809 trades. Grid efficiency landed at 34.14%, and max drawdown hit 36.77%. Spot Buy & Hold on ASTER over the same period? -66.47%.

    That’s a 35.90 percentage point outperformance gap, the largest of the three playbooks. Total fees paid were 19.06 USDT.

    CG STRATEGY ANALYZER

    Confused about
    market outlook?

    Trading without a plan is just gambling. Our strategy architect analyzes your risk tolerance and capital to match you with a proven algorithmic framework.

    PASSIVE DCA Bot
    AGGRESSIVE Grid Pro
    BALANCED Rebalance

    Honestly, this is the playbook that makes the case hardest.

    A trader who just held ASTER through this window lost roughly two out of every three dollars. The grid bot, working with the same volatility that wrecked the spot price, kept more than double the capital intact by comparison.

    Bulls weren’t defending anything here. This was a pure “the range absorbed the damage” story.

    Playbook 3 — ENA Choppy Trend Mitigation (Jun–Dec 2025)

    ENA’s the one that actually pulled off the best relative performance of the whole set, even though it wasn’t the flashiest setup on paper.

    Setup and Market Regime

    This backtest ran a 30-day price range with 40 grids, arithmetic spacing, and a 2% profit target, backed by 2,500 USDT. The regime here gets labeled “unpredictable range.”

    ENA mostly stayed inside its boundaries, but it broke out with sharp price spikes in November, the kind of move that can wreck a grid bot if the boundaries aren’t set with enough discipline.

    Real Backtest Example

    Strategy: Grid
    Coin: ETH/USDT
    Market Condition: Sharp downtrend, 27% collapse
    Objective: Test whether grid logic limits downside during a fast, directional crash rather than a range-bound chop

    Key Result: ETH dropped $984 over 44 days. A spot holder on the same capital lost 26.94%. The grid bot, working the same falling price action, closed at -8.36% ROI while still generating $62.74 in live grid profit before the price broke beneath the range floor.

    Expert Interpretation:
    This backtest is the clearest counterexample to the assumption that grid bots only work in flat markets. Even after breaking below the configured range, the bot’s earlier trades inside that range had already banked enough profit to cut the eventual loss to less than a third of what buy-and-hold suffered.

    View Complete Playbook →

    That’s the real lesson buried in this playbook.

    Grid density and range width aren’t just settings you pick once and forget.

    They’re the difference between a bot that survives a breakout and one that gets caught holding a falling position outside its range.

    2. Results Breakdown

    Total ROI landed at -13.99%, the smallest loss of the three.

    Grid profit came to 296.73 USDT across 1,046 trades, the highest trade count in the set.

    Swipe to view full data →
    Playbook Grid ROI vs Spot B&H
    SHIB Sawtooth (7D, 50 Grids, Arithmetic) -19.97% +26.09pp Outperformance
    ASTER Mean-Reversion (30D, 45 Grids, Geometric) -30.57% +35.90pp Outperformance
    ENA Choppy Mitigation (30D, 40 Grids, Arithmetic) -13.99% +20.58pp Outperformance

    Grid efficiency sat at 30.71%, and max drawdown reached 67.86%, notably deeper than SHIB or ASTER despite the smaller headline loss.

    Total fees paid were 33.96 USDT. Spot Buy & Hold on ENA over the same window came in at -34.57%.

    Does grid spacing logic (arithmetic vs geometric) change performance?

    Yes. Arithmetic spacing works well for steady range-bound assets like SHIB and ENA. Geometric spacing suited ASTER’s mean-reversion pattern better in this backtest.

    That’s a 20.58 percentage point gap. Smaller than ASTER’s, but ENA still delivered the best absolute ROI of the three grid backtests, losing less than 14 cents on the dollar while the market it traded lost more than double that.

    What These Three Playbooks Teach About Grid Performance

    Here’s what actually matters when you zoom out.

    Every single playbook beat its buy-and-hold benchmark by at least 20 percentage points.

    That’s not luck across three unrelated assets over the same seven-month window. That’s a pattern.

    The Common Thread Across All Three

    Range-bound and choppy markets are where grid bots earn their keep.

    SHIB chopped, ASTER mean-reverted, ENA stayed contained with occasional breakouts, and in every case the grid logic captured value from the noise instead of getting bled by it.

    Larry Fink, BlackRock
    “Over time, staying invested has mattered far more than getting the timing right.”

    Larry Fink, BlackRock Chairman’s Letter, 2026

    That’s a spot-holding mindset, and it’s fine for trending markets. But look, none of these three assets were trending.

    They were grinding sideways, and a buy-and-hold approach has no mechanism to extract value from grinding. A grid bot does.

    Before You Run Your Own Grid Playbook

    • Confirm the asset is actually range-bound, not quietly trending, before picking grid over spot
    • Match grid spacing logic to the asset’s behavior: arithmetic for steady ranges, geometric for mean-reversion
    • Always pull the Spot Buy & Hold ROI for the same window before judging your grid result
    • Widen your range or reduce grid density if the asset has a history of breakout spikes
    • Track max drawdown separately from ROI, since a smaller loss can still carry deeper drawdown risk

    Test Before You Trust Any Playbook

    Look, none of these three numbers is a signal to copy the exact settings and expect the same result.

    SHIB, ASTER, and ENA each had their own price behavior during this specific seven-month window, and markets don’t repeat on command.

    CONFIDENTIAL // RESEARCH
    STRATEGY INTELLIGENCE

    Proven Setups &
    Expert Breakdowns.

    We don’t just show you the data; we engineer and validate high-performance strategies, providing the “Alpha” behind the numbers.

    What actually transfers is the method. Compare grid ROI against Spot Buy & Hold on the same asset, same window, before deciding whether a strategy failed or worked.

    Run your own parameters through the Grid Strategy Backtest Bot and see what your specific asset and range actually produce, verify first, risk later, scale slowly.

    FAQs

    What’s a good grid strategy ROI benchmark?

    Don’t judge grid ROI in isolation. Compare it against Spot Buy & Hold on the same asset and window, since outperforming the benchmark matters more than hitting a fixed number.

    Grid bots profit from price oscillation inside a range, not direction. In a strong trend, the bot either sits out gains or keeps buying into a falling price.

    Yes, if it loses significantly less than simply holding the asset would have. All three backtests here posted negative ROI but still beat buy-and-hold by 20 to 36 percentage points.

  • How the Crypto Strategy Engine 🧪 Separates Real Trading Edges 📊 from Pure Luck 🎯

    How the Crypto Strategy Engine 🧪 Separates Real Trading Edges 📊 from Pure Luck 🎯

    Ever run a backtest, see a shiny green number, and think “okay, this strategy is proven”?

    Ser, that’s exactly the trap most beginners fall into.

    One clean backtest just shows you one version of the past — the market doesn’t care about that single lucky sequence.

    Retail traders experience losses at rates estimated between 70% and 90% over the long run — and a big chunk of that comes down to strategies that were never actually stress tested.

    Forrester Research

    That’s the entire reason the crypto strategy engine exists.

    Instead of trusting one outcome, it runs your setup through thousands of “what if” scenarios before you ever risk a dollar.

    EXECUTIVE SUMMARY
    • The Problem: Most traders trust a single backtest result and assume their strategy is proven, when it’s really just one lucky (or unlucky) sequence of trades.
    • The Solution: CryptoGates’ Strategy Engine runs your setup through thousands of randomized Monte Carlo scenarios to reveal how it holds up across different market orders.
    • The Incentive: You get a real Robustness Score and Risk of Ruin percentage before you ever automate real capital.
    • The Risk: Even a robust score doesn’t guarantee future profit — it just means your edge looks structural instead of accidental. Not financial advice.

    What Is the CryptoGates Strategy Engine?

    Think of it as a stress lab for your trading idea.

    You feed it your win rate, your average win and loss size, your capital — and it doesn’t just run your strategy once. It runs it thousands of times, in thousands of different orders, to see where it breaks.

    CEO Note:

    “We built the Engine because a single backtest tells you what happened. It doesn’t tell you what could happen. Verify first, risk later — that’s not a slogan for us, it’s the actual math.”

    1. Why “Testing Once” Isn’t Enough

    A backtest is just one path through history.

    Your trades happened in a specific order, on a specific set of days. Shuffle that order and suddenly your equity curve looks completely different.

    Maybe worse. Maybe way worse. That’s the blind spot most traders never check.

    2. The Core Idea — Monte Carlo Simulation

    This is where things change.

    The Engine takes your trade history and reshuffles it — like shuffling a deck — hundreds or thousands of times.

    Each shuffle is a possible version of your future.

    If your score holds up across all of them, your edge is probably real. If it swings wildly between runs… yeah, that’s a warning sign, not a bug.

    Real Backtest Example

    Strategy: DCA (Dollar-Cost Averaging Bot)
    Coin: TAO/USDT
    Market Condition: Sharp 36% pump followed by a full reversal into a 17% loss — a complete round trip
    Objective: Test whether a fixed-step DCA bot could stay net profitable across 140 individual sessions, even as the underlying asset itself round-tripped into negative territory

    Key Result: 139 of 140 sessions closed in profit. Only one session, out of the entire run, closed red — even though TAO itself ended the period down 17% from its peak.

    Expert Interpretation: This is the same principle the Strategy Engine is built to test, just seen from a different angle. Each of those 140 sessions is effectively one “shuffle” through a different slice of the same volatile period.

    If a strategy only worked because of one lucky sequence, you’d expect the win rate to fall apart once conditions changed. Here, the edge held up through the pump, the reversal, and the bleed-back — which is closer to what a high Robustness Score is meant to represent than any single backtest could show on its own.

    View Complete Playbook → https://cryptogates.io/playbooks/tao-dca-bot-made-1677-while-spot-holders-lost-17/

    Walking Through a Real Strategy Test

    Numbers help more than theory here, so let’s actually run one.

    Sara’s team pulled a real test from a user profile — a trader named Peter, running a Pro Scalper preset through the Engine.

    1. The Inputs — Win Rate, Avg Win/Loss, Capital

    Peter set his Win Rate at 68%, with an average win of $150 against an average loss of $120.

    Starting capital was $2,000, with a target portfolio of $3,500.

    “Win rate alone means nothing without a matching loss size. A 68% win rate with a bad risk-reward ratio can still bleed an account dry.”

    Priya Malhotra, Quant Research Analyst

    Position sizing was set to Half Kelly — a conservative sizing model that avoids over-betting on any single trade.

    Optimize-for was set to Lowest Fees, and Market Regime stayed on Normal.

    2. The Stress Settings Applied

    Here’s the part most people skip entirely.

    Peter enabled Missed Trades — which simulates exchange downtime or a slow execution — but left Flash Crash Mode off for this run.

    He also added a 0.05% slippage tax, a small but real cost that eats into fills over hundreds of simulated trades.

    Slippage and execution friction alone can account for a measurable drag on strategy performance over large trade samples, according to backtesting research from FX Replay — small percentages, compounded thousands of times, aren’t small anymore.

    Decoding the Results — What the Numbers Actually Mean

    Strategy-Lab-Advanced-Crypto-Backtesting-Stress-Testing-Engine-07-14-2026_09_29_PMPeter’s test came back with a full set of numbers.

    On their own they’re just digits. Together, they tell a story about whether his edge is structural or just a lucky run.

    Does a high win rate mean a strategy is safe?

    Not by itself. A high win rate combined with a bad risk-reward ratio can still lose money over time.

    Robustness Score and Risk of Ruin matter more than win rate alone.

    1. Robustness Score — Structural Edge vs. Accident

    Peter’s Robustness Score came out at 93.

    Honestly, that’s a strong number — CryptoGates treats 75+ as the professional target, meaning the edge held up across most simulated market regimes instead of collapsing under randomness.

    A low score here usually means the strategy only worked because history happened to break in its favor.

    Swipe to view full data →
    Metric Peter’s Result What It Means
    Robustness Score 93 Structural, not accidental
    Risk of Ruin 2.0% Low catastrophic risk
    Target Hit Probability 98.0% High confidence in reaching goal

    2. Risk of Ruin and Drawdown — The Pain Threshold

    Peter’s Risk of Ruin sat at just 2.0% – the probability his account hits a catastrophic drawdown before reaching target.

    His 95% Probable Drawdown landed at $1,076, meaning in 95% of simulated paths, his loss never went past that dollar figure.

    Professional standards flag anything above 1% Risk of Ruin as high risk, so 2% is worth watching but isn’t a dealbreaker on its own.

    Reality Check

    Common belief: A large max drawdown percentage automatically means a strategy is too dangerous to trust.

    What CryptoGates research found: In a live backtest of a DCA bot during one of BTC’s sharpest fortnights of 2025 — a $10,000+ drop in 15 days — the strategy’s max drawdown figure hit 95.87%. Read in isolation, that number looks like a near-total wipeout.

    But 10 of 11 sessions in that same test still closed at take-profit, and the bot ended the period net positive.

    The scary-looking drawdown reflected one specific stretch of unrealized paper loss on an open position, not the actual outcome of the strategy.

    Why it matters: A single stat, taken out of context, can misrepresent risk in either direction — too safe or too dangerous.

    That’s exactly why Risk of Ruin and Probable Drawdown are measured across thousands of simulated paths instead of one backtest: a drawdown number only means something once you know how often, and how badly, it actually plays out across the full distribution of outcomes — not just the worst-looking single run.

    Playbook:
    https://cryptogates.io/playbooks/btc-crashed-8-in-15-days-our-dca-bot-still-made-84/

    3. Target Hit Probability and 50% Loss Probability

    But there’s a problem worth flagging even in a strong result.

    Peter’s Target Hit Probability came in at 98%, which sounds close to perfect.

    His 50% Loss Probability sat at 2.0% too — a psychological gut-check number showing how likely he was to lose half his starting capital.

    When Target Hit Probability is way higher than Risk of Ruin, that’s usually a sign of a well-built strategy, not just a hopeful one.

    Why This Changes How You Trade

    Here’s what actually matters after seeing a result like Peter’s.

    A 93 Robustness Score doesn’t mean “go all in tomorrow.” It means the strategy earned the right to be tested further – maybe with real capital, maybe with tighter position sizing, maybe with Flash Crash Mode turned on for one more brutal stress check.

    “The traders who survive long-term aren’t the ones with the best strategies. They’re the ones who are honest about what their data actually says before they scale up.”

    Marcus Chen, Risk Management Consultant

    From Guessing to Verifying

    The simple truth is most traders skip this step entirely. They see one green backtest and jump straight to live trading. CT calls this “ape in” behavior for a reason – no verification, just vibes.

    What is a good Robustness Score for a crypto strategy?

    CryptoGates treats 75 and above as a professional target. Scores below that suggest the strategy may be more luck than structural edge.

    Wait — that’s kind of the whole point of Verify first. Risk later. Scale slowly. Not a tagline. An actual sequence: test, stress-test, then – only then – automate.

    Test Your Own Edge Before You Risk It

    One clean backtest was never proof – it just felt like it.

    The Strategy Engine takes Peter’s setup, or yours, and runs it through thousands of Monte Carlo scenarios to show whether an edge is real or just a fluke of timing.

    A 93 Robustness Score, 2% Risk of Ruin, 98% Target Hit Probability — those numbers only mean something because they survived the shuffle. Or, well, they survived most of the shuffle — no test guarantees the future.

    That’s kind of the point.

    Run your own numbers. See what the data actually says before you scale anything up.

    FAQs

    What does a Robustness Score measure in the Strategy Engine?

    It measures how consistent a strategy’s performance stays across thousands of simulated market orders. A score of 75 or higher suggests the edge is structural, not accidental.

    Each run performs a fresh Monte Carlo Simulation with a new random sequence. If your score stays stable across runs, the strategy is likely robust.

    No. Low Risk of Ruin means catastrophic loss is less likely, but it doesn’t guarantee future returns. Always treat results as probabilities, not promises.

  • Strategy Builder 🛠️ vs Strategy Engine ⚙️: The Real Difference Every Trader Should Know 📊

    Strategy Builder 🛠️ vs Strategy Engine ⚙️: The Real Difference Every Trader Should Know 📊

    Ser, honestly, this confusion trips up a lot of traders.

    They build a strategy, rules look clean, logic feels solid, and they assume it’s ready.

    But building a strategy and proving it can survive real markets are two completely different things.

    A significant share of retail trading strategies that look profitable in a single backtest fail when tested against different market sequences.

    Forrester Research

    The strategy builder vs strategy engine question isn’t really about which tool is better.

    It’s about understanding what each one is actually for, because using one without the other is how people lose money on something that looked perfectly reasonable on paper.

    EXECUTIVE SUMMARY
    • The Problem: Traders assume a strategy is ready once it’s built, without checking if it can survive real market variance.
    • The Solution: Use a strategy builder to structure the rules, then a strategy engine to stress-test whether those rules actually hold up.
    • The Incentive: Knowing the difference stops you from risking capital on a strategy that only looks good, not one that’s actually proven.
    • The Risk: A strategy can be perfectly built and still fail badly if it was never stress-tested against real market conditions.

    What a Strategy Builder Actually Does

    A strategy builder is where an idea becomes something executable.

    You take a rough concept, like “buy this dip, sell at this level,” and turn it into defined entry rules, exit rules, and parameters a bot can actually follow.

    TIP:

    A well-structured strategy means nothing if it hasn’t been tested against real market stress. Structure is the starting point, not the finish line.

    Here’s the interesting part.

    This step feels like the hard part, and in some ways it is. But it’s only half the job.

    1. Good for Structuring Ideas

    Builders are genuinely useful here.

    They force you to define things clearly.

    No more vague ideas like “buy when it feels right.”

    You end up with actual rules, actual numbers, something concrete instead of a gut feeling dressed up as strategy.

    Is a strategy builder enough to start trading crypto?

    Not really. A builder helps you define clear rules, but it doesn’t tell you if those rules can survive real market volatility. That part needs separate testing.

    2. The Blind Spot — No Survival Check

    But there’s a problem. A builder can help you create a strategy that looks completely logical and still has never been tested against real volatility, real drawdowns, or a genuinely bad month. Structure isn’t the same as survival.

    Look, plenty of well-built strategies fall apart the first time the market gets messy, simply because nobody checked if they could take the hit.

    Research Insight

    Traders often assume that a good-looking equity curve from a single backtest is proof a strategy works.

    Across CryptoGates‘ internal Playbook testing, this assumption breaks down the moment a strategy is run against a different sequence of price action rather than the one it was built on.

    One clear example: a DCA bot tested through TAO’s volatile 2025 run — where the asset pumped 36%, then bled back into a 17% loss — still closed 139 of 140 sessions in profit.

    That kind of consistency only becomes visible when a strategy is tested across many overlapping market scenarios, not one clean historical run. It’s the same underlying idea behind stress-testing a strategy before scaling capital into it: one favorable backtest tells you almost nothing about how the strategy behaves when the sequence of trades changes.

    Full Playbook: https://cryptogates.io/playbooks/tao-dca-bot-made-1677-while-spot-holders-lost-17/

    What a Strategy Engine Actually Does Differently

    Here’s the key difference.

    A Strategy Engine doesn’t help you build rules. It takes rules you already have and puts them through pressure. Real pressure, not just one clean run through historical data.

    The simple truth is, this is the step most traders skip entirely, and it’s exactly the step that would’ve saved them money.

    CG STRATEGY ANALYZER

    Confused about
    market outlook?

    Trading without a plan is just gambling. Our strategy architect analyzes your risk tolerance and capital to match you with a proven algorithmic framework.

    PASSIVE DCA Bot
    AGGRESSIVE Grid Pro
    BALANCED Rebalance

    1. Monte Carlo Simulation Instead of a Single Backtest

    A single backtest shows you one version of history.

    Feels convincing at first glance, but ngl, it’s really just one sequence of trades that happened to play out a certain way.

    The Strategy Engine runs a Monte Carlo Simulation instead, shuffling thousands of trade permutations to see how the strategy behaves across many possible versions of the market.

    If performance holds steady across those runs, that’s a real signal.

    If it swings wildly from one run to the next, the strategy was leaning on luck more than logic.

    Reality Check

    Common belief: If a strategy generates trading profit, the strategy is working.

    What CryptoGates research found: In a Playbook testing a grid bot through BNB’s 33% post-ATH crash, the bot fired 171 trades and generated $163.94 in gross grid profit — a number that looks like a win in isolation. But total ROI still landed at −21.64%, because grid profit and account-level profit are not the same measurement.

    The strategy was structured correctly and executing exactly as designed, yet it still lost money overall once real market conditions were applied.

    Why it matters: This is the exact gap between building a strategy and proving it. A strategy can be logically sound and still bleed capital if it was never checked against how it performs once price moves outside the range it was built for. Structure alone doesn’t reveal that risk — only testing across real (or simulated) market stress does.

    Full Playbook: https://cryptogates.io/playbooks/grid-bot-vs-a-33-bnb-crash-what-the-backtest-data-actually-shows/

    2. Robustness Score and Risk of Ruin as Real Metrics

    This is where it gets concrete.

    The Engine gives you a Robustness Score, showing whether your edge is structural or accidental.

    Swipe to view full data →
    Feature Strategy Builder Strategy Engine
    Purpose Structures trading rules Stress-tests those rules
    Output Defined entry/exit logic Robustness Score, Risk of Ruin
    Testing Method None built-in Monte Carlo Simulation

    It gives you Risk of Ruin, the actual probability your account hits a catastrophic drawdown before reaching your target.

    These aren’t things a builder can ever measure, because a builder was never designed to test survival.

    SYSTEM ACCESS: CG4.2

    Stop Guessing.
    Stress Test Your Edge.

    The market doesn’t care about your backtest. Our engine simulates 1,000+ “what-if” scenarios to ensure your strategy is built for survival.

    Run Crypto Strategy Engine →
    ROBUSTNESS SCORE
    75+ STRUCTURAL EDGE
    RISK OF RUIN < 1%
    TARGET HIT 92%

    Why You Need Both, In the Right Order

    Honestly, this isn’t really a versus situation. Building without testing is guessing with extra confidence.

    Testing without something built first has nothing to actually test. Both steps matter, but only in the right order.

    1. Build First, Then Verify

    Structure the strategy first.

    Get the rules clear, the parameters defined, the logic locked in.

    Then, before a single dollar of real capital touches it, run it through stress testing. That order isn’t optional if you actually want to know what you’re risking.

    Hey, it’s Zaheer. I’ve seen too many well-built strategies lose money simply because nobody stress-tested them first. Building the rules is step one. Verifying them is what actually protects your capital. Verify first. Risk later. Scale slowly.

    ZAHEER, CEO CryptoGates

    2. Where Cryptogates Fits This Process

    This is exactly where the Crypto Strategy Engine comes in.

    It’s built for that second, often-skipped stage, taking a strategy that’s already structured and running it through thousands of scenario permutations before you ever scale real capital into it.

    What’s the difference between backtesting and stress testing a crypto strategy?

    Backtesting shows one historical outcome. Stress testing, like Monte Carlo simulation, shows how that same strategy performs across thousands of different market sequences.

    Build the Rules, Then Prove Them

    Ser, at the end of the day, a strategy builder and a strategy engine aren’t competing tools.

    They’re two different stages of the same process.

    A builder gives you structure, clear rules, defined logic.

    But structure alone doesn’t tell you what happens when the market gets ugly. That’s what a strategy engine is for, running your rules through thousands of scenarios to show whether they’re actually built to survive, not just built to look good.

    Skip that second step, and you’re basically trading on a guess with better formatting. Run your strategy through the Engine and see what the data actually says → cryptogates.io.

    FAQs

    What’s the difference between a strategy builder and a strategy engine?

    A builder helps you structure trading rules. A strategy engine stress-tests those rules across thousands of market scenarios before you risk real capital.

    Yes. Building without testing is guessing, and testing without a built strategy has nothing to actually verify. They work best together, in that order.

    Not on its own. A builder defines your rules, but only stress testing, like Monte Carlo simulation, shows whether those rules survive real market conditions.