

 Bitcoin
 Ethereum
 Solana
 TRON
 Hyperliquid
 Zcash
 Dogecoin
 Monero
 Chainlink
 Cardano
 Stellar
 Uniswap
 Sui
 Hedera
 Shiba Inu
 Bittensor
 Ripple USD
 Aster
 Polkadot
 World Liberty Financial
 Render
 Artificial Superintelligence Alliance

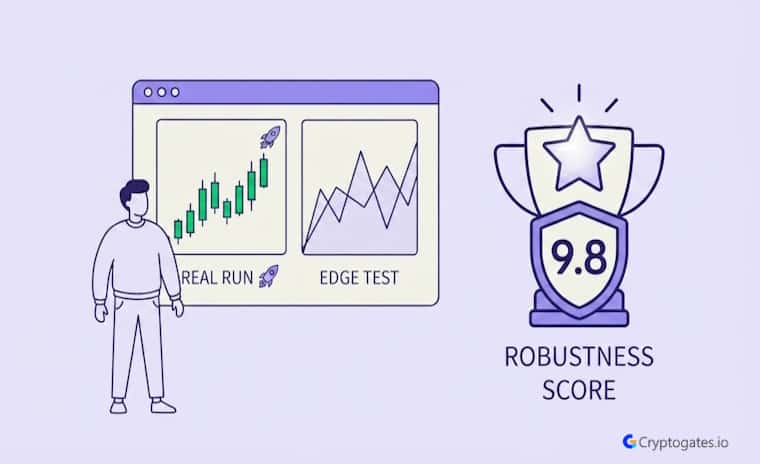
Ever run a backtest, see a shiny green number, and think “okay, this strategy is proven”?
Ser, that’s exactly the trap most beginners fall into.
One clean backtest just shows you one version of the past — the market doesn’t care about that single lucky sequence.
Forrester Research
That’s the entire reason the crypto strategy engine exists.
Instead of trusting one outcome, it runs your setup through thousands of “what if” scenarios before you ever risk a dollar.
- The Problem: Most traders trust a single backtest result and assume their strategy is proven, when it's really just one lucky (or unlucky) sequence of trades.
- The Solution: CryptoGates' Strategy Engine runs your setup through thousands of randomized Monte Carlo scenarios to reveal how it holds up across different market orders.
- The Incentive: You get a real Robustness Score and Risk of Ruin percentage before you ever automate real capital.
- The Risk: Even a robust score doesn't guarantee future profit — it just means your edge looks structural instead of accidental. Not financial advice.
What Is the CryptoGates Strategy Engine?
Think of it as a stress lab for your trading idea.
You feed it your win rate, your average win and loss size, your capital — and it doesn’t just run your strategy once. It runs it thousands of times, in thousands of different orders, to see where it breaks.

"We built the Engine because a single backtest tells you what happened. It doesn't tell you what could happen. Verify first, risk later — that's not a slogan for us, it's the actual math."
1. Why "Testing Once" Isn't Enough
A backtest is just one path through history.
Your trades happened in a specific order, on a specific set of days. Shuffle that order and suddenly your equity curve looks completely different.
Maybe worse. Maybe way worse. That’s the blind spot most traders never check.
2. The Core Idea — Monte Carlo Simulation
This is where things change.
The Engine takes your trade history and reshuffles it — like shuffling a deck — hundreds or thousands of times.
Each shuffle is a possible version of your future.
If your score holds up across all of them, your edge is probably real. If it swings wildly between runs… yeah, that’s a warning sign, not a bug.
Real Backtest Example
Strategy: DCA (Dollar-Cost Averaging Bot)
Coin: TAO/USDT
Market Condition: Sharp 36% pump followed by a full reversal into a 17% loss — a complete round trip
Objective: Test whether a fixed-step DCA bot could stay net profitable across 140 individual sessions, even as the underlying asset itself round-tripped into negative territory
Key Result: 139 of 140 sessions closed in profit. Only one session, out of the entire run, closed red — even though TAO itself ended the period down 17% from its peak.
Expert Interpretation: This is the same principle the Strategy Engine is built to test, just seen from a different angle. Each of those 140 sessions is effectively one “shuffle” through a different slice of the same volatile period.
If a strategy only worked because of one lucky sequence, you’d expect the win rate to fall apart once conditions changed. Here, the edge held up through the pump, the reversal, and the bleed-back — which is closer to what a high Robustness Score is meant to represent than any single backtest could show on its own.
View Complete Playbook → https://cryptogates.io/playbooks/tao-dca-bot-made-1677-while-spot-holders-lost-17/
Walking Through a Real Strategy Test
Numbers help more than theory here, so let’s actually run one.
Sara’s team pulled a real test from a user profile — a trader named Peter, running a Pro Scalper preset through the Engine.
1. The Inputs — Win Rate, Avg Win/Loss, Capital
Peter set his Win Rate at 68%, with an average win of $150 against an average loss of $120.
Starting capital was $2,000, with a target portfolio of $3,500.
Priya Malhotra, Quant Research Analyst
Position sizing was set to Half Kelly — a conservative sizing model that avoids over-betting on any single trade.
Optimize-for was set to Lowest Fees, and Market Regime stayed on Normal.
2. The Stress Settings Applied
Here’s the part most people skip entirely.
Peter enabled Missed Trades — which simulates exchange downtime or a slow execution — but left Flash Crash Mode off for this run.
He also added a 0.05% slippage tax, a small but real cost that eats into fills over hundreds of simulated trades.
Decoding the Results — What the Numbers Actually Mean
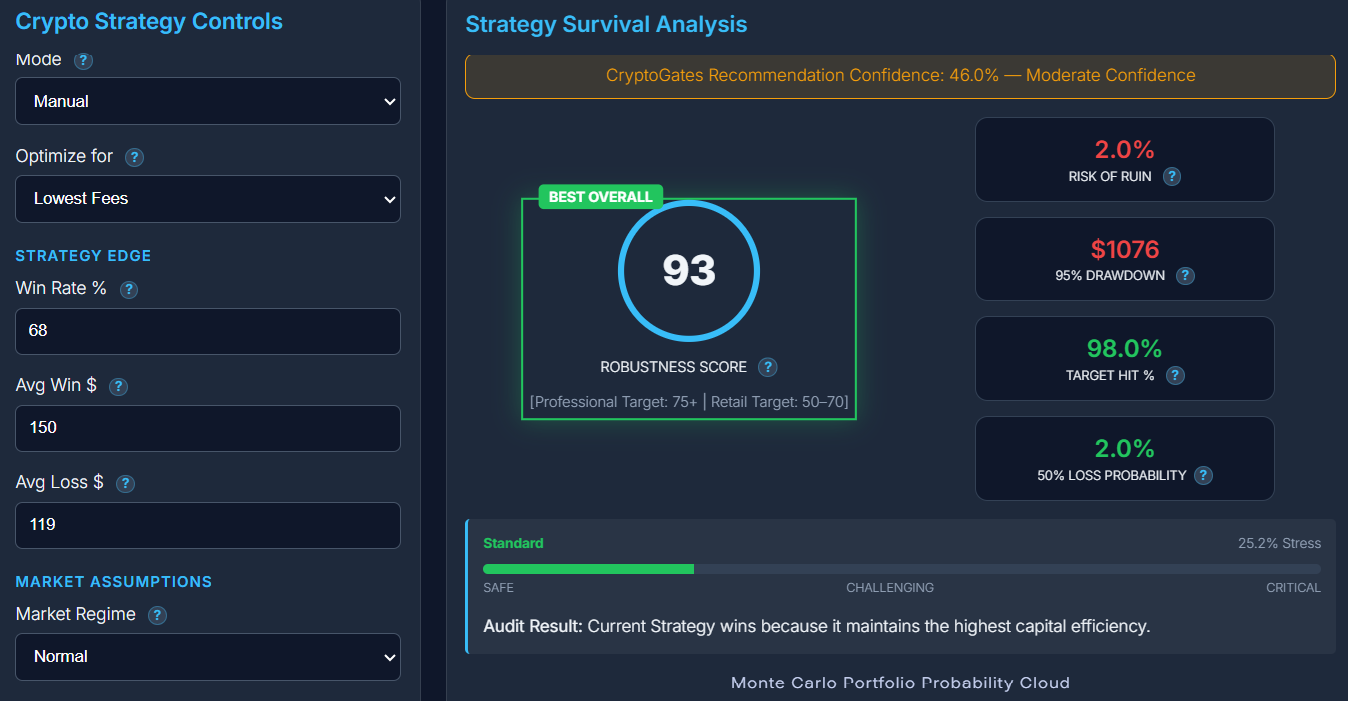 Peter’s test came back with a full set of numbers.
On their own they’re just digits. Together, they tell a story about whether his edge is structural or just a lucky run.

Not by itself. A high win rate combined with a bad risk-reward ratio can still lose money over time.
Robustness Score and Risk of Ruin matter more than win rate alone.
1. Robustness Score — Structural Edge vs. Accident
Peter’s Robustness Score came out at 93.
Honestly, that’s a strong number — CryptoGates treats 75+ as the professional target, meaning the edge held up across most simulated market regimes instead of collapsing under randomness.
A low score here usually means the strategy only worked because history happened to break in its favor.
| Metric | Peter's Result | What It Means |
|---|---|---|
| Robustness Score | 93 | Structural, not accidental |
| Risk of Ruin | 2.0% | Low catastrophic risk |
| Target Hit Probability | 98.0% | High confidence in reaching goal |
2. Risk of Ruin and Drawdown — The Pain Threshold
Peter’s Risk of Ruin sat at just 2.0% – the probability his account hits a catastrophic drawdown before reaching target.
His 95% Probable Drawdown landed at $1,076, meaning in 95% of simulated paths, his loss never went past that dollar figure.
Professional standards flag anything above 1% Risk of Ruin as high risk, so 2% is worth watching but isn’t a dealbreaker on its own.
Reality Check
Common belief: A large max drawdown percentage automatically means a strategy is too dangerous to trust.
What CryptoGates research found: In a live backtest of a DCA bot during one of BTC’s sharpest fortnights of 2025 — a $10,000+ drop in 15 days — the strategy’s max drawdown figure hit 95.87%. Read in isolation, that number looks like a near-total wipeout.
But 10 of 11 sessions in that same test still closed at take-profit, and the bot ended the period net positive.
The scary-looking drawdown reflected one specific stretch of unrealized paper loss on an open position, not the actual outcome of the strategy.
Why it matters: A single stat, taken out of context, can misrepresent risk in either direction — too safe or too dangerous.
That’s exactly why Risk of Ruin and Probable Drawdown are measured across thousands of simulated paths instead of one backtest: a drawdown number only means something once you know how often, and how badly, it actually plays out across the full distribution of outcomes — not just the worst-looking single run.
Playbook:
https://cryptogates.io/playbooks/btc-crashed-8-in-15-days-our-dca-bot-still-made-84/
3. Target Hit Probability and 50% Loss Probability
But there’s a problem worth flagging even in a strong result.
Peter’s Target Hit Probability came in at 98%, which sounds close to perfect.
His 50% Loss Probability sat at 2.0% too — a psychological gut-check number showing how likely he was to lose half his starting capital.
When Target Hit Probability is way higher than Risk of Ruin, that’s usually a sign of a well-built strategy, not just a hopeful one.
Why This Changes How You Trade
Here’s what actually matters after seeing a result like Peter’s.
A 93 Robustness Score doesn’t mean “go all in tomorrow.” It means the strategy earned the right to be tested further – maybe with real capital, maybe with tighter position sizing, maybe with Flash Crash Mode turned on for one more brutal stress check.
Marcus Chen, Risk Management Consultant
From Guessing to Verifying
The simple truth is most traders skip this step entirely. They see one green backtest and jump straight to live trading. CT calls this “ape in” behavior for a reason – no verification, just vibes.
CryptoGates treats 75 and above as a professional target. Scores below that suggest the strategy may be more luck than structural edge.
Wait — that’s kind of the whole point of Verify first. Risk later. Scale slowly. Not a tagline. An actual sequence: test, stress-test, then – only then – automate.
Test Your Own Edge Before You Risk It
One clean backtest was never proof – it just felt like it.
The Strategy Engine takes Peter’s setup, or yours, and runs it through thousands of Monte Carlo scenarios to show whether an edge is real or just a fluke of timing.
A 93 Robustness Score, 2% Risk of Ruin, 98% Target Hit Probability — those numbers only mean something because they survived the shuffle. Or, well, they survived most of the shuffle — no test guarantees the future.
That’s kind of the point.
Run your own numbers. See what the data actually says before you scale anything up.
FAQs
What does a Robustness Score measure in the Strategy Engine?
It measures how consistent a strategy’s performance stays across thousands of simulated market orders. A score of 75 or higher suggests the edge is structural, not accidental.
Why do Strategy Engine results change every time I run it?
Each run performs a fresh Monte Carlo Simulation with a new random sequence. If your score stays stable across runs, the strategy is likely robust.
Is a low Risk of Ruin enough to guarantee profit?
No. Low Risk of Ruin means catastrophic loss is less likely, but it doesn’t guarantee future returns. Always treat results as probabilities, not promises.