

 Bitcoin
  Ethereum
  Solana
  TRON
TRON  Zcash
Zcash  Hyperliquid
  Dogecoin
  Monero
  Chainlink
  Cardano
  Stellar
  Uniswap
  Sui
Sui  Hedera
  Bittensor
  Shiba Inu
  Ripple USD
  Polkadot
  Aster
Aster  World Liberty Financial
  Render
  Artificial Superintelligence Alliance
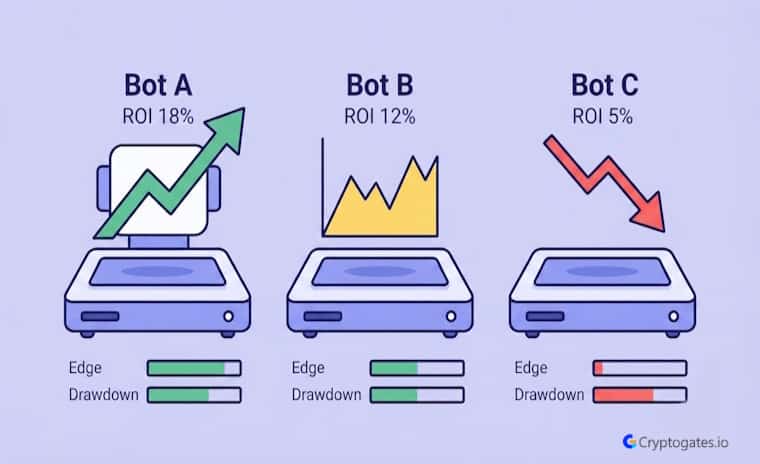
Three strategies.
Three different markets. One question: does any of this actually work, or is it all just theory dressed up as a plan?
We didn’t want to guess.
So we ran real backtests, Grid against DCA, Rebalance against static HODL, and DCA against Lump Sum, each on real historical data.
No cherry-picking, no rounding up. This crypto strategy backtest comparison lays out exactly what happened when four different approaches got tested under real market conditions.

Here’s the thing.
Every strategy has a market where it shines and one where it quietly falls apart. That’s exactly what these three battles expose.
- The Problem: Most traders pick a strategy based on hype or gut feeling, without ever seeing how it performs against a real alternative.
- The Solution: Three head-to-head backtests, Grid vs DCA, Rebalance vs HODL, and DCA vs Lump Sum, using real capital, real data, and no guesswork.
- The Incentive: One battle showed a strategy nearly 40x its opponent's return. The details matter more than the label.
- The Risk: Past backtest performance doesn't guarantee future results, and every strategy here has a market condition where it underperforms.
Why We Ran 3 Different Strategy Battles
Look, anyone can post a screenshot of one winning trade.
That proves nothing. What actually tells you something is putting a strategy next to its closest alternative, same capital, same real market conditions, and watching what happens.

Zaheer puts it simply. If a strategy can't survive being compared to something else, it was never really tested in the first place.
That’s the whole idea behind CryptoGates.
Verify first. Risk later. Scale slowly.
We don’t guess which bot performs better. We run it and show you the numbers, wins, and losses both.
Confused about
market outlook?
Trading without a plan is just gambling. Our strategy architect analyzes your risk tolerance and capital to match you with a proven algorithmic framework.
The Rule We Followed for Every Battle
Honestly, the rule was basic.
The same total-capital logic applies to both sides of each matchup. Same real historical price data. Same exchange fee assumptions.
No adjusting parameters mid-test to force a better outcome. Whatever the bot spit out, that’s what got published.
Battle 1 — Grid Bot vs DCA Bot on BTC
Here’s where things get interesting.
Grid bots are built for sideways, choppy price action. DCA bots are built for patient, staggered accumulation. We tested both on BTC using real backtest runs.
| Metric | Grid Bot | DCA Bot |
|---|---|---|
| ROI | 9.86% | 0.24% |
| Max Drawdown | 7.68% | 48.83% |
| Total Investment | 5,000 USDT | 1,100 USDT |
1. How Each Bot Was Set Up
The Grid bot ran 50 arithmetic grids with a 2% profit target per grid, executing 626 trades total on a 5,000 USDT base. The DCA bot used a 100 USDT base order, 2% step between buys, up to 10 max orders, and a 3% take-profit target, landing at 1,100 USDT total invested across 12 executed orders.
2. What the Results Actually Showed
The Grid bot posted a 9.86% ROI with a max drawdown of just 7.68%. That’s a strong result on both sides, decent returns without the account swinging wildly.
The DCA bot, on the other hand, closed at a thin 0.24% ROI while its max drawdown hit 48.83%. Ouch. That’s a lot of pain for very little reward.
Real Backtest Example
Strategy: Grid Bot
Coin: BTC/USDT
Market Condition: Trending upward (+10.4% monthly move)
Objective: Capture repeated price swings within a defined range
CryptoGates ran a separate Grid Bot backtest on BTC during a similar bullish stretch, where price climbed 10.4% over the month. The bot activated late in the move and still closed with a 7.74% ROI, running lean on fees at just $3.26 total.
It’s a useful counterpoint to the battle above: even when Grid enters a trend late, it can still extract a respectable return — though buy-and-hold outperformed it that month, reinforcing that Grid’s real strength shows up in range-bound conditions rather than sustained trends.
View Complete Playbook: https://cryptogates.io/playbooks/btc-grid-bot-backtest-may-2025/

"Risk management is what separates professional traders from gamblers."
That gap matters.
A bot can technically be “profitable” and still be a rough ride if the drawdown along the way is brutal.
Grid absolutely won this round, both on return and on how smooth the ride was.

The market during this window suited Grid's range-trading logic better, letting it capture repeated small swings. DCA's step-buy structure needs bigger dips to trigger new orders, which didn't happen as often here.
Battle 2 — Rebalance Bot vs Static HODL on TAO/SOL
Sometimes the win isn’t about making money.
It’s about losing less than the other guy. That’s exactly what this battle showed.
We ran a 2% drift rebalance strategy against a static 50/50 HODL position on TAO and SOL through a rough divergence window, 8,000 USDT on the table for both sides.
How Each Approach Handled the Same Drop
The rebalance bot closed at -32.56% ROI. The static HODL position closed at -33.07% ROI.
Neither side made money; both assets dropped hard during this period.
But the rebalance bot preserved a real 0.51% edge over doing nothing at all, purely by trimming the outperforming asset and buying the laggard whenever the 2% drift threshold triggered.
Research Highlight
A pattern shows up consistently across CryptoGates’ rebalance testing: in periods where every asset in the portfolio is falling, the rebalance bot rarely turns a loss into a profit — but it reliably narrows the gap.
In one internal test spanning SOL and ETH during a sharp two-month decline (SOL −32%, ETH −48%), the rebalance strategy closed at −28.73% while a static hold of the same assets closed lower. The edge came entirely from mechanical discipline: trimming the relative outperformer and adding to the laggard at each drift threshold, without trying to predict which asset would recover first.
View Complete Playbook: https://cryptogates.io/playbooks/sol-crashed-32-eth-crashed-48-did-rebalancing-help/

Sheila Warren, blockchain governance expert
That’s basically the entire lesson from this battle. Rebalancing didn’t flip a loss into a win.
It shrank the damage. In a market where both assets are bleeding, shrinking the damage is still a real result.
Battle 3 — DCA Bot vs Lump Sum on ETH
Now flip the script.
This time the market was trending upward, and the question became: Does spreading your entries actually help, or does it just slow you down?
| Metric | DCA Bot | Lump Sum |
|---|---|---|
| ROI | 1.46% | 7.18% |
| Max Drawdown | 50.21% | 9.78% |
| Total Investment | 5,203.90 USDT | 400 USDT |
Spreading Entries vs Going All In
The DCA bot on ETH executed 13 orders across 8 sessions, landing at a 1.46% ROI with a 50.21% max drawdown along the way.
That drawdown number is rough; the account dipped hard before recovering.
The lump sum position, tested as a spot buy and hold benchmark, posted a 7.18% ROI with a much tighter 9.78% max drawdown.
Reality Check
Common belief: Dollar-cost averaging is always the “safer” way to enter a position.
What CryptoGates research found: In a separate BTC test during a 14% monthly rally, a DCA bot closed with zero losing trades — but it still pocketed only $43.54 in profit while a single lump-sum entry would have captured far more of the move.
The staggered buy structure that protects capital during a crash works against the trader once the price is already climbing, since later orders fill at progressively higher levels.
Why it matters: Strategy choice isn’t about which method is inherently “safer” — it’s about whether the entry structure matches the market’s direction at that moment.
View Complete Playbook: https://cryptogates.io/playbooks/btc-rallied-14-in-april-our-dca-bot-still-pocketed-43-with-zero-closed-losses/

"The trend is your friend until it ends." — Nic Carter, crypto analyst
Here’s the issue.
In a market that’s mostly trending up, DCA ends up buying some of its entries at higher prices than a single lump sum entry would’ve captured.
The staggered approach that protects you during a crash can actually work against you during a steady climb.
Not always. DCA reduces risk during volatile drops or crashes, but in steady uptrends it can lead to buying at progressively higher prices and underperforming a single entry.
What 3 Backtest Battles Teach You About Picking a Strategy
The simple truth is there’s no universal winner here. Grid crushed DCA in a choppy market.
Rebalance edged out HODL in a divergent drop. Lump sum beat DCA in a trending climb. Three different winners, three different conditions.
Before You Choose a Strategy
- Is the current market range-bound, trending, or diverging between assets?
- Have you backtested this exact setup on the actual pair you plan to trade?
- Does your risk tolerance match the max drawdown shown in the backtest?
- Are you comparing this strategy against at least one real alternative?
- Would you still be comfortable holding through the worst session in the data?
That’s not a coincidence. That’s the whole point of testing before deploying real capital.
Matching the Strategy to the Market, Not the Other Way Around
Bulls are stepping in during trending markets, and that’s when lump sum or buy-and-hold setups tend to shine.
Choppy, sideways price action is Grid’s territory.
Divergent, rotating narratives favor active rebalancing.
None of these strategies is “better” in isolation.
They’re better or worse depending on what the market is actually doing.
The Takeaway — Verify Before You Deploy
Three battles, three different outcomes, and one consistent lesson.
The strategy that wins depends entirely on what the market is doing, not on which one sounds smartest on Crypto Twitter.
Grid posted the strongest standalone number here, a 9.86% ROI with low drawdown, but that doesn’t make it the right pick for every condition.
Stop Guessing.
Stress Test Your Edge.
The market doesn't care about your backtest. Our engine simulates 1,000+ "what-if" scenarios to ensure your strategy is built for survival.
Run Crypto Strategy Engine →This is exactly why CryptoGates exists.
Verify first. Risk later. Scale slowly.
Every number in this piece came from a real backtest, not a guess dressed up as confidence.
Run your own parameters through the Strategy Picker tool before committing capital to any single approach.
FAQs
Which strategy had the best risk-adjusted return across these three tests?
Grid came out on top here, with a 9.86% ROI against just 7.68% max drawdown on BTC. That’s a strong return for a relatively small amount of risk taken on.
Can these backtest results predict future performance?
No. These numbers reflect how each strategy performed on real historical data during a specific window, not what will happen next. Markets change, and past results are a guide, not a guarantee.
How do I run my own version of these backtests?
Head to the Grid, DCA, or Rebalance Backtest Bot on CryptoGates, plug in your own pair, dates, and capital, and run it. No signup or credit card needed to test your parameters.