

 Bitcoin
  Ethereum
  Solana
  TRON
TRON  Zcash
Zcash  Hyperliquid
  Dogecoin
  Monero
  Chainlink
  Cardano
  Stellar
  Uniswap
  Sui
Sui  Hedera
  Bittensor
  Shiba Inu
  Ripple USD
  Polkadot
  Aster
Aster  World Liberty Financial
  Render
  Artificial Superintelligence Alliance
You spent an hour finding the perfect range.
Support looks clean, resistance keeps rejecting price, and the chart screams chop.
Then you type a number into the grids box, hit run, and honestly, that one number ends up mattering more than the range did.

Source: SEBI
Most traders never stop to ask how many grids to use in grid trading.
They copy whatever a fren posted on CT, or they leave the default and hope. That’s a coin flip dressed up as a strategy.
Same range.Same coin. Same capital.
Change only the grid count, and the results can look like they came from two different bots.
- The Problem: Most grid bot users pick a grid count by guesswork, so a solid range still gives weak or fee-heavy results.
- The Solution: Treat grid density as one testable lever and compare a few values side by side.
- The Incentive: You find the balance between fill frequency and fees before real money is on the line.
- The Risk: Backtests use past data, so a count that fit one range can misfire when volatility shifts.
How Many Grids to Use in Grid Trading: What Grid Density Really Controls
Grid density is just how many buy and sell levels your grid bot places inside your range.
Squeeze more levels in, and each step gets smaller.
Spread fewer levels, and each step gets wider.
| Grid Count | Spacing Between Levels | Order Size Per Level |
|---|---|---|
| Fewer grids | Wider | Larger |
| Moderate grids | Balanced | Balanced |
| Many grids | Tighter | Smaller |
Sounds simple.
It isn’t, because that one choice changes trade frequency, order size, and fee impact all at once.
1. Grid Count vs. Grid Spacing
Think of it like a staircase.
Fewer steps mean each one is tall.
More steps means lots of little ones.
Your bot earns when the price walks up or down those steps, so step size decides how much movement counts as a trade.
Small wiggles trigger fills on a tight grid and slip right past a wide one.
Real Backtest Example
Strategy: Grid bot, three grid counts tested side by side
Coin: NEAR/USDT
Market Condition: 45-day window, same range and capital for every variant
Objective: Isolate grid count as the only variable: 20 vs. 45 vs. 80 grids.
Key Result: The 45-grid setup returned +17.18% ROI and was the only variant to beat buy & hold. Both the sparse 20-grid and dense 80-grid versions trailed it.
Expert Interpretation: Neither extreme won. The sparse grid left fills on the table, and the dense grid gave the edge back somewhere between thinner orders and fees. The middle setting captured enough cycles without over-slicing capital, which is why grid count is worth testing rather than guessing.
20 Grids, 45 Grids, 80 Grids: Only One Beat Buy & Hold on NEAR
Here’s the part beginners miss.
Your capital gets sliced across every level, so tighter spacing also means smaller orders.
More action, thinner slices.
2. Why Sideways Markets Put Density in the Spotlight
In a strong trend, grids get run over.
Price leaves the range, the bot stops doing its job, and you’re a bagholder waiting for a comeback.
Sideways action is different.
Price keeps tagging the same zones, which is exactly what a grid feeds on, since grid trading is designed for prices that fluctuate within a specific range.
Stop Guessing.
Stress Test Your Edge.
The market doesn't care about your backtest. Our engine simulates 1,000+ "what-if" scenarios to ensure your strategy is built for survival.
Run Crypto Strategy Engine →So in chop, density decides how much of that back and forth you actually capture.
Set it too sparse and price can wiggle right through a whole… well, you get the idea.
Set it too tight, and you’re trading noise.
Fair enough, but which mistake costs more?
Let’s break that down next.
Too Few Grids: Missed Fills and Idle Capital
A sparse grid feels calm. Few orders, few trades, not much to watch.
Interactive Checklist
- Price swings back and forth many times without filling a single order
- Long stretches pass with no trades at all
- Each fill pays well, but fills show up rarely
- Most of your capital sits in cash, waiting for a level to get hit
- Your bot lags plain holding even though the range stayed intact
But calm can also mean your money is just sitting there while price does laps around it.
1. Wide Spacing, Fewer Trades, Slower Compounding
Here’s the interesting part.
Each fill on a wide grid usually earns more, and that feels great.
But price has to travel farther to trigger the next order, so smaller swings just pass right through.
Look at a choppy range, and you’ll see price loop through the same zone a dozen times while a sparse grid sits there doing nothing.
Research Insight
Grid bots earn from repetition, and repetition needs a market that keeps revisiting the same zones. Our SUI test showed this clearly.
Strategy: Grid bot
Coin: SUI/USDT
Market Condition: 38 days of volatile chop, with two full crash-and-recover cycles
Objective: See how much back-and-forth movement a grid can capture when price ends the window almost where it started.
Key Result: SUI fell about 7.1%, yet the bot fired 1,759 trades and closed at +7.46% ROI. That beat buy & hold by $861.59.
Expert Interpretation: The range did the heavy lifting. Price kept crossing the same levels, and the grid harvested each pass. Density only pays when the market gives it swings to capture.
SUI Fell 7% in 38 Days: Our Grid Bot Fired 1,759 Trades and Banked +7.46%
Fewer grids mean fewer trades.
Well, usually.
It depends on how choppy the range is. Either way, compounding needs repeated cycles, and fewer cycles tend to mean slower growth.
Total profit can end up lower than a denser setup even when every single trade looked healthy.
2. When a Sparse Grid Still Makes Sense
A smaller account can run into minimum order sizes, and a denser grid may not even be possible.
Higher fee tiers change the math too.
On a calm pair with slow swings, extra levels might never get touched anyway.

There's no single best number. It depends on your range width, volatility, capital, and fees, so test a few grid counts side by side and compare the balance between profit and trading cost.
Sparse also means less to babysit, which suits anyone who’d rather touch grass than stare at charts.
It’s not the villain.
It’s a trade-off, and you should pick it on purpose.
Too Many Grids: Fee Drag and Noise Trading
Dense grids feel productive.
Trades pile up, the log scrolls forever, and it looks like the bot is printing.
Sound familiar?
Source: Barber and Odean, Journal of Finance
But activity isn’t the same as edge.
1. Tiny Orders and Thin Profit per Level
Your capital gets sliced into many small pieces.
Each order is small, and each profit per level is small too.
Fees then take a bite out of both sides of every round trip.
When the profit per level is thin, a fee that looks harmless starts eating a big share of it.
Confused about
market outlook?
Trading without a plan is just gambling. Our strategy architect analyzes your risk tolerance and capital to match you with a proven algorithmic framework.
Honestly, this is the part people skip.
Trade count goes up while net gain per trade goes down.
Degen energy, just with a spreadsheet.
2. Fees and Slippage on Choppy Candles
Choppy candles trigger a dense grid over and over.
Every fill pays a fee, and fast moves can fill at slightly worse prices than planned.
Small leaks, sure.
But they add up like a subscription you forgot to cancel.

Every strategy deserves proof before it deserves capital. I've watched too many people copy a setting and pay tuition to the market. Test first. Scale slowly. Let the data do the talking.
Some of those trades are pure noise, price twitching between two levels for no reason.
Chasing every twitch is FOMO with a bot’s face on.
More trades can easily end in a weaker result than a calmer grid.
How to Find Your Grid Count Before Risking Capital
So where’s the sweet spot?
It moves.
It shifts with the pair, the range, and your fees, which is why copying a setting rarely works.
1. Match Density to Volatility and Range Width
A wide range on a jumpy coin can carry more levels than you’d think, because the swings are big enough to clear fees.
A tight range on a quiet pair usually can’t.
The simple check: each step should cover fees and still leave a real profit.
If it doesn’t, the grid is too tight for that market.
2. Run a Simple A/B/C Backtest, Change Only One Setting
Pick a range.
Lock fees, capital, and grid logic.
Now change only the grid count across three tests: sparse, middle, and dense.
No. More grids means more trades, but fees and thinner orders can eat the extra gains. Past a certain point, added density tends to add cost, not edge.
The Grid Backtest Bot at CryptoGates runs all three on real one-minute candles, so you can compare them side by side with no sign-up.
Then read past the headline return and look at trade count, fees paid, and drawdown.
Grid Density Is a Trade-Off, Not a Setting to Max Out
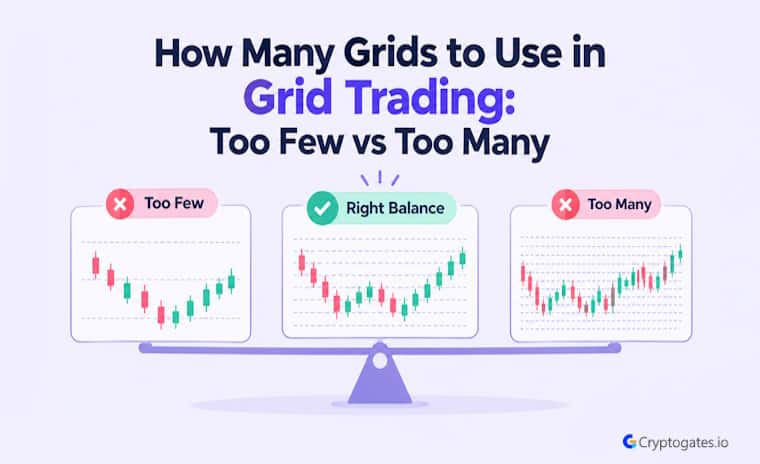
Too few grids miss fills.
Too many bleed to fees and noise.
Working out how many grids to use in grid trading comes down to balancing those two, and the right grid count for a grid bot shifts with every pair and range.
Guessing won’t find it.
Testing will.
This isn’t financial advice, just a process worth following.
Battle-Test Your Strategy
Before the Market Does.
Eliminate guesswork with institutional-grade backtesting for DCA, Grid, and Rebalance bots. Real historical data. Real-world results.
Run your own parameters and see what the data shows in the Grid Backtest Bot.
Want to see a full A/B/C test on a real coin?
The Grid Strategy Playbooks in Strategy Lab break one down.
FAQs
What is a grid trading bot and how does it make money?
It places buy and sell orders at set levels inside a price range. It earns small profits each time price moves between levels and completes a buy and sell pair.
How do fees change the ideal number of grids?
Higher fees widen the gap each level must cover, so they usually push the ideal grid count lower. Make sure every step clears fees with real profit left over.
Can I change my grid count after the bot is running?
Most platforms need you to stop the bot and restart with new settings. Backtest first, so you’re not adjusting with live money.