

 Bitcoin
 Ethereum
 Solana
 TRON
 Zcash
 Hyperliquid
 Dogecoin
 Monero
 Chainlink
 Cardano
 Stellar
 Uniswap
 Sui
 Hedera
 Shiba Inu
 Bittensor
 Ripple USD
 Aster
 Polkadot
 World Liberty Financial
 Render
 Artificial Superintelligence Alliance

Most rebalance bot tests fail before they even start.
Why?
Because people pick two coins that move together, they then act surprised when the bot has nothing to trade against. That’s not a strategy test.
That’s just two charts crashing in sync.
This NEAR BTC rebalancing strategy backtest fixes that mistake.
NEAR spent months grinding out of a bottom while BTC held a calm, range-bound base right next to it.
One leg moved. One leg didn’t. That’s the exact setup a rebalance bot needs to actually prove something.

Bank for International Settlements, 2023 working paper
Here’s the real question we’re chasing.
Does tightening or loosening your coin ratio trigger percentage actually change your returns, or does it just change your fee bill?
- The Problem: Traders assume a tighter rebalance trigger always means more profit, without checking what it costs in fees and overtrading.
- The Solution: Run the same NEAR/BTC pair through three trigger settings, 5%, 1%, and 2%, with everything else held constant.
- The Incentive: See exactly where trigger sensitivity helps, and where it quietly eats your edge.
- The Risk: Past results on this specific pair and window don't guarantee the same outcome on a different asset or a different market regime.
Why NEAR and BTC Made a Better Rebalance Pair This Time
Look, most people testing a rebalance bot pick two coins that are basically cousins. Same sector, same momentum, same crash pattern.
That’s a wasted test. This one’s different.
| Metric | NEAR | BTC |
|---|---|---|
| Behavior | Multi-month recovery trend | Range-bound base |
| Role in Pair | Growth leg | Ballast |
| Starting Price | 1.75 USDT | 95,147.77 USDT |
| Ending Price | 2.39 USDT | 66,328.74 USDT |
NEAR bottomed early and then ran for close to four months straight.
BTC, over that same stretch, mostly chopped sideways in a tight range.
That gap between “one asset trending hard” and “one asset barely moving” is exactly the condition a rebalance bot is built to exploit, the same divergence dynamic our BTC/ETH rebalance bot backtest had to navigate when the two legs split hard in opposite directions.
1. What "Divergent Trend" Means for a Rebalance Bot
In simple terms, a rebalance bot follows the core portfolio rebalancing principle of selling the winner and buying the laggard every time the ratio drifts too far from the target.
If both assets move together, there’s nothing to sell high and buy low.
Divergence is the fuel. Without it, the bot just sits there collecting fees for no reason.
2. The Setup - 4,000 USDT, 50/50 Split, Over a Four-Month Window
Same capital across all three tests. Same 50/50 NEAR/BTC split. Same start and end point.
Same 0.1% exchange fee.
The only thing that changes between Test A, Test B, and Test C is the coin ratio trigger percentage, the same threshold setting covered in CryptoGates’ rebalancing bot guide. That’s the whole point: isolate one variable and let the data speak.
The Single Variable - Coin Ratio Trigger %
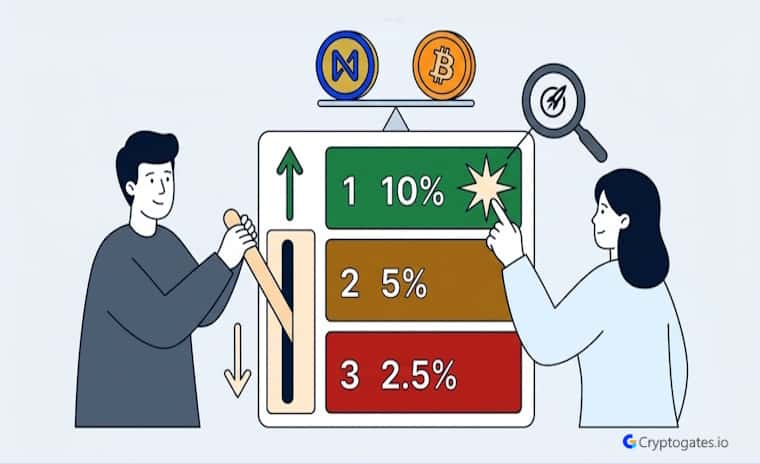
Here’s the setup. Three tests, one pair, one variable. Test A uses a 5% trigger. Test B uses a 1% trigger. Test C uses a 2% trigger.
Interactive Checklist:
- Same 4,000 USDT starting capital across all three tests
- Same NEAR/BTC 50/50 allocation
- Same Binance 0.1% fee structure
- Same January to June window
- Only the coin ratio trigger % changes
Everything else, capital, split, fees, window, stays frozen.
This is the part most backtests skip, and it’s the part that actually matters.
1. Test A - Conservative (5% Trigger)
Test A waits for a 5% drift before it does anything. That means fewer trades. Only 47 rebalances over the whole window. Fewer fees are eating into the account too.
But here’s the issue.
A trigger this loose risks sleeping through NEAR’s early legs, the exact moves that mattered most when the asset was still cheap.
Data Highlight
One pattern emerges across CryptoGates’ parameter-density tests, and it echoes in this NEAR/BTC rebalance trigger comparison: the most aggressive setting is rarely the best-performing one.
Strategy: Grid Bot
Coin: NEAR/USDT
Market Condition: Choppy, range-bound six-week period
Objective: Compare 20, 45, and 80 grid density settings on identical NEAR price action to find whether more grids mean more profit.
Key Result: The 80-grid setup executed 633 trades — nearly double the 362 trades of the 45-grid version – yet returned $5.38 less in profit.
Expert Interpretation: More trade frequency doesn’t compound into more edge once it overshoots the asset’s real swing size; past a certain density, added trades add fee drag. It’s the same mechanism visible in Test B’s 166-trade rebalance run above — activity and performance move independently, not together.
20 Grids, 45 Grids, 80 Grids: Only One Beat Buy & Hold on NEAR
2. Test B - Aggressive (1% Trigger)
Now flip it.
A 1% trigger means the bot fires constantly, chasing every small wobble in the ratio. Sounds smart on paper, more responsiveness, more captured swings.
But wait. This is where things change.
Why Overtrading Hurts Even in a Winning Setup
166 trades.
That’s the number for Test B. Compare that to 47 for Test A and just 8 for Test C. Every single one of those 166 trades pays Binance’s standard 0.1% spot trading fee. Even at 0.1%, that adds up fast when you’re rebalancing almost every other day.
Real Backtest Example
CryptoGates ran the exact same “isolate one variable” methodology on NEAR itself – this time testing DCA step percentage instead of a rebalance trigger, with the same principle: does tighter spacing actually mean more profit, or just more fees?
Strategy: DCA Bot
Coin: NEAR/USDT
Market Condition: Volatile round-trip – NEAR crashed over 30%, then recovered to close nearly flat.
Objective: Test 2%, 3%, and 4% DCA step settings against identical capital and take-profit rules to isolate the effect of step size alone.
Key Result: The 2% step – the tightest, most “responsive” setting – produced the lowest profit of the three at $75.53, while the 3% step landed the best result at $283.23.
Expert Interpretation: The same pattern shows up here as in the rebalance trigger test above — the tightest setting fired too often relative to the asset’s real volatility, spreading capital across shallow moves instead of letting each entry matter. Matching parameter spacing to actual swing depth mattered more than simply increasing responsiveness.
NEAR DCA Bot Backtest: 3% Step Strategy Made $283 in a Flat-But-Wild Market

Not necessarily. A tighter trigger increases trade frequency and fee drag. In this test, the most aggressive 1% trigger actually produced the lowest return of the three variants.
The chart might look active and “engaged,” but activity isn’t the same as performance.
Test B ended with the lowest ROI of the three, 0.96%, proof that a tighter trigger doesn’t automatically mean a better outcome.
The Results - Did Trigger Sensitivity Actually Produce a Profit Difference?
Here’s what the numbers actually showed.
Test A landed 1.33% ROI with 47 trades.
Test B landed 0.96% ROI with 166 trades.
Test C, the middle ground at 2%, landed the best result at 1.07%…
Source: Binance official fee schedule
Wait, actually look closer. Test A beat Test C here too. The “optimized” 2% setting didn’t win outright; it landed in between, which honestly isn’t what most people expect going into a test like this.
1. Reading the Numbers - ROI, Trades, and Fee Impact Side by Side
| Test | Trigger % | Trades | ROI % | Total P&L |
|---|---|---|---|---|
| A (Conservative) | 5% | 47 | 1.33% | 53.09 USDT |
| B (Aggressive) | 1% | 166 | 0.96% | 38.26 USDT |
| C (Optimized) | 2% | 8 | 1.07% | 42.95 USDT |
Trade count and ROI don’t move together in a straight line.
More rebalancing didn’t mean more profit. Less rebalancing, in this specific window, actually came out ahead.
2. The HODL Benchmark Comparison
Here’s the part most Rebalance fans don’t want to hear.
The benchmark HODL strategy over this same window returned 3.01%. Every single rebalance variant, A, B, and C, trailed it. That’s a negative rebalancing edge across the board, meaning active management underperformed just holding the two assets untouched.
Stop Guessing.
Stress Test Your Edge.
The market doesn't care about your backtest. Our engine simulates 1,000+ "what-if" scenarios to ensure your strategy is built for survival.
Run Crypto Strategy Engine →That doesn’t mean rebalancing is useless.
It means this specific divergence pattern, a slow multi-month grind rather than a sharp back-and-forth chop, favors patience over intervention.
What This Test Actually Proves About Trigger Ratio %
The simple truth is that trigger sensitivity matters, but only within a range.
Push it too tight and fees start eating whatever edge the strategy might have had. Loosen it too much, and you risk missing the moves that justified running a bot in the first place.
1. When a Tighter Trigger Makes Sense
A 1% style trigger tends to make more sense in choppier, faster back-and-forth conditions, and on exchanges with lower fees.
If the ratio is swinging hard multiple times a week, catching those swings early can outweigh the fee cost. That wasn’t quite the case here.
2. When a Looser Trigger Wins
A 5% style trigger works better when one asset is on a slow, grinding trend like NEAR was here.
No. In this test, a simple HODL benchmark of 3.01% outperformed all three rebalance variants, which ranged from 0.96% to 1.33% ROI.
Fewer interventions, fewer fees, and the bot isn’t whipsawed by short-term noise along the way.
Verify Your Own Trigger % Before You Automate It
So where does that leave things?
A tighter trigger isn’t automatically better, and a looser one isn’t automatically safer. This test showed a 5% trigger outperforming both a 1% and 2% setting on a slow, trending divergence pair, while the HODL benchmark quietly beat all three anyway, a gap worth checking on your own pair with the Spot Strategy Backtest Bot.
That’s not a reason to abandon rebalancing. It’s a reason to test it on your own pair, your own window, and your own fee structure before trusting a single number.

A trigger percentage that worked on one pair in one market regime isn't a rule. It's a data point. verify first, risk later, scale slowly.
Run your own parameters and see what the data shows on the Rebalance Strategy Backtest Bot before you automate anything with real capital.
Battle-Test Your Strategy
Before the Market Does.
Eliminate guesswork with institutional-grade backtesting for DCA, Grid, and Rebalance bots. Real historical data. Real-world results.
FAQs
What is coin ratio trigger percentage in a rebalance bot?
It’s the drift threshold that tells the bot when to act. Once your asset ratio moves past that percentage, the bot sells the winner and buys the laggard to restore balance.
Is a lower trigger percentage always more profitable?
Not based on this test. A 1% trigger produced 166 trades and the lowest ROI, while a 5% trigger with fewer trades landed the highest ROI in the same window.
Does rebalancing beat just holding BTC and NEAR separately?
Not in this specific case. The HODL benchmark returned 3.01%, ahead of all three rebalance variants tested here.