

 Bitcoin
  Ethereum
  Solana
  TRON
TRON  Zcash
Zcash  Hyperliquid
  Dogecoin
  Monero
  Chainlink
  Cardano
  Stellar
  Uniswap
  Sui
Sui  Hedera
  Bittensor
  Shiba Inu
  Ripple USD
  Polkadot
  Aster
Aster  World Liberty Financial
  Render
  Artificial Superintelligence Alliance
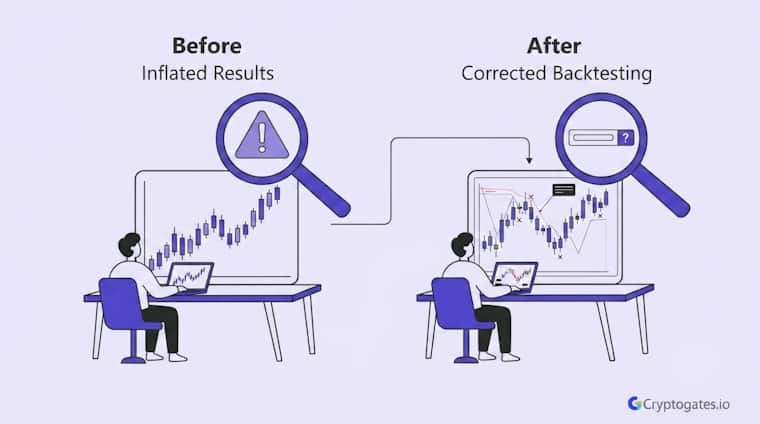
Ngl, this happens to almost every trader at some point, and it tracks with why 97% of day traders lose money within their first year of trading.
You build a strategy, run the numbers, and the backtest looks clean—green curve, solid win rate, decent drawdown.
Then you go live, and it just doesn’t hold up.
Here’s the uncomfortable part: it’s usually not the strategy.

(Source: Blockchain Council / Vantixs research)
These common backtesting mistakes hide inside the testing process itself, quietly inflating results until real capital exposes them.
This piece breaks down the 12 mistakes that cause this gap, one by one, with what actually causes each one and how to fix it before you risk anything.
- The Problem: Most crypto backtests get quietly wrecked by a handful of repeatable, avoidable mistakes.
- The Solution: Know exactly what each mistake looks like and fix it at the source, not after you've already lost money.
- The Incentive: A backtest that survives all 12 checks actually means something before you risk real capital.
- The Risk: Miss even one of these and your "proven" strategy might just be an illusion built on bad testing.
Why Backtesting Mistakes Are So Easy To Miss
Here’s the thing nobody tells you upfront.
A backtest doesn’t need to be wrong to look right. It just needs to hide its flaws well enough for the equity curve to still climb.
That’s exactly why so many traders get blindsided.
They’re not being careless; they’re just trusting a number that was never built on solid ground in the first place.
A Good-Looking Backtest Isn't The Same As A True One
Passing the eye test and passing a real audit are two very different things.
A chart with a smooth upward curve feels convincing.
But convincing isn’t the same as correct.

Zaheer puts it simply. "A backtest that can't survive being questioned isn't proof, it's just a nice-looking chart." Verify first, risk later.
The only way to know if a backtest is actually trustworthy is to check it against the specific mistakes that commonly sneak in, which is exactly what the rest of this guide walks through.

Usually because the backtest hid one or more of the common mistakes below, like ignored fees, curve fitting, or survivorship bias, that inflate results without you realizing it.
The 12 Common Backtesting Mistakes
Alright, let’s get into it.
Each one of these mistakes does the same basic thing: it makes a backtest look better than reality would ever allow. Some are about bad data.
Quick Gut Check Before You Trust a Backtest
- Did you check for missing or incomplete candles?
- Did you include real trading fees and slippage?
- Did you test the strategy on more than one coin?
- Did you validate it on data the strategy never saw?
- Did you check for look-ahead or survivorship bias?
Some are about bias baked into the process.
Others are just human nature showing up where a spreadsheet can’t see it. Here’s each one, what actually causes it, and how to fix it.
1. Using Poor Or Incomplete Data
This one sounds basic, but it wrecks more backtests than people realize.
Missing candles, wrong prices, or gaps in the historical feed create signals that never actually existed in the real market.
A moving average crossover that “triggered” on a data error isn’t a real signal; it’s noise dressed up as an edge.
Research Insight
Sample size is one of the quietest ways a backtest lies to you.
A strategy that looks solid over 10 sessions can fall apart once tested across 100+. In one of our internal DCA tests on a mid-cap asset that round-tripped through a sharp pump and an equally sharp bleed, 139 of 140 sessions still closed in profit.
That kind of consistency only becomes meaningful at scale — a 10-session sample would have told a completely different, and far less reliable, story. This is exactly why thin sample sizes make the “mistakes” list: a strategy needs volume across market phases before its edge can be trusted, not just a clean-looking curve over a short window.
Expert Interpretation: A result that holds across hundreds of sessions and multiple price regimes is structural. A result that only holds across a dozen sessions is a coincidence wearing a strategy’s clothes.
The fix is simpler than it sounds: source data from a reputable exchange feed, check for gaps before running anything, and cross-reference a sample of candles against a second source if the strategy is going to trade on tight timeframes.
CryptoGates runs backtests on real 1-minute OHLCV data across major exchanges specifically to avoid this trap. Clean data isn’t glamorous, but it’s the floor everything else is built on.
2. Ignoring Fees And Slippage
This mistake is sneaky because it’s invisible until you add it back in.
A strategy that trades often can look amazing with zero costs baked in, then bleed out the moment maker and taker fees, funding rates, and realistic slippage get factored into every trade.
Battle-Test Your Strategy
Before the Market Does.
Eliminate guesswork with institutional-grade backtesting for DCA, Grid, and Rebalance bots. Real historical data. Real-world results.
Fix it by modeling real costs from day one, not as an afterthought.
Include exchange fee tiers, expected slippage on the pairs you’re trading, and funding costs if the strategy touches futures.
A strategy that still profits after all of that is a strategy worth taking seriously. One that only works with zero fees was never really working.
3. Over-Optimizing The Strategy (Curve Fitting)
Curve fitting happens when you tweak the RSI, then the stop-loss, then the entry filter, over and over, chasing a better-looking backtest.
Eventually the strategy fits the past data almost perfectly.
But there’s a problem. It didn’t learn a real pattern; it memorized noise.
A mathematician named John von Neumann joked that with enough parameters you can make a model fit almost any shape, even something as ridiculous as an elephant.
Backtesting has the same trap.
Real Backtest Example
Strategy: Grid Bot
Coin: BTC/USDT
Market Condition: Moderate bull run, +10.4% over the month
Objective: Test whether fees and execution costs meaningfully erode grid profit in a live-like environment
Key Result: The bot returned +7.74% ROI while total fees across the entire run came to just $3.26 — a number small enough to ignore, until you multiply it across dozens of strategies run without cost modeling
Expert Interpretation: This is the exact gap the article’s Mistake #2 (ignored fees) points at. On paper, fees look negligible. At scale, across hundreds of untested runs, unmodeled costs are one of the fastest ways a “profitable” backtest quietly turns unprofitable the moment it goes live.
The fix is discipline.
Keep parameters few; stacking more than 3 to 4 indicators rarely improves real performance and mostly just lets the strategy curve-fit history more tightly.
If a strategy needs a dozen conditions to look good, it’s probably not an edge at all.
4. Look-Ahead Bias
Look-ahead bias sneaks in when a backtest accidentally uses information that wouldn’t have been available at the actual moment of the trade.
The classic version is the candle-close trap.
A signal confirms only after a candle closes, but the backtest lets the strategy enter right at that same close, as if it knew the candle was about to finish that way.
Repainting indicators cause the same issue, showing a beautiful historical signal that was never actually visible in real time.
Stop Guessing.
Stress Test Your Edge.
The market doesn't care about your backtest. Our engine simulates 1,000+ "what-if" scenarios to ensure your strategy is built for survival.
Run Crypto Strategy Engine →The fix is to process data strictly in sequence and assume entry only on the next candle open, or the next realistic tradable price, never the same bar a signal is confirmed on.
It feels like a small detail. It isn’t.
This single mistake alone can turn an average strategy into a fake superstar on paper.
5. Survivorship Bias
This one is sneaky in a different way.
It happens when a backtest only includes coins that are still around today, quietly ignoring the ones that got delisted, lost liquidity, or straight-up rugged. Crypto has thousands of dead coins.
Testing an altcoin strategy only on today’s winners, like ignoring the fact that projects like Bitconnect once looked promising before collapsing, makes the whole approach look far cleaner than it really was.
Reality Check
Common belief: If a strategy backtest shows a profit, the underlying logic is sound.
What CryptoGates research found: In one rebalance test run across a violent, one-sided BTC/ETH divergence, we tested three parameter variants of the same strategy. Two of the three lost money. Only one survived — and it did so mainly by barely rebalancing at all. Same strategy, same data window, three very different outcomes depending on parameter choice alone.
Why it matters: This is curve fitting’s blind spot in miniature. A single backtest run proving profitable tells you almost nothing about whether the edge is real or just a lucky parameter combination for that specific window. Testing multiple variants against the same data, the way Monte Carlo simulation does at scale, is what actually separates a structural edge from a coincidence.
One Asset Soared. One Collapsed. Our Rebalance Bot Picked the Wrong Side 249 Times
Fix it by including delisted and failed assets in your testing universe wherever the data allows, not just the survivors.
If a strategy is being tested on “today’s top 20 coins,” ask yourself how many of those existed and looked healthy three years ago too.
That’s the real test.
6. Testing On Too Few Coins
A strategy that crushes it on BTC alone might completely fall apart the moment you run it on ETH, or some random mid-cap altcoin.
Testing on one or two assets gives a narrow, flattering picture that has nothing to do with how the strategy performs broadly.
Confused about
market outlook?
Trading without a plan is just gambling. Our strategy architect analyzes your risk tolerance and capital to match you with a proven algorithmic framework.
The fix here is straightforward.
Run the same rules across a wider basket of coins, ideally ones with different volatility profiles and market caps, and see if the edge actually holds.
If it only works on one coin, that’s not a strategy. That’s a coincidence wearing a strategy’s clothes.
7. Testing Only One Market Condition
Here’s what most beginners miss completely.
A strategy built and tested only during a bull run can look unstoppable, right up until the market turns sideways or drops into a bear phase.
Market regime changes everything. Grid strategies, for example, tend to shine in choppy, range-bound markets and struggle badly in strong trends, while trend-following setups do the opposite.
Data Highlight
One pattern shows up consistently across our Playbook archive: a strategy’s paper performance and its real, cost-adjusted performance are not the same number, and the gap tends to widen the more volatile the asset.
In a 44-day SOL grid test through a high-volatility downtrend, the bot returned +9.27% ROI — a solid number, but only after fees, slippage, and execution timing were factored into the raw grid activity.
Strip those variables out and the “theoretical” number looks meaningfully better than what actually lands in the account.
This is the practical version of the article’s data quality and cost-modeling mistakes: the difference between a backtest that describes what could happen and one that describes what would actually happen.
The fix is to run the strategy across bullish, bearish, and sideways periods separately, not just one long combined test. If the results only hold up in one condition, that’s valuable information too.
It just means the strategy needs a regime filter, not blind trust across every market phase.
8. Too Few Trades (Small Sample Size)
This mistake is about math, not strategy logic.
A backtest with fewer than 30 trades is statistically close to meaningless; you genuinely can’t tell skill from luck at that size.
Somewhere between 30 and 100 trades starts becoming directionally useful, but real confidence usually needs 100 to 300 trades before treating the results as evidence of a genuine edge.
Proven Setups &
Expert Breakdowns.
We don't just show you the data; we engineer and validate high-performance strategies, providing the "Alpha" behind the numbers.
Fix it by extending the test period or widening the asset pool until the trade count is large enough to trust.
A strategy that only fired 12 times over a year hasn’t proven anything yet, good or bad. It just hasn’t been tested enough to know.
9. Not Using Out-Of-Sample Validation
Testing and validating a strategy on the same data is a bit like grading your own exam with the answer key already memorized.
Of course it looks good.
This is one of the most common reasons a backtest feels bulletproof and then completely falls apart live.
Expert Observation
After reviewing grid Playbooks across bull runs, crashes, and sideways chop, one pattern keeps repeating: the strategy itself is rarely the reason a result disappoints. In a 79-day BNB test through a 33% post-ATH crash, the bot generated real grid profit — $163.94 worth of executed trades — and still finished at −21.64% ROI overall. The mechanics worked exactly as designed. The market condition simply didn’t cooperate with the range the bot was set to. That distinction, gross activity profit versus net account result, is the same trap that inflates a lot of backtests: activity gets mistaken for performance, and a bad market fit gets mistaken for a broken strategy.
BNB Crashed 33% After Its ATH — Our Grid Bot Lost Less, But Still Lost
The fix is to hold back a chunk of historical data the strategy never touches during development, then test on that unseen portion once the rules are locked in.
If performance holds up on data the strategy has never “seen” before, that’s a real signal.
If it falls apart, the original result was probably just curve fitting in disguise.
10. Using Unrealistic Position Sizing
Sizing every trade for maximum theoretical profit makes a backtest look incredible on paper and sets up real accounts to blow up fast.
It’s an easy trap because bigger position sizes just make every winning trade look more impressive in the results table.
Confused about
market outlook?
Trading without a plan is just gambling. Our strategy architect analyzes your risk tolerance and capital to match you with a proven algorithmic framework.
The fix is matching backtest sizing to what you’d actually be comfortable risking with real money.
If the strategy only looks good at 20% risk per trade, that’s not really a workable strategy; that’s a warning sign.
Size for the account you actually have, not the one you wish you had.
11. Ignoring Stop-Loss And Take-Profit Logic
Entries get all the attention in most strategy discussions.
Exits are what actually decide whether you walk away profitable.
A strategy with a sharp entry signal and a sloppy, undefined exit plan can turn a genuinely good idea into a losing one without the entry logic ever being at fault.
Neutralize Volatility.
Own the Growth.
Access systematic playbooks designed to eliminate emotional bias. From Spot HODL frameworks to advanced Grid simulators.
The fix is treating exit rules with the same seriousness as entries.
Define stop-loss and take-profit levels clearly, test them as part of the strategy rather than an afterthought, and check how sensitive the results are to small changes in those exit levels.
If tiny tweaks to the exit completely flip the outcome, the strategy is more fragile than it looks.
12. Forgetting Emotional And Execution Limits
Unfortunately, this is the one mistake no backtest can ever fully capture.
Live trading brings hesitation before clicking a button, fat-fingered orders, missed entries because you were away from the screen, and the very human urge to override your own rules mid-trade.
A backtest assumes perfect, robotic discipline every single time. You’re not a robot, ser.
Look-ahead bias means using information that wasn't available at the time of the trade. Survivorship bias means only testing on assets that are still around today, ignoring the ones that failed or got delisted.
The fix isn’t technical; it’s behavioral.
Paper-trade the strategy first to feel out the emotional side before real capital is involved, and build in simple rules for what happens if you miss an entry or exit late.
A strategy is only as good as your ability to actually follow it under pressure.
How CryptoGates Helps You Avoid These Mistakes
Honestly, catching all 12 of these manually is a lot to track for every single strategy idea.
Clean data, real fees, bias checks, multiple coins, multiple market phases- that’s a genuinely tedious workflow to build from scratch each time.
| Mistake Category | What CryptoGates Handles |
|---|---|
| Data Quality | Clean 1-minute OHLCV data across major exchanges |
| Trading Costs | Fees and slippage built into every backtest |
| Sample Size | Multi-coin, multi-period testing in minutes |
CryptoGates’ backtesting bots handle the data quality and cost modeling side automatically, running your DCA, Grid, or Rebalance strategy against real historical OHLCV data with fees and slippage already factored in.
That removes mistakes 1, 2, and 10 almost entirely, following the same crypto backtesting methodology CryptoGates uses to validate every DCA, Grid, and Rebalance strategy before it goes live
Knowledge Check
Your strategy shows a 95% win rate in backtesting, but you forgot to include trading fees and slippage. What's the biggest risk?
The Crypto Strategy Engine goes a step further, running thousands of “what-if” scenarios through Monte Carlo simulation so a stable result actually means the edge is structural, not a lucky sequence hiding curve fitting or bias underneath.
Final Takeaway
Here’s the truth.
None of these 12 mistakes are complicated once you know what to look for.
Bad data, ignored costs, curve fitting, look-ahead and survivorship bias, thin sample sizes, single market conditions, weak validation, unrealistic sizing, sloppy exits, and the human execution gap.
That’s the full list standing between a backtest that lies to you and one you can actually trust.
Fix the process, and the strategy either proves itself, or it doesn’t; honestly, either way you come out ahead.
Test this setup yourself. Backtest before risking capital, not after.
FAQs
What is the most common backtesting mistake in crypto trading?
Over-optimizing the strategy, also called curve fitting, is probably the most damaging one. It makes a backtest look flawless while quietly destroying any real, repeatable edge.
How many trades do you need for a backtest to be reliable?
Most traders need at least 100 to 300 trades before treating results as real evidence of an edge. Anything under 30 trades is close to statistically meaningless.
Can survivorship bias really change backtest results that much?
Yes. Testing only coins that are still active today ignores every delisted or rugged project, which can make a strategy look far more profitable than it would have actually been.