

 Bitcoin
  Ethereum
  Solana
  TRON
TRON  Zcash
Zcash  Hyperliquid
  Dogecoin
  Monero
  Chainlink
  Cardano
  Stellar
  Uniswap
  Sui
Sui  Hedera
  Bittensor
  Shiba Inu
  Ripple USD
  Polkadot
  Aster
Aster  World Liberty Financial
  Render
  Artificial Superintelligence Alliance
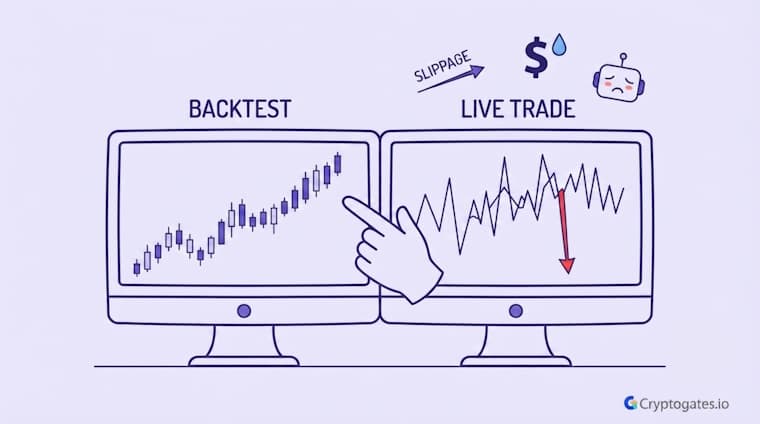
Backtesting looks perfect until real money enters the chart.
The moment slippage, liquidity, and your own emotions show up, that clean equity curve starts telling a different story.
This blog breaks down exactly why backtesting vs live trading results diverge, and how to read your backtest data the right way before you risk a single dollar.
- The Problem: Traders trust a clean backtest, then get blindsided when live results look nothing like it.
- The Solution: Understand exactly what causes the gap—slippage, liquidity, execution delays, and emotions—so you can interpret backtest results realistically.
- The Incentive: Traders who evaluate backtests correctly avoid chasing strategies that were never designed to survive real market conditions.
- The Risk: Treating a backtest as a promise instead of a decision-making filter can lead to overconfidence and costly losses once live trading begins.
What Backtesting Actually Measures
Look, you ran the backtest.
Numbers looked great. Green across the board, clean equity curve, the kind of chart that makes you want to size up immediately.
Then you went live. And it felt like a completely different strategy.

Source: Financial Analysts Journal
Ser, that gap between backtesting vs live trading isn’t a glitch.
It’s structural.
Backtesting works by replaying historical price data through your strategy’s logic, a process laid out in full in CryptoGates‘ crypto backtesting methodology, under conditions that are, honestly, way cleaner than anything you’ll experience with real capital on the line.
Battle-Test Your Strategy
Before the Market Does.
Eliminate guesswork with institutional-grade backtesting for DCA, Grid, and Rebalance bots. Real historical data. Real-world results.
That stat alone should change how you read every backtest you run.
Why Historical Data Behaves Differently Than Live Markets
Here’s the thing about historical candles.
They’re fixed. Known.
Every wick already happened, every volume spike already printed. Your strategy gets to react to data that’s already settled into place.
Live markets don’t work that way. Price is still forming. Liquidity is still moving. The order book you’re staring at right now could look completely different in the next four seconds.
Real Backtest Example
Strategy: Grid
Coin: BNB
Market Condition: Post-ATH correction, -33% over 79 days
Objective: Measure how much of a grid bot’s trading activity converts into actual portfolio return during a sustained downtrend
Key Result: The bot executed 171 trades and generated $163.94 in gross grid profit — yet total portfolio ROI still closed at -21.64%.
Expert Interpretation: Grid profit and portfolio ROI are two different numbers, and conflating them is one of the most common backtest-reading mistakes. A bot can execute flawlessly, hit every fill, and still finish deeply negative if price closes below the range floor. That gap — clean execution on paper, real loss in the account — is exactly the kind of divergence a backtest can’t warn you about in advance.
View Complete Playbook: BNB Crashed 33% After Its ATH — Our Grid Bot Lost Less, But Still Lost
That’s not a small distinction.
It’s the whole reason backtest vs live trading results diverge in the first place. A backtest never has to guess. Live trading always does.
This is where things change for most beginners.
They treat a backtest as a preview of the future instead of what it actually is — a controlled test of logic against the past.
CryptoGates built its DCA Backtest Bot, Grid Backtest Bot, and Rebalance Backtest Bot specifically so traders could run that logic test on real historical candles before ever touching live capital.
Verify first. Risk later. That’s the whole point.

Mark Douglas, trading psychologist
Honestly, that rhyme is exactly what makes backtesting useful and dangerous at the same time.
Useful because patterns in market behavior do tend to repeat in structure.
Dangerous because traders start expecting exact repetition instead of rough resemblance.
The Real Reasons Results Diverge
Alright, let’s break this down.
Backtesting vs live trading isn’t just about “the market changed.” There are specific, mechanical reasons your results shift once real money enters the picture.

Zaheer here. I've seen traders get frustrated when live results don't match a backtest, but the backtest was never meant to predict the future. It's meant to filter out strategies that were already broken. That's the whole value.
Slippage is the big one.
Fees eat into returns in ways that are easy to underestimate on paper. Latency means your order doesn’t execute the instant you think it does.
And emotion, well, emotion doesn’t exist in a backtest at all. Your backtest never panicked and closed a position early.
You might.
| Factor | In Backtest | In Live Trading |
|---|---|---|
| Order Fill Price | Exact price you wanted | Slippage changes the fill price |
| Liquidity | Assumed always available | Can disappear during execution |
| Emotion | No emotional influence | Fear and greed affect decisions |
| Trading Fees | Often simplified or fixed | Real fees compound over time |
1. Slippage and Execution Delay
In a backtest, your order fills at the price you wanted. Clean, instant, exact. Live trading doesn’t offer that courtesy.
By the time your order reaches the exchange, price may have already moved.
That gap between expected and actual fill price is what’s known as slippage, and it compounds over hundreds of trades.
A strategy that looks profitable on a backtest can turn flat, or worse, once execution delay gets factored in.
2. Liquidity and Order Book Reality
Here’s an issue a lot of beginners miss. Backtests often assume you can buy or sell at a given price with zero friction. Real order books don’t work like that.
Source: DefiLlama
If liquidity thins out at the exact moment your strategy wants to execute, you get a worse fill than the backtest ever showed you. This is especially true on lower cap pairs where the order book is thin.
Grid and Rebalance strategies feel this more than most, since they rely on frequent execution across price levels.

No. A strong backtest means the logic held up historically. It doesn't account for slippage, liquidity gaps, or your own behavior once real capital is at risk.
How to Read Backtest Results the Right Way
Wait, before we go further, here’s a mindset shift that matters more than any indicator. A backtest isn’t a promise. It’s a filter.
Treat it like one. Its job is to weed out strategies that were never going to work in the first place.
If your strategy can’t survive a clean historical test, it definitely won’t survive live conditions with slippage, fees, and your own emotions stacked on top.
Before You Trust a Backtest
- Include realistic slippage and trading fee assumptions.
- Verify the strategy performs across multiple coins or timeframes.
- Look for a realistic drawdown instead of a perfectly smooth equity curve.
- Test the strategy during highly volatile market conditions.
- Ask whether you would trust the strategy without seeing the backtest chart.
1. Signs a Strategy Is Overfit to the Past
This is where things get interesting.
A strategy that performs suspiciously well on a backtest, like unrealistically well, is often overfit.
That means it’s been tuned so tightly to past price action that it basically memorized the test instead of learning a repeatable edge.
Research Highlight
A pattern shows up repeatedly across CryptoGates Grid Playbooks: the strategies that trade most frequently across tight price levels are also the ones most exposed to order book thinning.
In one backtest, a grid bot fired 1,759 trades across a single pair in just 38 days — a trade frequency that assumes liquidity is sitting there at nearly every level, every single time.
In live markets, that assumption is usually the first one to break, and it breaks fastest on pairs outside the top few by volume.
View Complete Playbook: SUI Fell 7% in 38 Days — Our Grid Bot Fired 1,759 Trades and Banked +7.46%
Signs of overfitting: too many parameters, results that only work on one specific coin or timeframe, and drawdowns that look nonexistent.
Real markets don’t produce zero-drawdown strategies. If your backtest shows that, something’s off.
2. What is overfitting in a crypto trading strategy?
Backtesting vs live trading will always show some gap.
That’s not a flaw; it’s just reality.
Slippage, liquidity, execution delay, and your own behavior all show up once real capital is involved, no matter how clean the backtest looked.
Stop Guessing.
Stress Test Your Edge.
The market doesn't care about your backtest. Our engine simulates 1,000+ "what-if" scenarios to ensure your strategy is built for survival.
Run Crypto Strategy Engine →Ser, the point was never to eliminate that gap.
It’s to narrow it enough that you’re trading a strategy with real, tested logic instead of a guess dressed up as a plan.
Backtesting filters out the bad ideas.
Live discipline decides what happens with the good ones. Run your own parameters on the DCA Backtest Bot, Grid Backtest Bot, or Rebalance Backtest Bot and see what the data actually shows before you risk anything live.
FAQs
Why does live trading perform worse than backtesting?
Live trading adds slippage, fees, execution delay, and emotional decisions that a backtest never has to deal with. Historical data is fixed, live markets aren’t.
Can backtest results ever fully match live trading?
Not exactly, no. You can get close with realistic slippage and fee assumptions, but live execution always carries some unpredictability a backtest can’t fully simulate.
How much difference between backtest and live results is normal?
A small gap is expected and healthy. A massive gap usually points to overfitting, unrealistic backtest assumptions, or execution issues worth investigating.