

 Bitcoin
  Ethereum
  Solana
  TRON
TRON  Zcash
Zcash  Hyperliquid
  Dogecoin
  Monero
  Chainlink
  Cardano
  Stellar
  Uniswap
  Sui
Sui  Hedera
  Bittensor
  Shiba Inu
  Ripple USD
  Polkadot
  Aster
Aster  World Liberty Financial
  Render
  Artificial Superintelligence Alliance
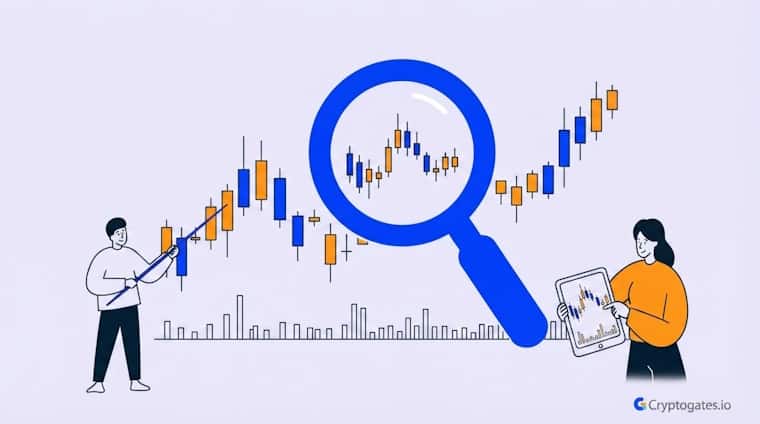
You hit “run backtest,” watch the numbers load, and trust whatever comes out.
Ser, have you ever actually asked what’s feeding that result?

(Source: Journal of Financial Data Science)
Every strategy score, every Robustness number, every Risk of Ruin percentage traces back to one thing: OHLCV data.
Get the resolution wrong, and your entire backtest is just an expensive guess wearing a lab coat.
Most beginners skip this part completely.
That’s exactly why so many “profitable” backtests fall apart the moment real capital touches them.
- The Problem: Most traders don't know what data actually powers their backtest results, so they trust numbers built on shaky ground.
- The Solution: OHLCV data, especially at 1-minute resolution, gives you the full picture of price action instead of a rounded summary.
- The Incentive: Understanding this helps you read Strategy Engine results with real confidence instead of blind faith.
- The Risk: Trusting a backtest built on low-resolution candles can hide slippage, fake breakouts, and wicks that would've wrecked a live account.
What Is OHLCV Data, Really?
OHLCV isn’t some complicated quant term.
It’s just five numbers stacked on top of each other. Open. High. Low. Close. Volume.
Every single candlestick you see on a chart, no matter the timeframe, is built from these five data points.
Once you get this, charts stop looking like random shapes and start looking like a story.
| Letter | What It Means | Why It Matters |
|---|---|---|
| O | Opening price of the candle | Shows where the period started |
| H | Highest price reached | Reveals buyer strength |
| L | Lowest price reached | Reveals seller pressure |
| C | Closing price of the candle | Shows who won the period |
| V | Volume traded | Confirms if the move is real |
1. Open, High, Low, Close Explained
Think of it like this.
The open is where a fight starts. The high and low are how far each side pushed before the bell.
The close is who’s standing at the end. imo this is the part most beginners actually understand fine. It’s the fifth letter that trips people up.
2. Volume - The Ignored Fifth Metric
Here’s the thing.
Price without volume is just a rumor. A big green candle on low volume?
Could be nothing.
Could be a trap.
But a big green candle backed by heavy volume- that’s smart money showing up. Volume is what separates a real breakout from a fakeout that’s about to reverse and rug the late buyers.
Research Insight
Many traders treat a big price move as proof enough that something real is happening. But price alone can’t confirm intent; volume can.
A 2025 DOGE stress test shows why that distinction matters at the data layer, not just the chart layer.
Strategy: DCA Bot
Coin: DOGE/USDT
Market Condition: 34.4% price collapse over 60 days, driven by concentrated whale-sized activity
Objective: Observe how a bot performs when a crash is backed by real volume rather than thin, low-liquidity noise
Key Result: 13 of 14 sessions closed in profit, including a single 10-order session that deployed $10,491 and still returned $298.54 mid-collapse
Expert Interpretation: Volume-confirmed moves behave differently than volume-thin noise, even when the percentage drop looks identical on a chart. A backtest built on coarse candles can’t tell the two apart, which is exactly why the volume column exists as a fifth data point and not an optional extra.
View Complete Playbook: DOGE Crashed 34% in 60 Days, Our DCA Bot Made +$924.23 Anyway
Why Candle Timeframes Change Everything
A 1-day candle and a 1-minute candle are technically the same five data points.
But they tell wildly different stories. Zoom out too far, and you lose the fight entirely. You only see who won, not how brutal the battle actually was.
Battle-Test Your Strategy
Before the Market Does.
Eliminate guesswork with institutional-grade backtesting for DCA, Grid, and Rebalance bots. Real historical data. Real-world results.
Here’s the interesting part.
Two assets can have the same daily candle, same open, same close, same everything on paper. But one of them drifted there calmly.
The other one spiked 8% up, got rejected hard, dumped 6%, then crawled back.
Same close. Completely different risk.
What Gets Lost in Bigger Candles
Daily candles hide intraday traps.
That sharp wick that would’ve stopped out a real position?
Gone, smoothed into a single line. That fake breakout that baited retail before reversing?
Invisible on a daily chart.
This is where things change for anyone actually trying to test a strategy seriously using a proper Crypto Backtesting Guide, not just eyeball a chart.
Real Backtest Example
Most backtests report a single drawdown figure and move on, but that number only makes sense once you know what resolution captured it.
A 15-day BTC stress window from 2025 illustrates this well.
Strategy: DCA Bot
Coin: BTC/USDT
Market Condition: Sharp 15-day decline, BTC shedding over $10,000
Objective: Test bot resilience through a fast, non-gradual capitulation
Key Result: 10 of 11 sessions closed at take-profit, yet the session logged a 95.87% intraday max drawdown reading
Expert Interpretation: That drawdown number only becomes readable once you know it was measured against the deepest intraday wick, not a rounded daily close. On lower-resolution data, that same crash would have shown up as a smooth, forgiving line, and the strategy would look far safer on paper than it actually behaved in real time.
View Complete Playbook: We Ran a DCA Bot Through BTC’s Worst Fortnight of 2025

OHLCV data is used to build price charts and power backtesting engines. It shows open, high, low, close, and volume for any set time period, giving traders the raw material behind every strategy test.
But there’s a problem.
If your backtest never sees these traps, it never learns to survive them either. The strategy looks clean on paper because the data was clean too. Too clean, honestly.
Why CryptoGates Runs Backtests on 1-Minute OHLCV Candles
Most platforms backtest on daily or even hourly candles because it’s cheaper and faster. CryptoGates doesn’t cut that corner.
Every backtest bot, whether you’re testing DCA, Grid, or Rebalance, runs on real 1-minute OHLCV data across major exchanges and coins.

Zaheer put it simply once. "You can't verify a strategy on data that hides the exact moments it would've failed. Test on what the market actually did, minute by minute, or don't test at all."
Ser, that’s not a marketing line.
That’s the actual difference between a strategy that survives and one that just looked good on a chart.
How This Affects Your Strategy Engine Results
Here’s why this actually matters for you.
The Strategy Engine’s Robustness Score and Risk of Ruin numbers are only as honest as the candles feeding them.
Stop Guessing.
Stress Test Your Edge.
The market doesn't care about your backtest. Our engine simulates 1,000+ "what-if" scenarios to ensure your strategy is built for survival.
Run Crypto Strategy Engine →Run 10,000 trade permutations on rounded, low-resolution data, and you get a confident-looking score built on a shaky foundation.
Run it on granular 1-minute data and the Monte Carlo Cloud actually reflects what could happen in a real market, not a smoothed-out fantasy version of one.
What This Means for Your Strategy
Cheap data creates expensive confidence.
That’s the whole problem in one line.
A strategy can backtest beautifully on daily candles and still get rekt live, simply because the backtest never saw the conditions that would’ve broken it.
Garbage In, Garbage Out
A backtest is only as trustworthy as what’s feeding it.
Feed it low-resolution, rounded, incomplete data, and you’ll get a result that flatters your strategy instead of stress-testing it.
Strategies backtested on granular intraday data typically show meaningfully wider drawdown ranges than the same strategy tested on daily candles alone, per quantitative backtesting research
(Source: CFA Institute Research Foundation)
Feed it real 1-minute OHLCV data, and you get something closer to the truth, even when that truth is uncomfortable.
Smaller timeframes capture intraday price swings, wicks, and volume spikes that larger candles smooth over. This means a strategy tested on 1-minute data gets exposed to real market chaos instead of a simplified version of it.
Data Quality Is the Real Edge
At the end of the day, OHLCV data is the foundation of any sound crypto backtesting methodology, the layer every backtest sits on.
Get the resolution wrong, and you’re not testing a strategy; you’re testing a fantasy version of the market that never actually existed.
Proven Setups &
Expert Breakdowns.
We don't just show you the data; we engineer and validate high-performance strategies, providing the "Alpha" behind the numbers.
CryptoGates runs on 1-minute candles because that’s what separates a real stress test from a comforting story.
Before you trust any backtest result, including your own, ask what data built it.
Then run your own parameters through the Crypto Strategy Engine and see what the data shows on real granular candles, not rounded guesses.
FAQs
What does OHLCV stand for?
OHLCV stands for Open, High, Low, Close, and Volume. These five data points make up every candle on a price chart, no matter the timeframe.
Why is 1-minute OHLCV data better than daily data for backtesting?
1-minute data captures wicks, slippage, and fake breakouts that daily candles smooth over. This gives a more honest picture of how a strategy would’ve actually performed.
Does OHLCV volume actually matter for strategy testing?
Yes. Volume confirms whether a price move has real strength behind it or if it’s likely to reverse. Ignoring volume means missing half the story a candle is telling.