Bitcoin
 Ethereum
 Solana
 TRON
 Zcash
 Hyperliquid
 Dogecoin
 Monero
 Chainlink
 Cardano
 Stellar
 Uniswap
 Sui
 Hedera
 Shiba Inu
 Bittensor
 Ripple USD
 Aster
 Polkadot
 World Liberty Financial
 Render
 Artificial Superintelligence Alliance

ASTER ran hot. Then the floor disappeared.
ASTER opened the window at $2.067 on September 26, still riding its post-launch hype.
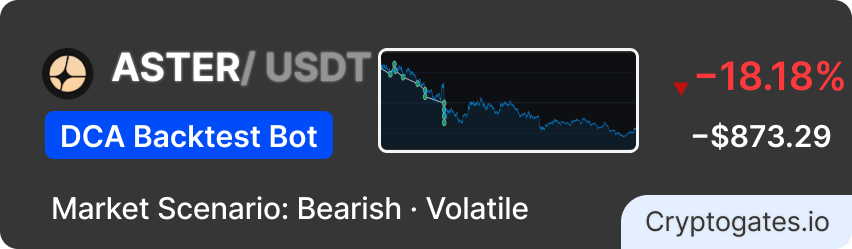
By October 24 it closed at $1.119, down $0.948 (−45.9%). A spot holder with $1,100 in lost $504.50.
On October 10, a market-wide liquidation wave hit. ASTER’s thin new-listing liquidity made it fall harder than most. A sharp rebound followed, but it never got price back near the highs.
The question: When a freshly hyped coin crashes, how much does DCA Step % alone decide whether your bot survives?
We ran three bots with identical settings except the step. Same coin, same window, real Binance 1-minute OHLCV data.
Strategy Parameters
How Each Setting Impacted Performance?
Parameter Impact Summary
| Parameter | Impact | The Logic (Why) |
|---|---|---|
| 5% DCA Step | Slower capital burn | Wider ladder, fewer fills |
| 9 DCA Orders | Ladder fully used | Ran out before bottom |
| 3% Take Profit | Four fast wins | Hit on small bounces |
| $300 Order Size | Heavy exposure | $3,002 locked at once |
| 1.0 Multiplier | No size escalation | Flat sizing limits damage |
16 orders. 4 quick wins. One $3,002 position still underwater.
📉 The Real Loss Rate
The dashboard reports −18.18%. That’s measured against $4,803.60 of cumulative deployed capital, which counts the same dollars every time a session recycles them.
On the $3,000 you actually had at risk, the loss is −29.11%. That’s the number an investor feels.
Annualizing gives −349%. That’s a figure that can’t exist, which is exactly why we don’t annualize losses.
⚖️ Four Wins, One Wreck
The four closed sessions banked roughly $51 combined, about $12.81 each. The three one-order cycles paid $8.54 apiece. The three-order cycle paid $25.63.
Session 5 lost $924.55. That’s 18 times what the four winners earned together.
💸 Fees Aren’t the Villain
Fees totaled $3.60, or 0.41% of the loss. At 0.075% per order, even 16 fills barely registered.
This strategy didn’t lose to the exchange. It lost to the market.
| Variant | DCA Step | TP % | Sessions | Orders | P&L | Loss on $3,000 |
|---|---|---|---|---|---|---|
| A (Aggressive) | 1% | 3% | 5 | 28 | −$1,251.83 | −41.73% |
| B (Conservative) | 3% | 3% | 4 | 17 | −$1,140.31 | −38.01% |
| C (Playbook) This Playbook | 5% | 3% | 4 | 16 | −$873.29 | −29.11% |
The 1% step fired 28 orders and bled the most. Its ladder reaches only about 9% below the first entry (compounded), so it was fully loaded almost immediately.
The 5% step reaches roughly 37% deep and spent its orders slowly. We chose C as the hero because it lost the least, not because it won.
No variant made money.
What the results are really telling you.
✅ what worked
Sessions 1–4 worked. Three one-order cycles each banked +$8.54 within minutes on October 6. Session 4 stacked three orders ($900.68) and closed +$25.63 on October 7. Pre-crash, ASTER oscillated near $2, so the 3% take profit triggered on small bounces.
The 5% step kept most of the ladder unspent while price was still healthy.
⚠️What didn't work
Session 5 failed: −$924.55 on $3,002.25 deployed. It opened October 7 and filled all 10 orders as the October 10 wick and the slide after it dragged ASTER down. Average entry landed near $1.62, and price closed at $1.119.
A wider step might stretch the ladder, but it’s untested here, and slower averaging-down means a higher break-even.
💡 The key insight
DCA bots harvest volatility. They can’t survive a one-way street.
Widening the step from 1% to 5% cut the loss by $378.54 with no other change. Wider steps buy time.
Time wasn’t enough here.
ASTER fell 46% and never bounced high enough to hit take profit. Step size should match how deep your coin typically dips, and new listings dip deeper than anything else.
🚩 Watch out for - a potential red flag
The −$873.29 includes session 5’s open position at the final price. It’s unrealized, not locked in. To close at take profit, ASTER needs roughly +49% from $1.119.
The 64.37% drawdown is session exposure, not your whole account. But a fully loaded ladder means $3,002.25 stays locked for weeks.
Never run this setup on a new listing unless the full $3,000 is liquid and you can leave it untouched.
🧭 When This Strategy Works Best
Ideal conditions:
✔ Established coins that oscillate within a range
✔ Choppy markets with recurring 3–5% bounces
✔ Mild pullbacks that recover within days
✔ Deep liquidity where a single wick doesn’t erase the ladder
🚫 When NOT To Use This Strategy
Avoid when:
❌ A new listing has just spiked on hype
❌ A market-wide liquidation wave is building
❌ Price is in a one-way slide with no recoveries
❌ You can’t keep the full $3,000 liquid for weeks
📊 Expert Rating
Profitability: ⭐☆☆☆☆
Risk Control: ⭐⭐☆☆☆
Capital Efficiency: ⭐⭐☆☆☆
Beginner Friendly: ⭐⭐☆☆☆
Market Adaptability: ⭐⭐☆☆☆
🏆 Overall Score
3.8 / 10 — Crash Survivor, Not a Money Maker
✔ Quick Takeaways
✔ All three variants lost money; the best (5% step) still lost $873.29
✔ Step % alone moved the result by $378.54 between 1% and 5%
✔ The 1% step fired 28 orders and finished worst, with a −41.73% loss on capital
✔ Four sessions closed in profit; one session erased all four 18 times over
✔ Fees were $3.60, so strategy design, not cost, drove the loss
✔ The bot beat equal-capital buy & hold by $502.62
What did spot buy & hold actually return?
The dashboard benchmark uses $1,100. We scaled it to the bot’s $3,000 for a fair comparison.
The opportunity cost of not running the DCA bot: $502.62. That’s the gap between −$873.29 and −$1,375.91.
The bot lost money, but it lost 16.75 percentage points less than holding. In a crash, DCA mitigates. It doesn’t rescue.
One caveat: the bot’s first order fired October 6, while buy & hold entered September 26. Part of the gap is entry timing.
Before you run this playbook, check these off.
Use this as your go/no-go checklist before deploying this exact parameter set.
🧠 Market Suitability Matrix
| Market Condition | Rating | Strategic Notes |
|---|---|---|
| Sideways / Consolidating | ★★★★★ Ideal | Sessions 1–4 closed in minutes to hours |
| High Volatility (two-way) | ★★★★☆ Good | Deep fills and fast exits, if liquid |
| Mildly Bearish / Slow Bleed | ★★★☆☆ Acceptable | Longer cycles, rising drawdown |
| Mildly Bullish / Slow Climb | ★★★☆☆ Acceptable | Fast TP hits, but fewer entries |
| Strongly Bullish / Fast Uptrend | ★★☆☆☆ Risky | Idle capital, high opportunity cost |
| Strong Bear / Flash Crash | ★☆☆☆☆ Avoid | Full ladder used, −$924.55 here |
| Very Low Volatility | ★☆☆☆☆ Avoid | No triggers, dead capital |
How to tune this playbook for different scenarios.
Disclaimer: All data sourced from CryptoGates DCA Backtest Bot. Results are historical simulations using Binance 1-minute OHLCV data. Past backtest performance does not guarantee future live trading results. DYOR.
Battle-Test Your Strategy
Before the Market Does.
Eliminate guesswork with institutional-grade backtesting for DCA, Grid, and Rebalance bots. Real historical data. Real-world results.