🌐 Explore, share, learn & grow.

🧭 Confused about market outlook?

  • bitcoinBitcoin (BTC) $ 77,443.00 0.73%
  • ethereumEthereum (ETH) $ 2,251.91 0.61%
  • solanaSolana (SOL) $ 95.55 0.36%
  • tronTRON (TRX) $ 0.304877 7.67%
  • zcashZcash (ZEC) $ 1,269.57 2.64%
  • hyperliquidHyperliquid (HYPE) $ 87.79 2.61%
  • dogecoinDogecoin (DOGE) $ 0.075708 0.42%
  • moneroMonero (XMR) $ 599.66 0.78%
  • chainlinkChainlink (LINK) $ 11.81 5.38%
  • cardanoCardano (ADA) $ 0.192579 0.61%
  • stellarStellar (XLM) $ 0.169616 1.04%
  • uniswapUniswap (UNI) $ 7.12 2.55%
  • suiSui (SUI) $ 0.897604 0.85%
  • hedera-hashgraphHedera (HBAR) $ 0.072137 0.44%
  • bittensorBittensor (TAO) $ 236.46 0.97%
  • shiba-inuShiba Inu (SHIB) $ 0.000005 1.06%
  • ripple-usdRipple USD (RLUSD) $ 1.00 0.02%
  • aster-2Aster (ASTER) $ 0.698186 2.11%
  • polkadotPolkadot (DOT) $ 0.946850 2.81%
  • world-liberty-financialWorld Liberty Financial (WLFI) $ 0.049967 0.24%
  • render-tokenRender (RENDER) $ 1.56 0.94%
  • fetch-aiArtificial Superintelligence Alliance (FET) $ 0.160096 3.32%
Grid Strategy
BTC / USDT, ETH / USDT Spot Short Term

Spot Grid Strategy: Automated Buying and Selling in a Range

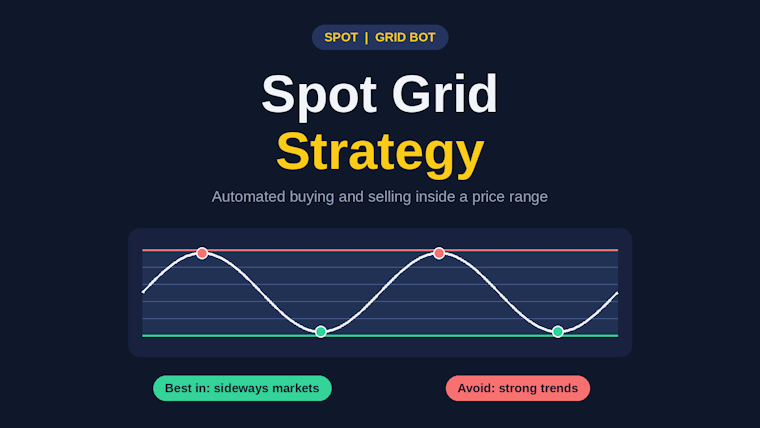
A grid bot places buy and sell orders across a price range and collects small profits from sideways moves. Best in choppy, range-bound markets.

STRATEGY CONTRIBUTOR

Strategy shared by

Emma Vance
Emma Vance Ambassador
@emmavance
View Profile
STRATEGY OVERVIEW

Strategy Snapshot

The key details of this trading strategy at a glance.

Strategy Type
Grid
Assets
BTC / USDT, ETH / USDT
Market
Spot
Time Horizon
Short Term
Risk Profile
Moderate
Trading Frequency
Daily
THE GAME PLAN

Strategy Rules

The core rules that define how this strategy works.

SETUP
1) Pick a liquid pair (for example BTC/USDT) that is moving sideways between a clear support and resistance.
2) Lower limit: slightly below support. Upper limit: around resistance.
3) Number of grids: 10 to 30. More grids = more trades with smaller profit each. Fewer grids = fewer trades with bigger profit each.
4) Spacing: Arithmetic (equal dollar gap) or Geometric (equal percentage gap).

HOW IT WORKS
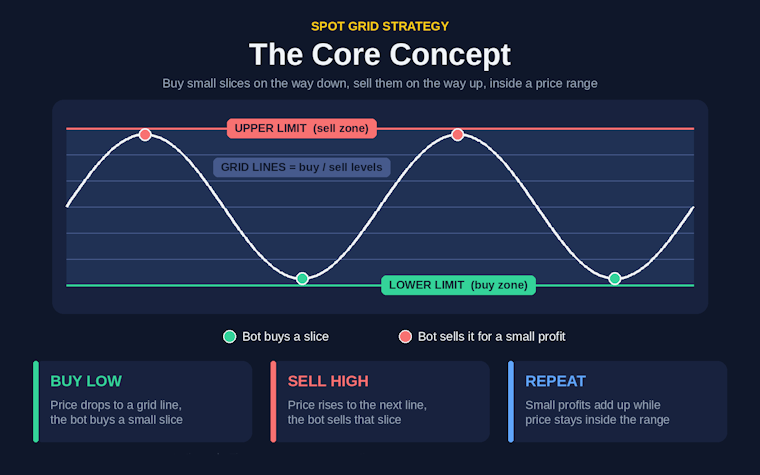
The bot buys a small slice each time price drops to a grid line and sells it when price rises to the next line above.

RISK RULES
- Set a stop loss below the lower limit.
- If price breaks support and keeps falling, pause the bot.
- Avoid low-liquidity pairs and check the fees.

BEST IN: sideways, choppy markets.
AVOID: strong trends and sudden breakdowns.

No backtest results included. Not financial advice.

INSIDE THE STRATEGY

Strategy Details

Explore the complete strategy, including its approach, entry and exit rules, and risk management.

A grid bot is a simple way to trade a sideways market without watching the chart all day. This post explains how it works and how to set it up.

THE IDEA
Imagine a ladder of price levels across a range. Every time price dips to a lower rung, the bot buys a small slice. Every time price bounces back to a higher rung, it sells that slice for a small profit. Repeat this many times and the small profits add up, as long as price keeps moving inside the range.

Because the bot follows fixed rules, it removes emotional decisions like chasing green candles or panic selling on a dip.

KEY SETTINGS
1. Upper and lower limits: the price channel where you expect the market to move.
2. Number of grids: how many buy/sell levels are placed inside that channel.
3. Spacing: Arithmetic grids use an equal dollar gap between lines. Geometric grids use an equal percentage gap.

STEP-BY-STEP SETUP
Step 1: Find a range
Choose a liquid coin that is trading between a clear support and resistance. Avoid coins in strong news-driven trends or sharp breakdowns.

Step 2: Set the limits
– Lower limit: slightly below key support.
– Upper limit: around major resistance.
– Keep a small buffer so short spikes do not knock the bot out of range.

Step 3: Choose the number of grids (10 to 30)
– More grids: more trades, smaller profit per trade.
– Fewer grids: fewer trades, bigger profit per trade.
Pick based on how much the coin usually moves in a day.

Step 4: Set your risk rules
– Place a stop loss below the lower limit.
– If price breaks support and keeps falling, pause the bot and protect your remaining capital.

WHEN IT WORKS BEST
Sideways or choppy markets where price keeps moving between support and resistance.

WHEN TO AVOID IT
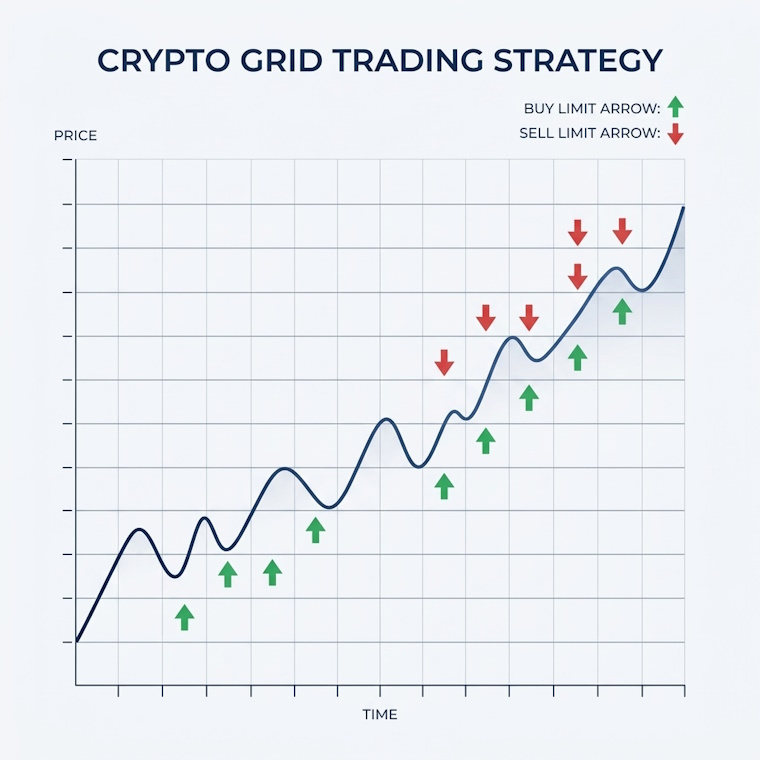
– Strong uptrends: price leaves the range at the top and the bot has sold everything early.
– Strong downtrends or crashes: the bot keeps buying lower and holds a growing losing position.
– Low-liquidity pairs, where slippage eats the small profits.

PRO TIPS
– Check the exchange fees. Many small trades need low maker/taker fees to stay profitable.
– Review your upper and lower limits if the market moves to a new range.
– Start with a small amount while you learn how the grid behaves.

RISK
No backtest results are included in this post, so please test it before using real money. A grid bot can lose money if price leaves the range, especially to the downside. This is not financial advice. Only use money you can afford to lose.

WATCH & LEARN

Strategy Video

Watch the creator explain this strategy in more detail.

A NOTE FROM THE CREATOR

Creator's Note

Sharing this grid setup for learning and discussion. It suits sideways markets and is weak in strong trends, so check the market conditions first. The key rules: set limits around real support and resistance, use a stop-loss below the lower limit, and start small. No backtest results are included.

See something misleading or inappropriate? Report this Strategy
Found this strategy useful? Share it with others or contribute your own.
Share Your Strategy
PUT YOUR STRATEGY TO THE TEST

Ready to Test This Strategy?

Don't rely on assumptions. Backtest your strategy against historical market data and see how it performs.

Backtest This Strategy