🌐 Explore, share, learn & grow.

🧭 Confused about market outlook?

  • bitcoinBitcoin (BTC) $ 77,717.00 0.7%
  • ethereumEthereum (ETH) $ 2,264.75 1.2%
  • solanaSolana (SOL) $ 95.39 0.85%
  • tronTRON (TRX) $ 0.307855 5.42%
  • zcashZcash (ZEC) $ 1,241.81 2.02%
  • hyperliquidHyperliquid (HYPE) $ 87.61 1.86%
  • dogecoinDogecoin (DOGE) $ 0.075534 0.06%
  • moneroMonero (XMR) $ 604.40 2.46%
  • chainlinkChainlink (LINK) $ 11.51 0.48%
  • cardanoCardano (ADA) $ 0.192413 0.71%
  • stellarStellar (XLM) $ 0.168637 0.21%
  • uniswapUniswap (UNI) $ 7.04 1.21%
  • suiSui (SUI) $ 0.900191 0.05%
  • hedera-hashgraphHedera (HBAR) $ 0.071845 0%
  • shiba-inuShiba Inu (SHIB) $ 0.000005 2.06%
  • bittensorBittensor (TAO) $ 235.21 0.28%
  • ripple-usdRipple USD (RLUSD) $ 1.00 0.05%
  • aster-2Aster (ASTER) $ 0.697456 1.52%
  • polkadotPolkadot (DOT) $ 0.948199 1.41%
  • world-liberty-financialWorld Liberty Financial (WLFI) $ 0.050314 0.87%
  • render-tokenRender (RENDER) $ 1.57 1.34%
  • fetch-aiArtificial Superintelligence Alliance (FET) $ 0.161922 1.5%
Grid Strategy
ETH / USDT Spot Short Term

ETH Spot Grid: 20 Grids Across a +/-10% Range, 1% Apart

A percentage-based grid setup for a range-bound coin: 20 grids, 1% apart, with a clear stop below the range. Test it on CG Backtest.

REPORTED ROI +66.00%
Creator-reported performance
STRATEGY CONTRIBUTOR

Strategy shared by

Grace Alpha
Grace Alpha Ambassador
@grace-alpha
View Profile
STRATEGY OVERVIEW

Strategy Snapshot

The key details of this trading strategy at a glance.

Strategy Type
Grid
Assets
ETH / USDT
Market
Spot
Time Horizon
Short Term
Risk Profile
Moderate
Trading Frequency
Daily
THE GAME PLAN

Strategy Rules

The core rules that define how this strategy works.

PAIR: ETH/USDT, Spot, no leverage
ANCHOR: the price when you start the bot
RANGE: from 10% below to 10% above the anchor price
GRIDS: 20, equal spacing (1% apart)
ORDER SIZE: equal amount per grid

HOW IT TRADES
- When price falls to a grid line, the bot buys one slice.
- Each filled buy gets a sell order one grid line higher.

RISK RULES
- Stop: a daily close 3% below the lower limit. Exit and accept the loss.
- Above the range: all coins are sold and the bot sits in USDT. Reset the range or stop.
- Optional filter: pause new buys while price is below its 200-day average and still falling.
- Use only part of your capital on one bot.

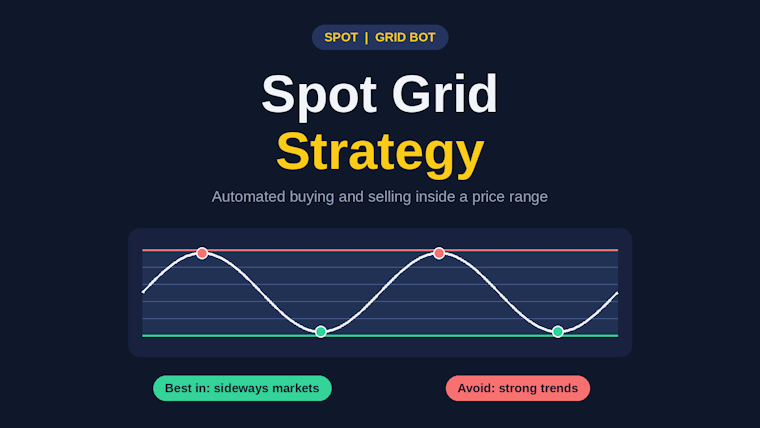
Best in sideways markets. Weak in strong trends.
Test on CG Backtest before using real money. Not financial advice.

INSIDE THE STRATEGY

Strategy Details

Explore the complete strategy, including its approach, entry and exit rules, and risk management.

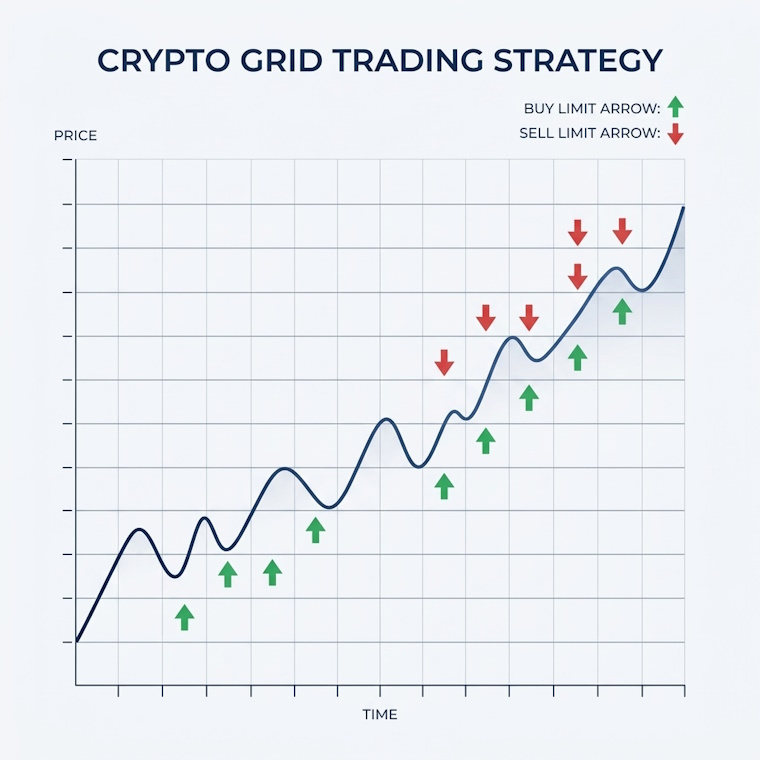
A grid bot buys small slices as price falls and sells them as price rises, inside a range. This post shows a percentage-based example you can test yourself on a range-bound coin.

HOW IT WORKS
1. Pick an anchor price (the price when you start).
2. Set a range around it, here 10% below to 10% above.
3. Split the range into 20 equal grids, so each grid is 1% wide.
4. When price falls to a grid line, the bot buys one slice. Each filled buy gets a sell order one grid line higher.
5. When that sell fills, the bot earns the difference and waits for the next dip.

EXAMPLE SETTINGS
Pair: ETH/USDT, Spot, no leverage
Range: anchor price -10% to anchor price +10%
Grids: 20 (1% apart)
Order size: equal amount per grid
These are example settings for learning, not a recommendation. Change them to fit the market you trade.

A SIMPLE NUMBER EXAMPLE
Each completed grid earns about 1% on the slice. With a 0.1% fee on the buy and 0.1% on the sell, about 0.2% goes to fees, so the net is roughly 0.8% per completed grid before slippage. If you make the grids tighter, fees take a bigger share of each profit.

TIGHTER VS WIDER GRIDS
– Tighter grids (for example 0.5%): more trades and smaller profit per trade, with more fee drag.
– Wider grids (for example 2%): fewer trades and larger profit per trade.

RISK RULES
– Stop: a daily close 3% below the lower limit. Exit and accept the loss. Below the range, the bot keeps holding a coin that is falling.
– Above the range: all coins are sold and the bot sits in USDT, earning nothing. Reset the range or stop.
– Optional trend filter: pause new buys while price is below its 200-day average and still falling.
– Use only part of your capital on one bot.

WHEN IT WORKS BEST
Sideways, choppy markets where price keeps moving between support and resistance.

WHEN TO AVOID IT
– Strong downtrends: the bot keeps buying lower and holds a growing losing position.
– Strong uptrends: price leaves the top of the range and you miss the move.
– Very low volatility, where grids rarely trigger.

IMPORTANT
Profit from completed grid cycles is not the same as the bot's total result. If price falls and the bot holds coins, the unrealized loss can be larger than the grid profit you collected. Always look at the net result.

ABOUT THE VIDEO
The video linked in this post is "GRID TRADING – How to Use it & Why it's Effective" by Ryan Brown (ResponsibleForexTrading). It is a general explanation of grid trading and is about four years old. The settings above are my own example for crypto and are not taken from the video.

BEFORE YOU USE REAL MONEY
Run the same settings on CG Backtest for different periods and look at the net result including fees. Try paper trading first.

RISK
This is not financial advice. A grid bot can lose money if price leaves the range, especially downward. Only use money you can afford to lose.
WATCH & LEARN

Strategy Video

Watch the creator explain this strategy in more detail.

A NOTE FROM THE CREATOR

Creator's Note

Sharing a percentage-based grid example for learning and discussion. The 10% range, 1% spacing and the stop are example settings, not a recommendation. Please run it on CG Backtest and check the net result including fees. The linked video is a general grid trading tutorial, not the source of these settings.

See something misleading or inappropriate? Report this Strategy
Found this strategy useful? Share it with others or contribute your own.
Share Your Strategy
PUT YOUR STRATEGY TO THE TEST

Ready to Test This Strategy?

Don't rely on assumptions. Backtest your strategy against historical market data and see how it performs.

Backtest This Strategy