🌐 Explore, share, learn & grow.

🧭 Confused about market outlook?

  • bitcoinBitcoin (BTC) $ 77,298.00 4.57%
  • ethereumEthereum (ETH) $ 2,238.00 4.77%
  • solanaSolana (SOL) $ 94.82 6.71%
  • tronTRON (TRX) $ 0.335768 1.44%
  • hyperliquidHyperliquid (HYPE) $ 90.92 5.54%
  • zcashZcash (ZEC) $ 1,227.51 8.62%
  • dogecoinDogecoin (DOGE) $ 0.075673 5.34%
  • moneroMonero (XMR) $ 593.28 3.4%
  • chainlinkChainlink (LINK) $ 11.19 5.36%
  • cardanoCardano (ADA) $ 0.193024 5.62%
  • stellarStellar (XLM) $ 0.169527 1.26%
  • uniswapUniswap (UNI) $ 6.99 4.86%
  • suiSui (SUI) $ 0.892608 5.4%
  • hedera-hashgraphHedera (HBAR) $ 0.071621 3.91%
  • shiba-inuShiba Inu (SHIB) $ 0.000005 5.56%
  • bittensorBittensor (TAO) $ 234.11 8.36%
  • ripple-usdRipple USD (RLUSD) $ 1.00 0.02%
  • aster-2Aster (ASTER) $ 0.674542 6.02%
  • polkadotPolkadot (DOT) $ 0.955114 4.69%
  • world-liberty-financialWorld Liberty Financial (WLFI) $ 0.050509 2.32%
  • render-tokenRender (RENDER) $ 1.56 7.87%
  • fetch-aiArtificial Superintelligence Alliance (FET) $ 0.166255 8.61%
Grid Strategy
DOT / USDT Spot Short Term

DOT Spot Grid: 80 Arithmetic Grids for a Sideways Market

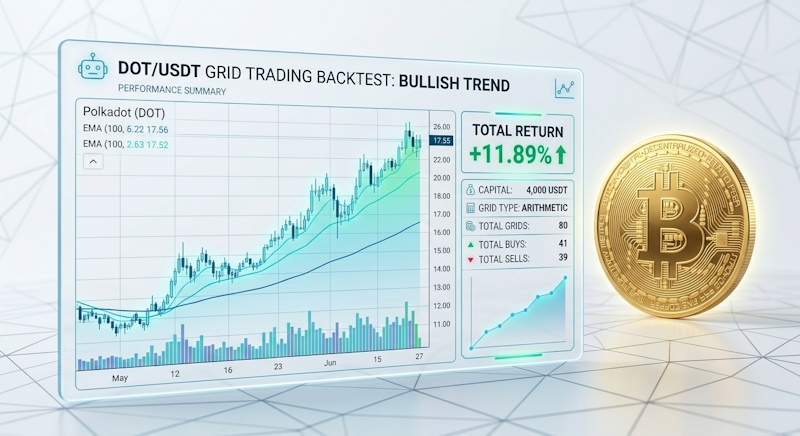
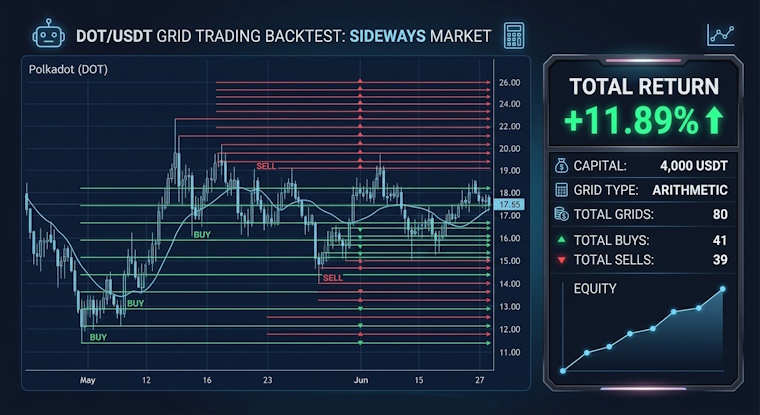
Grid bot tested on CG Backtest (Mar-Apr 2025, sideways chop): about +11.89% ROI on 4,000 USDT, 0.1% fee. Re-run it yourself.

REPORTED ROI +11.88%
Creator-reported performance
STRATEGY CONTRIBUTOR

Strategy shared by

Hazel Crypto
Hazel Crypto Ambassador
@hazelcrypto
View Profile
STRATEGY OVERVIEW

Strategy Snapshot

The key details of this trading strategy at a glance.

Strategy Type
Grid
Assets
DOT / USDT
Market
Spot
Time Horizon
Short Term
Risk Profile
Moderate
Trading Frequency
Daily
THE GAME PLAN

Strategy Rules

The core rules that define how this strategy works.

PAIR: DOT/USDT, Spot (Binance data)
CAPITAL: 4,000 USDT, fee 0.1%
GRID TYPE: Arithmetic (equal price gap)
GRIDS: 80
RANGE: [LOWER] to [UPPER]
TEST PERIOD: [DATES], a sideways, choppy market

HOW IT TRADES
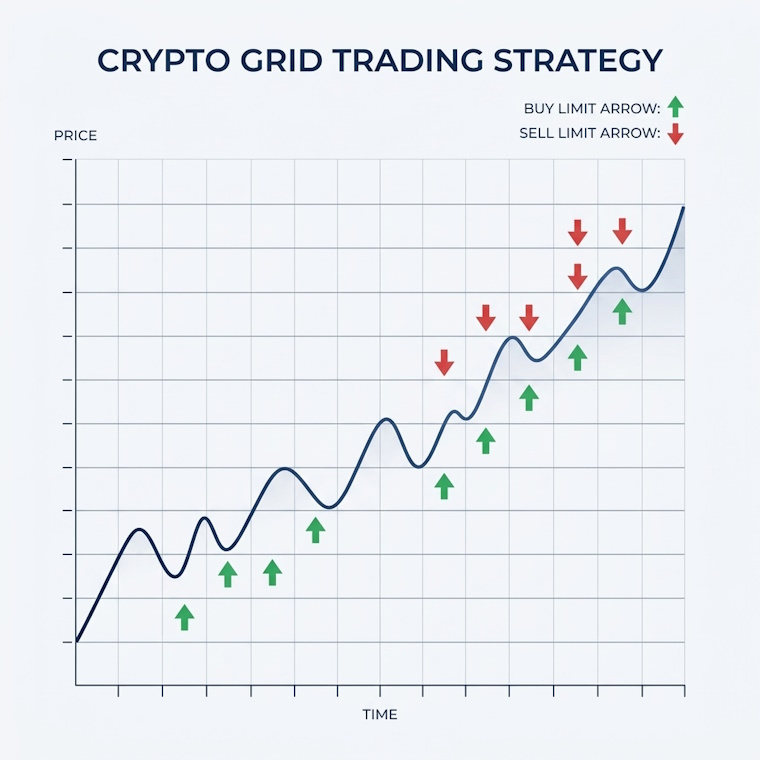
- When price falls to a grid line, the bot buys one slice.
- Each filled buy gets a sell order one grid line higher.

RESULT IN THIS TEST
About +11.89% ROI, [TRADES] trades, [P&L] USDT.

RISK
Grid bots work in sideways markets and struggle in strong trends. Past results do not guarantee future results.

Re-run the same settings on CG Backtest. Not financial advice.

INSIDE THE STRATEGY

Strategy Details

Explore the complete strategy, including its approach, entry and exit rules, and risk management.

A grid bot buys small slices as price falls and sells them as price rises, inside a range. This post shares a grid setup that was tested on CG Backtest in a sideways market, so you can re-run it yourself.

THE SETUP
Pair: DOT/USDT, Spot (Binance data)
Capital: 4,000 USDT
Fee: 0.1%
Grid type: Arithmetic (equal price gap between lines)
Number of grids: 80
Range: [LOWER] to [UPPER]
Test period: [DATES]

WHY THIS MARKET
Price moved sideways in a choppy range, which is the market a grid bot is built for. Each time price moves up and down between grid lines, the bot collects a small profit.

THE RESULT
About +11.89% ROI on 4,000 USDT, with [TRADES] trades and [P&L] USDT profit. This is one test in one market period. It is not a promise for the future.

WHEN IT WORKS BEST
Sideways, choppy markets where price keeps moving inside a range.

WHEN IT STRUGGLES
– Strong downtrends: the bot keeps buying lower and holds a growing losing position.
– Strong uptrends: price leaves the top of the range and the bot sits in USDT.
– Fees: with 80 grids, fees take a share of each small profit.

TRY IT YOURSELF
Open CG Backtest and use the same settings (DOT/USDT, 4,000 USDT, 0.1% fee, arithmetic, 80 grids, same range). Then test another period to see how it behaves in a trending market.

RISK
This is not financial advice. A grid bot can lose money if price leaves the range, especially downward. Only use money you can afford to lose.
A NOTE FROM THE CREATOR

Creator's Note

Sharing a grid setup that was tested on CG Backtest in a sideways market. The result is from one period only. Re-run the same settings and try a trending period too, since grids behave very differently there.

See something misleading or inappropriate? Report this Strategy
Found this strategy useful? Share it with others or contribute your own.
Share Your Strategy
PUT YOUR STRATEGY TO THE TEST

Ready to Test This Strategy?

Don't rely on assumptions. Backtest your strategy against historical market data and see how it performs.

Backtest This Strategy