Bitcoin
 Ethereum
 Solana
 TRON
 Zcash
 Hyperliquid
 Dogecoin
 Monero
 Chainlink
 Cardano
 Stellar
 Uniswap
 Sui
 Hedera
 Shiba Inu
 Bittensor
 Ripple USD
 Aster
 Polkadot
 World Liberty Financial
 Render
 Artificial Superintelligence Alliance

A grid bot buys small slices as price falls and sells them as price rises, inside a range you choose. This post gives one concrete BTC/USDT example you can copy and adjust.
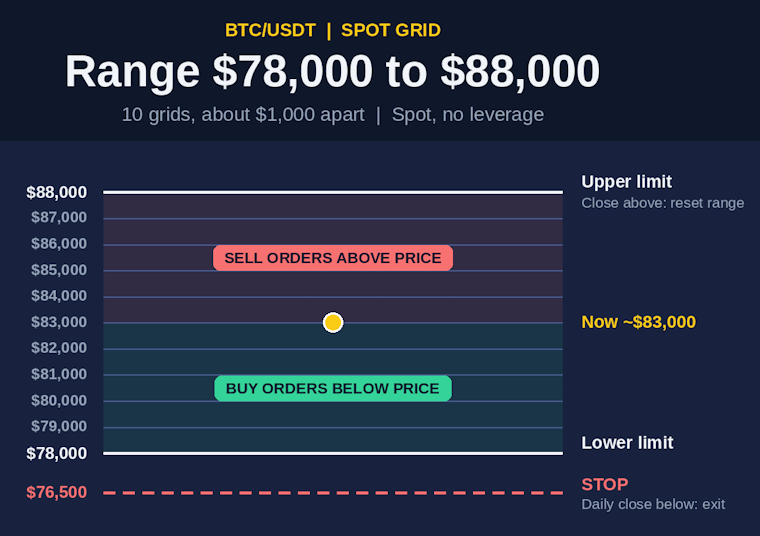
EXAMPLE SETUP (based on BTC near $83,000 on Oct 11, 2026)
Pair: BTC/USDT, Spot, no leverage
Lower limit: $78,000
Upper limit: $88,000
Number of grids: 10, equal spacing (arithmetic)
Grid size: about $1,000, which is roughly 1.2% at today's price
Capital: split evenly, so with $1,000 each grid uses about $100
WHY THIS RANGE
The range is built from levels many analysts were watching: support around $80,000, a deeper support zone near $76,500 to $78,000, and resistance around $87,000. The lower limit sits at the bottom of that deeper zone and the upper limit just above the $87,000 ceiling.
HOW IT WORKS
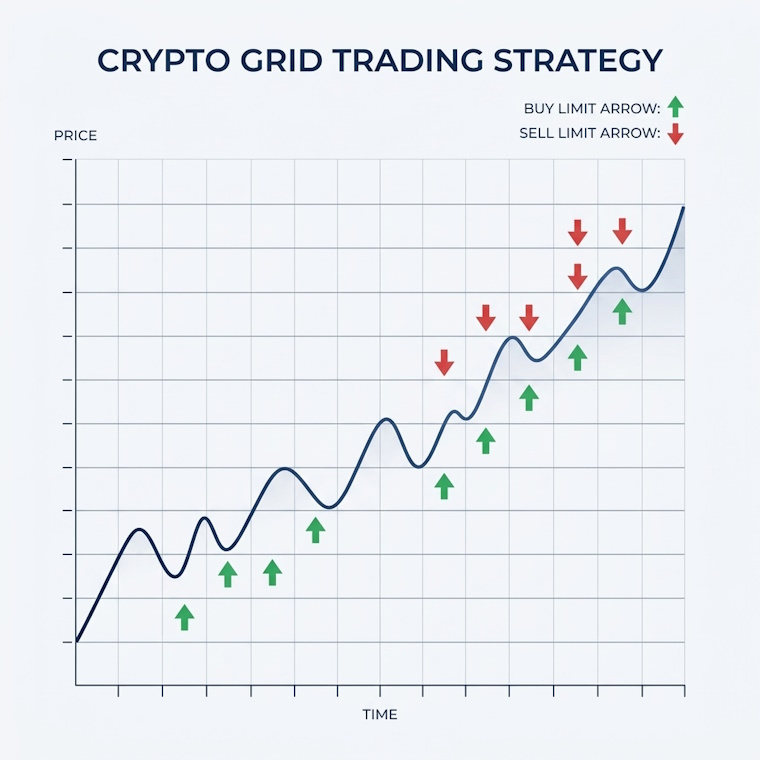
1. When price falls to a grid line, the bot buys one slice.
2. Each filled buy gets a sell order one grid line higher.
3. When that sell fills, the bot earns the difference and waits for the next dip.
A SIMPLE NUMBER EXAMPLE
Buy $100 of BTC at $82,000 and sell it one grid higher at $83,000. The price rose about 1.2%, so the gross profit is about $1.20. If the fee is 0.1% per trade, you pay about $0.20 in fees, so the net is about $1.00. This is an example. Real fees and fills vary.
EXIT RULES
– Daily close below $76,500: stop the bot. Below the range, it keeps holding BTC that is losing value.
– Daily close above $88,000: all coins are sold and the bot sits in USDT, earning nothing. Reset the range higher or stop.
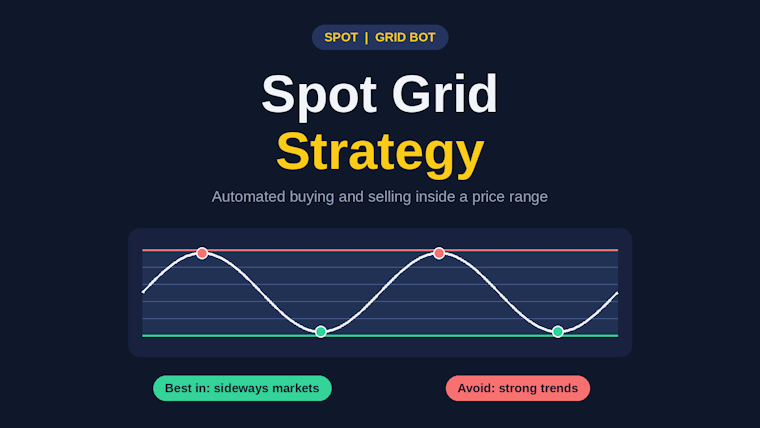
WHEN IT WORKS BEST
Sideways, choppy markets where price keeps moving between support and resistance.
WHEN TO AVOID IT
– Strong downtrends: the bot keeps buying lower and holds a growing losing position.
– Strong uptrends: price leaves the top of the range and you miss the move.
– When fees take too much of each small grid profit. Check your exchange fees first.
IMPORTANT
Profits from completed grid cycles are not the same as the bot's total result. If price falls and the bot holds BTC, the unrealized loss on those coins can be larger than the grid profit you collected. Always look at the net result.
BEFORE YOU USE REAL MONEY
BTC moves every day, so check the live price and update the range. If the price is outside the range, this setup will not work as intended. Try it with paper trading first, and test different ranges and grid counts.
FURTHER LEARNING
For a general walkthrough of grid bots (choosing a market, backtesting, arithmetic vs geometric spacing, and when a grid stops making sense), see the video linked in this post by Altrady. It is a general tutorial and is not the source of the settings above. The channel also promotes its own trading software.
RISK
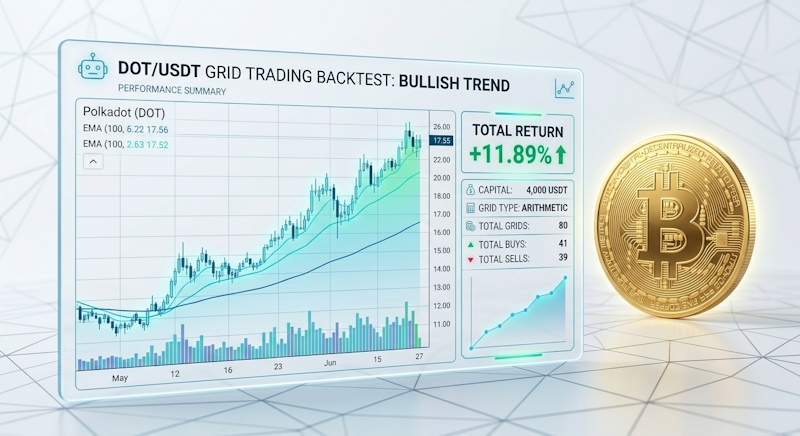
This post includes no backtest results. A grid bot can lose money if price leaves the range, especially downward. This is not financial advice. Only use money you can afford to lose.