Author: Sajid Hussain

  • Why Most Traders Choose the Wrong ⚠️ Crypto Strategy 📊 and How to Find One That Actually Lasts 🧪

    Why Most Traders Choose the Wrong ⚠️ Crypto Strategy 📊 and How to Find One That Actually Lasts 🧪

    Ser, here’s something most traders don’t want to admit.

    It’s rarely the market that wrecks them first.

    It’s the strategy they picked, and honestly, the reason they picked it.

    Someone posts a screenshot of a 40% month on CT, and suddenly everyone wants that exact setup, no questions asked.

    A large majority of retail traders abandon a trading strategy within the first few weeks, often before it’s had enough time to prove itself.

    Forrester Research

    Nobody checks if it actually fits their capital, their patience, or their risk tolerance.

    Understanding why traders choose the wrong strategy isn’t really about strategy at all.

    It’s about decision-making, and most of it happens before a single trade is even placed.

    EXECUTIVE SUMMARY
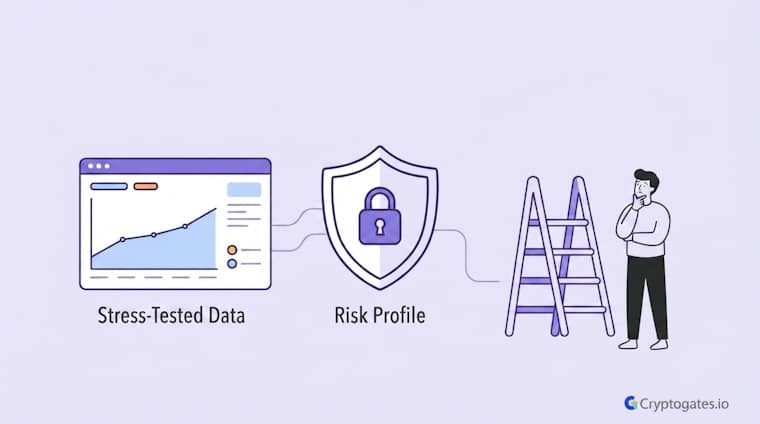
    • The Problem: Traders pick strategies based on hype or recent performance instead of checking if the strategy actually fits their risk profile.
    • The Solution: Choose strategies based on structural data, like robustness across market conditions, instead of gut feeling.
    • The Incentive: A strategy chosen for the right reasons is one you’re actually likely to stick with long enough to work.
    • The Risk: Even a statistically solid strategy can still fail you if it was never stress-tested against your real risk tolerance.

    The Real Reasons Traders Pick the Wrong Strategy

    Most wrong strategy choices don’t come from bad information. Ser, that’s the part that surprises people.

    The information is usually out there. The problem is how the decision actually gets made.

    Here’s the interesting part.

    It’s almost never a lack of research. It’s a shortcut.

    Someone sees a result, gets excited, and skips the part where they check if that result applies to them.

    Research Insight

    This pattern shows up repeatedly across CryptoGates’ proprietary backtests. In one DCA test on TAO, the asset pumped 36% before bleeding back down to a 17% loss over the full test window — yet 139 of 140 individual sessions still closed in profit, and the bot returned +$1,677 overall.

    If that test had been judged on the pump phase alone, the conclusion would have been completely wrong. It’s only by tracking performance through the full round trip — the rally and the collapse — that the strategy’s actual structural edge becomes visible.

    This is the exact trap the article describes: a single strong month (or a single strong leg) tells you almost nothing about whether a strategy can survive what comes after it.

    View Complete Playbook

    1. Chasing What Worked For Someone Else

    Look, CT is full of “this made me X% last month” posts, and beginners often just ape in without checking the context behind it.

    A strategy that worked for a trader with deep capital and years of experience can completely fail on a smaller account with a shorter time horizon.

    TIP:

    Judge a strategy by how it performs across many market conditions, not by its best month. One good run tells you almost nothing about survivability.

    Same setup. Same parameters, even. Different outcome.

    Because the strategy was never actually built around the person copying it.

    2. Choosing Based on Recent Performance, Not Structure

    Here’s the issue. A strategy having a great month doesn’t mean it’s a good strategy.

    It might just mean it got lucky during a specific market condition.

    If it hasn’t been tested across different conditions, sideways, bearish, volatile, you’re basically judging a book by one really good chapter.

    Crypto Tweak:

    Judge a strategy by how it performs across many market conditions, not by its best month. One good run tells you almost nothing about survivability.

    Wait. This is where things quietly go wrong. Traders confuse “recent performance” with “reliable performance,” and those are not the same thing at all.

    Why do most new traders fail with crypto strategies?

    They usually pick a strategy based on hype or someone else’s recent results instead of checking if it fits their own capital and risk tolerance.

    How a Mismatched Strategy Quietly Destroys Accounts

    The damage from a mismatched strategy rarely shows up as one dramatic loss. Honestly, that’s what makes it dangerous.

    It’s slower than that. It’s a bunch of small emotional decisions that quietly drain an account over weeks or months.

    Here’s the key idea.

    By the time a trader notices something’s wrong, the strategy usually isn’t the only thing that’s broken.

    Their confidence is too.

    1. Overleveraging a Strategy That Wasn’t Built For It

    This is a common one. A strategy performs fine at small size, so traders assume more size just means more profit. But there’s a problem.

    Adding leverage to a strategy that wasn’t stress-tested for it doesn’t scale returns evenly, it scales risk of ruin.

    The strategy didn’t change. The danger around it did.

    Swipe to view full data →
    Mistake What It Feels Like What’s Actually Happening
    Overleveraging “This will speed up my gains” Risk of ruin increases faster than returns
    Panic-exiting early “This strategy is broken” Normal variance is misread as failure
    Holding too long “It’ll come back” A structurally weak setup gets more time to fail

    2. Abandoning a Strategy Too Early or Too Late

    Without real data backing a decision, traders swing between two extremes. They panic-exit a genuinely solid strategy after one rough week, convinced it’s broken.

    Or they hold onto a structurally weak one way too long, hoping it turns around because it “worked before.”

    Neither decision comes from data. Both come from emotion wearing a strategy’s clothes.

    How the Strategy Engine Prevents This Mistake

    Real Backtest Example

    Strategy: DCA
    Coin: DOT/USDT
    Market Condition: 7-month sustained downtrend (−56%)
    Objective: Test structural survival under prolonged, uninterrupted decline
    Key Result: 79 of 80 sessions closed in profit. The bot returned +$380.99 while spot holders on the same capital sat on a −$617 loss — a $998 gap between the two outcomes.
    Expert Interpretation: A strategy that stays consistent across 80 sessions spanning seven months of straight-line decline is being tested against something closer to a real Robustness Score than any single month could ever simulate.

    This is the difference the article draws between a strategy that “looked good once” and one that has actually been pressure-tested — the DOT result didn’t come from one lucky window, it came from surviving nearly every session in a bad one.

    View Complete Playbook

    Ser, here’s the thing. Almost all of this comes down to one root issue.

    Traders choose and scale strategies on instinct instead of evidence.

    The Crypto Strategy Engine exists specifically to remove that guesswork before capital gets involved.

    1. Robustness Score as a Reality Check

    A high Robustness Score across thousands of simulated runs means the strategy’s edge is structural, not a coincidence from one good sequence.

    If the score holds steady no matter how the simulation shuffles the trade order, that strategy is standing on something real.

    CEO Note:

    Hey, it’s Zaheer. Almost every account blowup I’ve seen traces back to the same thing, a strategy that was never actually tested for the person using it. Verify first. Risk later. Scale slowly. That order matters more than people think.

    2. Stress Testing Before Scaling Capital

    Before adding size, or even before choosing a strategy at all, running a Monte Carlo stress test shows the Risk of Ruin and 95% Probable Drawdown upfront.

    Feels less exciting than jumping straight in, ngl.

    But it’s the difference between scaling a strategy that can survive pressure and scaling one that just hasn’t been tested yet.

    Can a good crypto strategy still lose money?

    Yes. Even a statistically strong strategy can lose money in the short term. What matters is whether it holds up across many market conditions, not whether it wins every trade.

    Choose With Data, Not Instinct

    Ser, the wrong strategy isn’t always actually a bad strategy.

    Most of the time, it’s just the wrong one chosen for the wrong reasons, hype, a good month, or someone else’s screenshot. The fix isn’t finding a “perfect” strategy.

    It’s choosing based on structural evidence instead of gut feeling, and stress-testing it before real capital gets involved. That’s exactly what the Crypto Strategy Engine is built to do, showing you whether a strategy actually survives, not just whether it looked good once.

    Run your own strategy through it and see what the data actually shows → cryptogates.io.

    FAQs

    Why do traders often pick the wrong crypto strategy?

    Usually because they copy what worked for someone else or chase a strategy’s recent good month, instead of checking if it fits their own risk profile.


    Test the strategy against different market conditions before committing real capital, and check metrics like Risk of Ruin, not just past returns.


    Not necessarily. A single bad month can be normal variance. What matters more is how the strategy performs across many simulated market conditions.

  • Find the Best Crypto Strategy 🧭 for Your Risk Profile 🎯 Before the Market Tests You 📈

    Find the Best Crypto Strategy 🧭 for Your Risk Profile 🎯 Before the Market Tests You 📈

    Ser, honestly, most traders don’t fail because they pick a “bad” strategy.

    They fail because they pick a strategy that doesn’t match who they actually are.

    You can grab the exact same DCA bot as someone else and still lose money, simply because your risk profile isn’t theirs.

    That’s the real reason people bounce from strategy to strategy, chasing whatever worked for someone on CT last week.

    Over 70% of retail crypto traders lose money in volatile markets, often because they trade strategies that don’t fit their own risk tolerance or time horizon.

    Forrester Research

    Finding the best crypto strategy for your risk profile isn’t about copying a winner.

    It’s about knowing what you can actually survive, emotionally and financially, before the market tests you.

    EXECUTIVE SUMMARY
    • The Problem: Traders copy strategies that worked for someone else without checking if it fits their own risk tolerance or capital.
    • The Solution: Match your strategy to your actual risk profile using tools that stress-test performance before you commit capital.
    • The Incentive: A strategy that fits your risk profile is one you can actually stick with through drawdowns, instead of panic-exiting.
    • The Risk: Even a statistically strong strategy can fail you if your personal risk tolerance doesn’t match its volatility.

    Why “Best Strategy” Depends on You, Not the Market

    There’s no such thing as a universal best strategy.

    Ser, this trips up almost every beginner.

    The strategy that works beautifully for a whale with deep pockets and iron nerves can wreck a smaller trader who panics at a 15% dip.

    Fit matters more than performance on paper.
    Here’s the interesting part.

    Two traders can run the exact same bot, on the exact same coin, and get completely different outcomes.

    Not because the strategy failed. Because one of them could emotionally handle the drawdown, and one couldn’t.

    CG STRATEGY ANALYZER

    Confused about
    market outlook?

    Trading without a plan is just gambling. Our strategy architect analyzes your risk tolerance and capital to match you with a proven algorithmic framework.

    PASSIVE DCA Bot
    AGGRESSIVE Grid Pro
    BALANCED Rebalance

    1. Risk Tolerance Isn’t Just About Money

    Look, risk tolerance isn’t just “how much can I afford to lose.” It’s also how you react when the number actually drops. Some traders can watch a 20% drawdown and feel nothing.

    Others panic sell at 5% and call it protecting their capital. Neither is wrong exactly, but if your strategy doesn’t match your emotional bandwidth, you’ll break it at the worst possible time, usually right before it would’ve recovered.

    This is where things change if you’re honest with yourself.

    A strategy isn’t just numbers on a backtest. It’s a psychological contract you’re making with your own future self.

    2. Why Copying Someone Else’s Strategy Usually Backfires

    Here’s the issue. CT loves to share “this is the setup that worked for me,” and beginners ape in without checking the context.

    A whale running a Grid strategy with six figures of capital has completely different liquidation risk than a shrimp running the same grid with a few hundred dollars.

    “Position sizing and risk tolerance matter more than the strategy itself. Most blowups come from mismatch, not from a bad system.”

    Rand Fishkin, Co-founder Moz

    Same bot. Same parameters even. Totally different risk exposure.

    Copying someone’s strategy without checking your own capital size, time horizon, and stress tolerance is basically gambling with extra steps.

    What is the safest crypto strategy for beginners?

    There’s no single “safest” strategy. DCA tends to feel calmer for most beginners since it removes timing pressure, but the real safety comes from matching strategy risk to your own tolerance and capital size.

    The Four Strategy Types and Who They Actually Fit

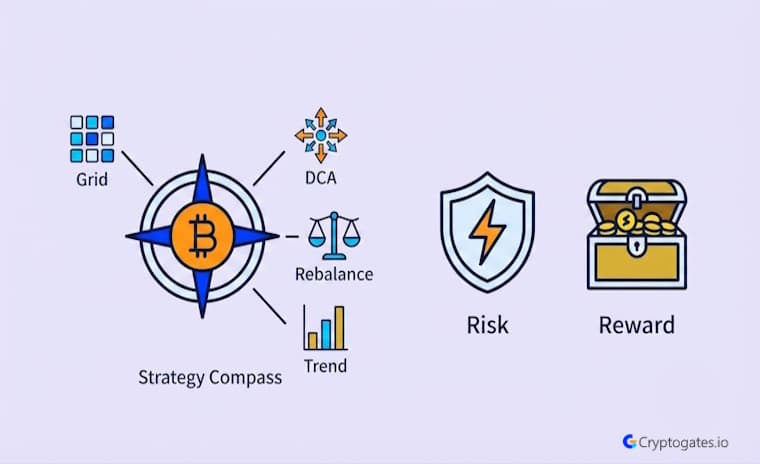
    Spot, DCA, Grid, and Rebalance strategies aren’t interchangeable.

    Each one is built for a different kind of trader, a different kind of market, and honestly, a different kind of patience level. Knowing which bucket you fall into is half the battle.

    1. Spot Buy and Hold — For Long-Term Conviction

    This one fits traders who believe in an asset long-term and don’t want to babysit charts.

    You buy, you hold, you ride the trend. It works best for people with high conviction and low need for constant monitoring. But there’s a problem.

    If you don’t have real conviction, you’ll paper hand the first serious dip.

    2. DCA — For Reducing Timing Risk

    DCA fits traders who hate the pressure of “did I buy at the top.” Instead of guessing, you spread entries over time.

    It’s less exciting, sure.

    Honestly, that’s kind of the point. It suits people who want steady exposure without the stress of predicting tops and bottoms.

    3. Grid Strategy — For Sideways Markets

    Grid fits traders who are comfortable with more active, rules-based automation.

    It thrives in chop, range-bound markets where price bounces between levels instead of trending hard.

    If you’re someone who gets bored watching a flat chart, this strategy actually turns that boredom into structured opportunity.

    Real Backtest Example

    Strategy: Grid
    Coin: SOL/USDT
    Market Condition: Moderate uptrend (18.6% rally over 76 days)
    Objective: Test whether an active grid can outperform simply holding during a real rally

    Key Result: A 40-grid SOL bot fired 308 trades and closed the window at +16.72% ROI, just under the 18.64% return a buy-and-hold position delivered in the same stretch.

    Expert Interpretation: This is exactly the fit problem this article is talking about. Grid didn’t fail — it did what grid strategies are built to do, capture range and volatility. But in a market that mostly just went up, a simpler, lower-effort approach edged it out.

    The lesson isn’t “grid is worse.” It’s that grid rewards traders who can tolerate active exposure and imperfect timing in exchange for structure — not traders chasing the biggest possible number in a trending market.

    View Complete Playbook: https://cryptogates.io/playbooks/sol-grid-bot-backtest-16-72-roi-vs-18-64-buy-hold/

    Swipe to view full data →
    Strategy Best Fit For Core Behavior
    Spot Buy & Hold High conviction, low monitoring Long-term holding
    DCA Timing-anxious traders Scheduled entries
    Grid Active, range-bound traders Buy low, sell high in range
    Rebalance Multi-asset portfolio holders Automatic allocation correction

    4. Rebalance Strategy — For Portfolio Discipline

    This one’s for traders managing multiple assets who want risk control without manually checking allocation every week.

    Rebalancing automatically brings your portfolio back to target weights, which quietly manages risk drift most people don’t even notice happening.

    How the Strategy Engine Finds Your Actual Fit

    Here’s the thing. Most traders never test whether a strategy actually fits them.

    They just run it and hope.

    The Crypto Strategy Engine exists to remove that guesswork, stress-testing a strategy against real risk metrics before a single dollar is on the line.

    SYSTEM ACCESS: CG4.2

    Stop Guessing.
    Stress Test Your Edge.

    The market doesn’t care about your backtest. Our engine simulates 1,000+ “what-if” scenarios to ensure your strategy is built for survival.

    Run Crypto Strategy Engine →
    ROBUSTNESS SCORE
    75+ STRUCTURAL EDGE
    RISK OF RUIN < 1%
    TARGET HIT 92%

    1. What the Strategy Engine Actually Measures

    The Engine doesn’t just show you a profit number and call it a day.

    It gives you a Robustness Score, which tells you if your edge is structural or accidental.

    It shows Risk of Ruin, the probability your account hits a catastrophic drawdown before hitting target.

    And it shows your 95% Probable Drawdown, basically your pain threshold in dollars.
    Wait.

    This part matters more than people realize.

    A strategy with a great return but a high Risk of Ruin is still a bad fit if you can’t emotionally survive the swings it takes to get there.

    2. Why a Monte Carlo Stress Test Beats a Single Backtest

    Reality Check

    Common belief: If a strategy is “working” — generating trades, hitting some profitable closes — it’s protecting you.

    What CryptoGates research found: During a 33% BNB crash following its all-time high, a grid bot fired 171 trades and generated $163.94 in real grid profit. It was mechanically doing its job the entire time. Total portfolio ROI still landed at −21.64%.

    Why it matters: Grid profit and account performance are not the same thing. A strategy can execute perfectly and still lose money if the market moves outside its designed range.

    This is precisely why a Robustness Score or Risk of Ruin number matters more than watching trades fire — a strategy needs to be evaluated against how far the market can move against it, not just whether it’s active.

    View Complete Playbook: https://cryptogates.io/playbooks/grid-bot-vs-a-33-bnb-crash-what-the-backtest-data-actually-shows/

    A single backtest just shows you one version of history.

    Feels convincing, but it’s really just one lucky, or unlucky, sequence.

    The Engine runs a Monte Carlo Simulation, shuffling thousands of trade permutations to see how your strategy behaves across many possible versions of the market.

    CEO Note:

    Hey, it’s Zaheer. I built the Strategy Engine because I got tired of watching people trust a single backtest like it was gospel. Verify first. Risk later. Scale slowly. That’s not a slogan, it’s the actual test your strategy needs to pass.

    If your Robustness Score holds steady across those runs, ser, that’s a real signal. If it swings wildly, you’re leaning on luck more than logic.

    How do I know if a crypto strategy fits my risk profile?

    Check its Risk of Ruin and drawdown probability, not just its returns. If those numbers feel emotionally survivable to you personally, it’s likely a fit.

    Match First. Risk Later.

    Ser,

    honestly, the whole point of this blog comes down to one idea.

    Strategy hype doesn’t matter if the strategy doesn’t fit you. The best crypto strategy for your risk profile isn’t the one with the flashiest returns on someone else’s screenshot.

    It’s the one you can actually survive, both financially and emotionally, when the market gets uncomfortable.

    That’s exactly what the Crypto Strategy Engine is built for, stress-testing your fit before you risk a single dollar. Run your own numbers and see what the data actually says about your fit → cryptogates.io.

    FAQs

    How do I choose the best crypto strategy for my risk profile?

    Start by being honest about your capital, time horizon, and emotional tolerance for drawdowns. Then stress-test the strategy before committing real money.


    DCA tends to feel calmer since it removes timing pressure, but Grid can work well too. Safety depends more on your risk tolerance than the strategy itself.


    It’s the probability your account hits a catastrophic drawdown before reaching your profit target. Anything above 1% is generally considered high risk.

  • Crypto Backtesting Methodology 🧪: How We Validate DCA, Grid, and Rebalance Strategies 📊 Before Going Live 🚀

    Crypto Backtesting Methodology 🧪: How We Validate DCA, Grid, and Rebalance Strategies 📊 Before Going Live 🚀

    Most crypto strategies that look amazing on a chart never survive contact with a live market, a pattern that echoes why 97% of day traders lose money within their first year.

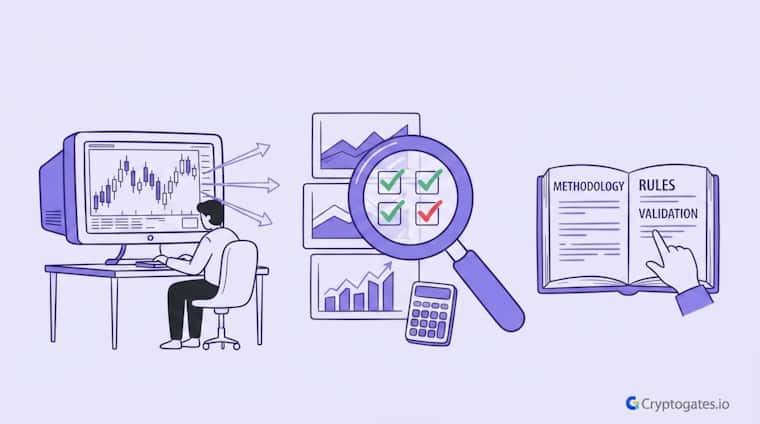
    That gap between backtest and reality is the whole reason a proper crypto backtesting methodology matters more than any single win rate you see online.

    Here’s the thing.

    A backtest isn’t proof. It’s a claim. And claims need a process behind them, not vibes.

    Strategies that showed strong results in historical testing saw average returns drop by 26% once tested on data they hadn’t seen before, and by 58% once made public and traded by others.

    McLean & Pontiff, Journal of Finance

    This piece walks through the actual process CryptoGates uses to test DCA, Grid, and Rebalance strategies before anyone treats them as real.

    No performance promises here, ser. Just the method, laid out plain.

    EXECUTIVE SUMMARY
    • The Problem: Most crypto strategies get judged on a single backtest run, which is basically judging a strategy on luck.
    • The Solution: A fixed, repeatable testing process across multiple coins, timeframes, and market phases, checked against data the strategy never saw.
    • The Incentive: Traders get a strategy that’s actually been stress-tested, not just one that looked good once.
    • The Risk: Even a well-tested strategy can still lose money live, and no backtest removes that risk entirely.

    Why This Method Matters

    Here’s what most beginners miss.

    A strategy can look flawless on a chart and still fall apart the moment real money touches it. That’s not bad luck.

    That’s usually a testing process that was never built to be honest in the first place.

    Zaheer here. I’ve watched too many traders fall for a clean-looking backtest, then get rekt live because the process behind it was never tested for survival, only for one good outcome. Verify first. Risk later. Scale slowly.

    ZAHEER, CEO CryptoGates

    The problem isn’t that people don’t test strategies. It’s that most tests only prove a strategy worked once, on one dataset, under one set of assumptions. That’s not validation.

    That’s a screenshot.

    HISTORICAL DATA AUDIT

    Battle-Test Your Strategy
    Before the Market Does.

    Eliminate guesswork with institutional-grade backtesting for DCA, Grid, and Rebalance bots. Real historical data. Real-world results.

    EST. OPTIMIZATION +42% ROI Efficiency
    Start Backtest Now

    Sourced from 5+ Years of Exchange Data

    A disciplined process forces you to ask harder questions. Did the strategy survive a real drawdown, or just a friendly bull run?

    Would it still work if fees and slippage were counted honestly?

    Does it hold up on data it never saw during setup? Most retail-level backtests skip these checks entirely, which is exactly why so many strategies feel bulletproof right up until they aren’t.

    What We Tested

    CryptoGates didn’t build this process around one lucky setup.

    The framework covers DCA, Grid, and Rebalance strategies, run through the same standard every single time, across different coins and market conditions.

    1. Strategy Types Covered

    DCA, Grid, and Rebalance logic all went through identical testing standards. No favoritism.

    No easier rules for the strategy we liked more going in. Honestly, that consistency is the point. If one strategy type got softer treatment, the whole comparison would mean nothing.

    2. Coin and Market Selection

    Testing spanned major assets and altcoins, not just BTC in isolation. Bull runs, bear markets, and long stretches of chop were all included.

    A strategy that only gets tested during a euphoric uptrend isn’t tested. It’s flattered.

    What is crypto strategy backtesting?

    Crypto strategy backtesting means running a trading strategy against historical price data to see how it would have performed. It’s a way to check a strategy’s logic before risking real capital.

    Data and Time Range

    A backtest is only as honest as the data behind it.

    Get the window wrong, skip a market phase, or feed it messy candles, and the whole result becomes noise dressed up as a signal.

    1. Historical Data Window

    The testing window was chosen to include real stress, not a comfortable stretch where everything went up.

    A strategy that’s only ever seen a bull run hasn’t been tested. It’s been flattered. Multi-year windows covering full market cycles were used so drawdowns, chop, and recoveries all show up in the data.

    2. Market Coverage

    Bull phases, bear phases, and long sideways chop were all included on purpose. Here’s the interesting part.

    Most retail backtests quietly skip the boring, range-bound stretches because they don’t produce exciting equity curves.

    Those stretches are exactly where Grid strategies live or die, so leaving them out defeats the point entirely.

    Research Highlight


    A recurring pattern shows up when Grid strategies are tested specifically inside the range-bound stretches most public backtests skip. In one 60-day window where SOL drifted sideways through an $80–$97 post-crash range with no clear direction, a grid bot logged 146 trades and closed with a 10.88% advantage over simple buy-and-hold.

    Sideways markets don’t produce dramatic equity curves, which is likely why they get left out of so many test windows — but they’re where a strategy’s structural logic is actually visible, without directional price movement doing the work for it.

    View Complete Playbook: https://cryptogates.io/playbooks/sol-usdt-grid-bot-backtest-mar-apr-2026/

    3. Data Quality Checks

    Missing candles, exchange outages, and obvious price glitches were cleaned out before a single test ran.

    Bad data creates fake signals. Wait, that’s actually the bigger risk than most people realize.

    A strategy can look genius purely because of a data gap it never should have traded around in the first place.

    Testing Framework

    Entries, exits, sizing, and risk rules were locked in before any test began. None of it got adjusted after seeing how the results looked.

    That part matters more than people think.

    1. Entry Rules

    Entry logic came from the strategy type itself, DCA intervals, Grid price bands, Rebalance drift thresholds, not from picking whichever entry made the chart prettiest in hindsight.

    2. Exit Rules

    Exits followed the exact same fixed logic as entries. Win or lose, the rule didn’t change mid-test. That’s the whole point of removing hindsight from the equation.

    3. Position Sizing

    Size was set by risk per trade, recalculated as capital changed, not a flat dollar amount pretending the account never grew or shrank.

    4. Risk Controls

    Swipe to view full data →
    Control Purpose Applied To
    Stop-loss Cap downside per trade All three strategy types
    Take-profit Lock in gains at target DCA, Grid
    Drift threshold Trigger rebalancing Rebalance only

    5. Realistic Assumptions

    Fees, slippage, and spread were built into every run, not added as an afterthought. Honestly, this is where most backtests quietly lie.

    A strategy showing strong paper returns can look a lot less exciting once real trading costs get subtracted, and that’s the version that actually matters.

    The Backtest Bot on CryptoGates applies this same cost logic automatically, so the numbers a user sees already account for friction, not a fantasy version of the market.

    Real Backtest Example


    Strategy: Grid | Coin: BNB/USDT | Market Condition: 33% post-ATH crash over 79 days | Objective: Test whether gross grid profit survives a real drawdown

    The bot fired 171 trades and generated $163.94 in grid profit — a number that looks solid in isolation.

    Once the price fell straight through the grid’s range, total ROI landed at −21.64%. That gap between gross grid profit and net portfolio result is the exact distinction this section is making: a backtest that only reports trade-level profit without accounting for unrealized exposure outside the range is reporting a fantasy number, not a real one.

    View Complete Playbook: https://cryptogates.io/playbooks/grid-bot-vs-a-33-bnb-crash-what-the-backtest-data-actually-shows/

    Validation Process

    A backtest that only works on one dataset isn’t a strategy. Ngl, it’s a coincidence wearing a strategy’s clothes.

    How much historical data do you need to backtest a crypto strategy?

    Enough to cover at least one full market cycle, bull, bear, and sideways phases included. A few months of data isn’t enough to know if a strategy survives real conditions.

    1. Avoiding Overfitting

    Parameters were kept simple on purpose.

    The temptation to tweak a setting until the equity curve looks perfect is real, and that’s exactly how a strategy ends up memorizing old price action instead of capturing something repeatable.

    Fewer moving parts. Fewer chances to accidentally curve-fit the past.

    SYSTEM ACCESS: CG4.2

    Stop Guessing.
    Stress Test Your Edge.

    The market doesn’t care about your backtest. Our engine simulates 1,000+ “what-if” scenarios to ensure your strategy is built for survival.

    Run Crypto Strategy Engine →
    ROBUSTNESS SCORE
    75+ STRUCTURAL EDGE
    RISK OF RUIN < 1%
    TARGET HIT 92%

    2. Out-of-Sample Checks

    Every strategy was checked against data it never saw during setup.

    This is the part most retail testing skips entirely. If a strategy only performs on the exact stretch of history it was built on, that’s not an edge. That’s memorization.

    Mark Douglas,
    “Every moment in the market is unique.”

    Mark Douglas

    3. Robustness Across Runs

    Interactive Checklist: Signs a Backtest Result Can Actually Be Trusted

    • Performance holds up across multiple market phases, not just one
    • Results don’t collapse when a single parameter shifts slightly
    • Fees and slippage were included from the start, not added later
    • The strategy was tested on data it never saw during setup
    • Win rate isn’t suspiciously high, above 80% usually means overfitting

    A strategy earns trust only after surviving many different runs.

    One clean chart proves almost nothing on its own. Few people actually check for this, which is probably why so many “proven” strategies fall apart within a month of going live.

    Conclusion

    A tested strategy beats a hopeful one, every single time.

    That’s the whole idea behind this process: DCA, Grid, or Rebalance, the same standard applies across the board: define the rules first, test them honestly, and only then decide if a strategy earns real capital.

    Curious how your own idea holds up?

    Run it through the Strategy Engine on CryptoGates and see what the data actually says before risking anything live.

    FAQs

    Does backtesting guarantee future profits?

    No. A backtest shows how a strategy would have performed on past data, not what it will do next. Markets change, and past patterns don’t always repeat.

    Long enough to cover a full market cycle, bull, bear, and sideways phases included. A few months of data usually isn’t enough to know if a strategy holds up.

    Backtesting runs a strategy against historical data. Forward testing runs it live, in real time, on data the strategy hasn’t seen yet. Both matter before risking real capital.

  • Best Crypto Backtesting Software 🧪 Compared 📊 to Build Better Trading Strategies 🎯

    Best Crypto Backtesting Software 🧪 Compared 📊 to Build Better Trading Strategies 🎯

    You’re about to risk real money on a crypto strategy you built off a hunch.

    Ser, that’s how most people lose their shirt.

    Here’s the thing, though. The traders who actually survive this market don’t guess. They test first.

    That’s exactly what crypto backtesting software is built for, and picking the right one might matter more than the strategy itself.

    About twice as many day traders lose money as make money, and only around 20% end up more than marginally profitable.

    Financial Analysts Journal, day trading profitability study

    Look, that number isn’t there to scare you. It’s there to explain why backtesting exists in the first place.

    This guide compares the best crypto backtesting software out there, breaks down what actually matters when you’re choosing one, and shows you where free tools hold up against paid platforms.

    EXECUTIVE SUMMARY
    • The Problem: Most traders pick backtesting software based on ads or hype, not on whether the tool actually fits how they trade.
    • The Solution: Compare tools on price, data quality, realism, and features before committing time or money to any of them.
    • The Incentive: The right software lets you test dozens of strategies risk-free and walk into live trading with actual evidence, not a feeling.
    • The Risk: A tool with bad data or unrealistic fee modeling can hand you a “winning” strategy that fails the second it hits a live market.

    What Crypto Backtesting Software Does

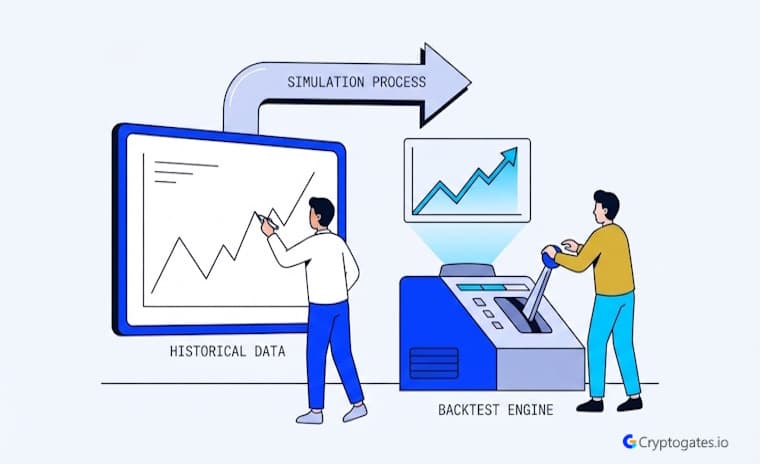
    Crypto backtesting software takes a trading strategy and runs it against historical price data to see how it would’ve performed.

    Instead of risking capital to find out if your idea works, you run it against real market history first.

    Weeks, months, even years of data get compressed into a few minutes of testing.

    HISTORICAL DATA AUDIT

    Battle-Test Your Strategy
    Before the Market Does.

    Eliminate guesswork with institutional-grade backtesting for DCA, Grid, and Rebalance bots. Real historical data. Real-world results.

    EST. OPTIMIZATION +42% ROI Efficiency
    Start Backtest Now

    Sourced from 5+ Years of Exchange Data

    Honestly, this is the part most beginners skip.

    They build a strategy in their head, feel confident about it, and jump straight into live trading. Then the market humbles them fast.

    Why Backtesting Matters Before You Risk Real Capital

    A strategy that sounds smart isn’t the same as a strategy that’s proven.

    Backtesting turns a gut feeling into something you can actually measure, and walking through a full DCA strategy backtesting process shows exactly how that measurement works in practice.

    It shows you how a DCA setup would’ve handled a 40% drawdown, or how a grid bot would’ve behaved during six months of chop. Without that step, you’re not trading.

    You’re just gambling with extra confidence.

    Real Backtest Example

    Strategy: DCA
    Coin: DOT/USDT
    Market Condition: 7-month sustained downtrend (−56%)
    Objective: Test how automated DCA absorbs a prolonged, deep drawdown versus holding spot

    One internal backtest tracked a DCA bot running against DOT through one of its worst stretches on record — a 56% decline spread across seven months. Spot holders sitting through the same window ended up down $617 on their position. The DCA bot, following the same price action, closed 79 of its 80 sessions in profit and finished the period up $380.99. Same market, same asset, nearly a thousand-dollar gap in outcome.

    Expert Interpretation: The result isn’t a claim that DCA “beats” downtrends — it didn’t turn a loss into a bigger win overall for the market itself. What it shows is that step-based entries change the shape of the exposure. A bot re-entering incrementally through a slow bleed captures small, repeatable exits that a static spot position simply can’t. This is the kind of outcome that only shows up when you actually run the numbers against real historical data, rather than assuming a strategy “should” work in a downtrend.

    View Complete Playbook — https://cryptogates.io/playbooks/how-a-dca-bot-made-381-while-polkadot-lost-56/

    This ties back to the whole idea behind CryptoGates:

    Verify first, risk later, scale slowly.

    Backtest bots like the DCA Strategy Backtest Bot exist specifically to close that gap between “I think this works” and “I know this works.”

    Why Comparing Crypto Backtesting Tools Matters

    Not every trader needs the same thing from a backtesting tool.

    A beginner testing their first DCA idea doesn’t need the same horsepower as a quant running custom scripts across ten pairs.

    But here’s the thing.

    Most people pick software based on which YouTuber promoted it, not whether it fits how they actually trade.

    Mark Douglas,
    “Market analysis will not solve the problems created by a lack of discipline and confidence.”

    Mark Douglas, Trading in the Zone

    Douglas wasn’t talking about software specifically, but the point lands anyway.

    The best backtesting tool in the world won’t save a strategy you never actually stress test. It just gives you the data.

    What you do with it is on you.

    Matching Backtesting Software to Your Trader Type

    A beginner wants something simple.

    Clear results, no coding, no steep learning curve. An advanced trader might want raw data exports, custom parameters, or API access.

    Someone focused on automation cares less about the testing interface and more about how smoothly the tool connects to live execution afterward.

    Is backtesting software necessary for crypto trading?

    It’s not legally required, obviously. But skipping it means trading on assumptions instead of evidence, and the data shows that rarely ends well for retail traders.

    None of these traders should be shopping for the same software, yet most comparison articles treat backtesting tools like a one-size-fits-all decision.

    It isn’t.

    Crypto Backtesting Software Comparison Criteria

    Before comparing specific platforms, you need a framework.

    Otherwise, you’re just comparing logos and marketing copy.

    Here’s what actually separates a useful tool from a flashy one.

    1. Price and Free Plan Availability

    This one’s simple, but it matters more than people admit.

    A $50 monthly subscription doesn’t sound like much until you’re testing five strategies across three months and burning through trial credits before you’ve learned anything useful.

    Free access changes the entire equation.

    It means you can test as many ideas as you want without watching a clock or a paywall.

    SYSTEM ACCESS: CG4.2

    Stop Guessing.
    Stress Test Your Edge.

    The market doesn’t care about your backtest. Our engine simulates 1,000+ “what-if” scenarios to ensure your strategy is built for survival.

    Run Crypto Strategy Engine →
    ROBUSTNESS SCORE
    75+ STRUCTURAL EDGE
    RISK OF RUIN < 1%
    TARGET HIT 92%

    2. Ease of Use and Learning Curve

    A powerful tool nobody can figure out isn’t powerful, it’s abandoned.

    Look for clean interfaces, clear result summaries, and a setup process that doesn’t require a coding background.

    If you’re spending more time reading documentation than testing strategies, something’s wrong.

    3. Backtest Realism: Fees and Slippage Modeling

    This is where many tools quietly fail.

    A backtest that ignores trading fees, slippage, or exchange spreads will show you a strategy that looks amazing on paper and falls apart the moment real money touches it, unlike a real BTC grid bot backtest that accounted for every fee down to the cent.

    Ngl, this is probably the single most overlooked factor in the whole comparison. Realistic modeling, especially accounting for slippage on every fill, isn’t optional. It’s the whole point.

    4. Data Quality and Exchange Support

    Garbage data in, garbage conclusions out.

    You want granular historical data, ideally down to 1-minute candles, across the exchanges and pairs you actually trade.

    A tool that only supports Bitcoin on one exchange isn’t going to help much if you trade altcoins across five different platforms.

    5. Features, Automation, and Reporting Depth

    The backtest itself is only half the value.

    Good reporting shows you drawdown depth, win rate, risk-adjusted return, and how the strategy performed across different market conditions, not just one lump sum number.

    That’s the difference between a tool that teaches you something and one that just spits out a percentage and calls it a day.

    CryptoGates Overview — The Free Crypto Strategy Backtesting Option

    CryptoGates takes a different approach than most of the tools on this list.

    There’s no signup wall, no credit card, and no capital required to start testing.

    You open the DCA, Grid, or Rebalance Backtest Bot and run your strategy against real historical market data right away.

    CEO Note:

    Zaheer, founder of CryptoGates, built the platform around one belief: verify first, risk later, scale slowly. The backtest bots exist so traders can prove a strategy works before a single dollar touches the market.

    What Makes CryptoGates’ Backtest Bots Different

    The bots run on real 1-minute OHLCV data pulled from major exchanges, not simplified daily candles that smooth over the messy parts.

    That matters because a lot of what actually breaks a strategy, like slippage during a fast move or a bad fill during high volatility, only shows up when the data is granular.

    Does free backtesting software give accurate results?

    It depends entirely on data quality and whether fees and slippage are modeled. Free doesn’t mean inferior if the underlying data and cost modeling are done right.

    You can test a DCA setup against a 40% drawdown, run a Grid bot through months of sideways chop, or stress a Rebalance strategy against sudden asset divergence.

    All without paying for the privilege of finding out your idea doesn’t hold up.

    CG STRATEGY ANALYZER

    Confused about
    market outlook?

    Trading without a plan is just gambling. Our strategy architect analyzes your risk tolerance and capital to match you with a proven algorithmic framework.

    PASSIVE DCA Bot
    AGGRESSIVE Grid Pro
    BALANCED Rebalance

    Other Crypto Backtesting Software Options Overview

    There are solid paid platforms out there too, and pretending otherwise wouldn’t be honest.

    They just come with tradeoffs CG doesn’t have.

    Popular Paid Backtesting Platforms and Their Use Cases

    Some platforms are built around Python or Pine Script, giving advanced users full control to code custom indicators and logic from scratch.

    That’s powerful, but it’s also a wall for anyone who doesn’t already know how to program.

    Research Highlight

    A pattern that shows up consistently across CryptoGates‘ internal grid strategy tests is how small a role fees actually play when the modeling is done correctly — but only when it’s tracked at all. In one BTC grid backtest through a 10.4% monthly rally, the bot logged every trade cost across the full run, closing with just $3.26 in total fees against a 7.74% return.

    That number matters less on its own and more for what it represents: a tool (or a trader) that can’t account for fees at that level of granularity isn’t giving you a real result; it’s giving you an estimate.

    Strategies that look profitable on paper frequently lose that edge once realistic trading costs are layered back in – which is exactly why fee and slippage modeling separates a backtest you can trust from one that produces an optimistic number.

    View Complete Playbook — https://cryptogates.io/playbooks/btc-grid-bot-backtest-may-2025/

    Others focus heavily on prop-firm-style testing, simulating strict drawdown rules for traders chasing funded accounts.

    A few are general-purpose charting platforms with a backtesting feature bolted on, useful if you’re already living inside that ecosystem for other reasons, but not built specifically for crypto’s weird hours and volatility patterns.

    Each one solves a real problem.

    None of them solve every problem for every trader, which is kind of the whole point of this comparison.

    Side-by-Side Crypto Backtesting Software Comparison

    Numbers make this easier than opinions.

    Here’s how CryptoGates stacks up against typical paid platforms across the criteria that actually matter.

    Swipe to view full data →
    Criteria CryptoGates Typical Paid Platforms
    Cost to Start Testing Free, no signup, no card Often $30 to $100+ monthly
    Data Granularity 1-minute OHLCV, major exchanges Varies, sometimes daily candles only
    Fee and Slippage Modeling Built into backtest bots Varies by platform, often extra setup
    Coding Required None Frequently required for full features
    Best Suited For Beginners through intermediate Advanced, custom-strategy builders
    TIP:

    “There’s no sense in being precise when you don’t even know what you’re talking about.” – John von Neumann

    That line was about math, not crypto, but honestly it fits perfectly here.

    A backtest that looks precise down to the decimal point means nothing if the underlying data or fee model was never realistic in the first place.

    Precision without accuracy is just noise dressed up as confidence.

    1. Where CryptoGates Wins on Value

    Zero cost to test unlimited strategies is a real advantage, not a marketing line.

    Beginners and budget-conscious traders get the exact same data quality and fee modeling that a paid platform would charge for, without the barrier of a subscription standing between them and their first real strategy test.

    2. Where Paid Tools Offer Advanced Features

    Custom scripting in Python or Pine Script gives advanced users room to build indicators from scratch.

    If you’re already deep into quant-style strategy design and need that flexibility, a paid tool might be worth the cost. That’s a small slice of traders, though.

    Most people never touch those features even when they’re paying for them.

    Best Crypto Backtesting Software by User Type

    Let’s break this down by who you actually are, not who the marketing assumes you are.

    Interactive Checklist

    • Best for beginners: A free, no-code tool with clear results and simple setup
    • Best for budget-conscious traders: A platform offering unlimited free tests with real historical data
    • Best for advanced traders: A tool with custom scripting and raw data export
    • Best for automation-focused users: A platform that connects tested strategies directly to execution

    Automation readiness isn’t just about having a “connect to exchange” button.

    It’s about whether the backtest itself accounted for the same fees and conditions the live bot will face.

    If those two don’t match, you’re automating a strategy that was never actually validated.

    1. Best for Beginners

    If you’ve never backtested anything before, complexity is your enemy.

    A free tool with a clean interface removes the two biggest reasons beginners quit before they learn anything: cost anxiety and confusion.

    2. Best for Budget-Conscious Traders

    This one’s simple.

    Why pay for testing when the free version gives you the same real data and the same fee modeling?

    Save the money for when you’re actually ready to deploy capital, not for the testing phase.

    3. Best for Advanced Traders

    If you’re running multi-variable strategies with custom logic, a scripting-capable paid tool might genuinely serve you better.

    There’s no shame in that. Different tools for different jobs.

    4. Best for Automation-Focused Users

    Look for a platform where the backtest bot and the execution layer speak the same language.

    CryptoGates’ DCA, Grid, and Rebalance Backtest Bots are built with that connection in mind, so the strategy you test is the strategy you’d actually run live.

    Final Verdict: Choosing the Right Crypto Backtesting Software

    Here’s the simple truth.

    The best crypto backtesting software isn’t the one with the most features or the biggest name.

    It’s the one that proves whether your strategy actually holds up before you risk a single dollar on it.

    For most traders, especially beginners and anyone watching their budget, that means starting with a free, real-data option before ever reaching for a paid subscription.

    CONFIDENTIAL // RESEARCH
    STRATEGY INTELLIGENCE

    Proven Setups &
    Expert Breakdowns.

    We don’t just show you the data; we engineer and validate high-performance strategies, providing the “Alpha” behind the numbers.

    CryptoGates gives you that starting point.

    No signup, no credit card, no capital needed.

    Just open the DCA, Grid, or Rebalance Backtest Bot and see what your strategy actually does against real market history.

    If you eventually outgrow it and need custom scripting or institutional-grade tooling, that’s a fine reason to move to a paid platform.

    But test that assumption first instead of assuming it.

    FAQs

    Is crypto backtesting software worth using before live trading?

    Yes. It replaces guesswork with evidence, showing how a strategy would’ve handled real market conditions before any capital is at risk.

    Yes, several tools including CryptoGates require no coding at all. You set parameters, run the test, and read the results.

    Accuracy depends on data quality and fee modeling, not price. A free tool with real historical data and realistic slippage can outperform a paid one that skips those details.

  • DCA Strategy Backtesting 📊 Explained: Test Every Strategy 🧪 Before Investing Real Money 💰

    DCA Strategy Backtesting 📊 Explained: Test Every Strategy 🧪 Before Investing Real Money 💰

    Most DCA plans aren’t really strategies.

    They’re guesses wearing a strategy costume. You pick a coin, pick a schedule, and hope it works out. Sound familiar?

    Here’s the thing. DCA strategy backtesting fixes that gap.

    Instead of hoping your weekly buys will average out nicely over time, you run the plan against real historical price data and watch what actually would’ve happened.

    Bull runs, brutal drawdowns, dead sideways chop, all of it.

    EXECUTIVE SUMMARY
    • The Problem: Most people build a DCA plan on gut feeling and never check if it would’ve survived a real market cycle.
    • The Solution: Backtest the exact rules on historical price data before committing real capital to them.
    • The Incentive: You walk away with actual numbers on drawdown, average cost, and returns instead of a hopeful guess.
    • The Risk: Skipping this step means you’re basically trading blind and calling it a plan.

    This guide walks through the full process.

    Setup, metrics, step by step execution, and the mistakes that quietly wreck otherwise decent backtests.

    What Is DCA Backtesting?

    Backtesting, in plain terms, means running your strategy on the past to see how it would’ve performed.

    For DCA specifically, that means simulating your buy schedule against real historical price data instead of an imagined chart that only ever goes up.

    Vanguard research on rolling 10-year periods found that lump sum investing outperformed a 12-month DCA schedule in roughly two-thirds of cases, with an average return gap of around 2.3%. Vanguard

    That stat is from traditional markets, not crypto.

    But it makes the point well.

    Assumptions about how a strategy “should” perform often don’t match what the data shows.

    That’s exactly why historical testing and strategy validation matter more than intuition.

    A proper performance analysis tells you what your specific rules would’ve actually produced, not what sounds reasonable on paper.

    HISTORICAL DATA AUDIT

    Battle-Test Your Strategy
    Before the Market Does.

    Eliminate guesswork with institutional-grade backtesting for DCA, Grid, and Rebalance bots. Real historical data. Real-world results.

    EST. OPTIMIZATION +42% ROI Efficiency
    Start Backtest Now

    Sourced from 5+ Years of Exchange Data

    Why Backtesting a DCA Strategy Matters

    Look, DCA sounds simple.

    Buy a set amount on a set schedule, no matter what price does.

    But sticking to that plan during a 40% drawdown is a lot harder in practice than it sounds on a whiteboard.

    CEO Note:

    Zaheer says testing a plan before funding it isn’t optional caution, it’s the whole point. “Verify first. Risk later. Scale slowly.”

    Backtesting takes the emotion out before it ever becomes a problem.

    You see, in advance, how the plan behaves when the market dumps.

    That builds the kind of long-term confidence that actually holds up when things get ugly, instead of confidence that evaporates the first red candle.

    Does backtesting guarantee future DCA results?

    No. It shows how a strategy performed on past data only. Markets change, and past patterns don’t repeat exactly, so backtesting informs decisions rather than predicting outcomes.

    Backtesting also sharpens the parts of a DCA plan people usually skip past.

    Timing of buys, how much capital goes in per interval, even which asset gets picked in the first place.

    Getting risk management right here, using actual data instead of a hunch, is what separates a strategy from a guess.

    Real Backtest Example

    Strategy: DCA
    Coin: DOT/USDT
    Market Condition: Sustained 7-month downtrend (−56%)
    Objective: Test whether a fixed-interval DCA schedule holds up through a genuine “falling knife,” not a short dip

    Key Result: Of 80 total sessions run against the full drawdown, 79 closed in profit. The strategy still finished ahead of spot holding by roughly $998 over the same starting capital, even though the underlying asset lost more than half its value.

    Expert Interpretation: This is the kind of test window the article warns readers not to skip. A three-month backtest during calm price action would never surface how a DCA schedule behaves when an asset is in genuine freefall for months at a time. Testing across a full, painful cycle — not just a convenient slice of it — is what separates a validated strategy from an assumption.

     View Complete Playbook: DOT Crashed 56% in 7 Months

    What You Need Before You Backtest

    Before you run any DCA strategy backtesting, a few pieces need to be locked in.

    Skip this setup and your results won’t mean much, no matter how clean the tool is.

    You’ll need to pick your asset, your buy schedule, and your rules for the actual buys.

    Sounds simple.

    Most people still get it wrong by winging the details instead of writing them down first.

    Interactive Checklist: What to Decide Before You Backtest

    • Choose the coin or portfolio you’ll test (BTC, ETH, or a diversified mix)
    • Select your buy frequency: daily, weekly, or monthly
    • Set the investment amount for every recurring purchase
    • Define a long enough testing period to capture multiple market cycles
    • Include realistic trading fees and slippage in your assumptions

    Here’s the thing.

    A lot of backtests fail before they even start because someone forgot to account for exchange fees or assumed perfect fills.

    Real market data includes friction. Your setup should too.

    SYSTEM ACCESS: CG4.2

    Stop Guessing.
    Stress Test Your Edge.

    The market doesn’t care about your backtest. Our engine simulates 1,000+ “what-if” scenarios to ensure your strategy is built for survival.

    Run Crypto Strategy Engine →
    ROBUSTNESS SCORE
    75+ STRUCTURAL EDGE
    RISK OF RUIN < 1%
    TARGET HIT 92%

    How to Backtest a DCA Strategy Step by Step

    Once the setup’s locked, the actual process breaks down into five steps.

    None of them are complicated on their own.

    Skip one and the whole test loses credibility.

    Step 1: Select the Asset

    Pick something with enough trading history and liquidity behind it.

    A coin that only has a few months of data, or barely trades, won’t give you a fair read on how DCA performs across real cycles.

    Stronger assets, the ones that have actually survived a full bull and bear cycle, give results you can trust more.

    Testing a low cap gem with three weeks of price history isn’t really testing anything.

    Step 2: Set the DCA Rules

    Define your buy amount, how often you buy, and how long the strategy runs.

    If you’re adding any dynamic conditions, like buying more during a dip, write that rule down clearly too.

    Vague rules give you vague results.

    “Buy sometimes when it feels low” isn’t a rule you can test.

    Step 3: Load Real Market Data

    This is where a lot of DIY backtests quietly fall apart.

    Real market data includes volatility, sharp drawdowns, and trend shifts that a smooth, idealized chart never shows you.

    If your data doesn’t include the ugly parts, the chop, the nuked candles, the slow bleeding sideways months, your results are basically fiction.

    Step 4: Run the Backtest

    Now simulate the recurring buys across your chosen time period.

    Watch how your average entry price shifts as prices move up and down.

    This is the part where the plan actually meets history instead of staying theoretical.

    Step 5: Review the Results

    Check total invested, current portfolio value, average cost, and max drawdown.

    Then compare that against a different schedule, like switching from weekly to monthly buys, to see what actually changes.
    Look, the review step is where most of the real insight lives.

    It’s not glamorous.

    But it’s where you learn if the strategy earned its place or just got lucky.

    CG STRATEGY ANALYZER

    Confused about
    market outlook?

    Trading without a plan is just gambling. Our strategy architect analyzes your risk tolerance and capital to match you with a proven algorithmic framework.

    PASSIVE DCA Bot
    AGGRESSIVE Grid Pro
    BALANCED Rebalance

    Key Metrics to Measure in DCA Backtesting

    A handful of numbers separate a real DCA strategy from a hopeful guess.

    Once your backtest runs, these are the ones worth actually looking at.

    Swipe to view full data →
    Metric What It Tells You Why It Matters
    Average Purchase Price Your true cost basis across all buys Shows whether your entry timing improved or hurt your average cost.
    Total Invested Capital How much money actually went into the strategy Provides the foundation for evaluating every other performance metric.
    Final Portfolio Value What your invested capital grew into Represents the overall outcome of the backtest.
    Maximum Drawdown The largest decline your portfolio experienced Helps determine whether you could realistically stay invested.
    Return on Investment (ROI) Your total gain or loss expressed as a percentage The primary metric used to compare overall strategy performance.

    ngl, most beginners only check the last row.

    But strategy efficiency isn’t just about the final return.

    It’s whether the drawdown along the way would’ve actually made you panic sell.

    Mark Douglas,
    “The consistency you seek is in your mind, not in the markets.”

    Mark Douglas, author of Trading in the Zone

    That line hits different once you’ve backtested a few DCA setups.

    The data doesn’t lie to you the way your own fear does mid-drawdown.

    Tracking capital growth against these metrics, not vibes, is what actually tells you if the plan works.

    What’s a good return to expect from DCA backtesting?

    There’s no fixed number.

    A “good” result depends on the asset, timeframe, and how much drawdown you’re willing to accept along the way.

    Best Market Conditions to Test

    Here’s the thing most people skip.

    A strategy that only looks good in one type of market isn’t really tested yet.

    Bull markets are the easy case.

    DCA tends to look great when everything’s sending upward anyway, since almost any buying schedule benefits from a rising trend.

    Bear markets are the real test.

    This is where you find out if steady accumulation during a nasty drawdown actually lowers your average cost enough to matter, or if it just slow bleeds your capital alongside the market.

    Sideways, chopped markets are the sneaky one.

    DCA tends to smooth out the noise here better than people expect, since you’re buying at a mix of highs and lows without ever trying to time either.

    Historical S&P data shows the market has posted positive returns in roughly 73% of calendar years going back close to a century.

    Vanguard research

    That stat’s from traditional markets, but crypto cycles behave the same way structurally.

    Testing your DCA plan across a bull run, a bear market, and a chop zone gives you the full picture.

    Testing it in just one condition tells you almost nothing about how it survives the other two.

    Common Mistakes in DCA Backtesting

    Look, most DCA backtests aren’t wrong because of bad math.

    They’re wrong because of bad assumptions baked in from the start.

    The biggest one?

    Using unrealistic assumptions about fills and pricing.

    If your test assumes perfect execution every single time, you’re basically testing a fantasy version of the market, not the real one.

    Ignoring fees and slippage is right behind it.

    Even small trading fees add up fast when you’re buying weekly or daily over a long stretch.

    Skip that math and your “profitable” strategy might actually be printing losses once real costs get factored in.

    Can a DCA backtest predict future crypto prices?

    No. It shows how a strategy would’ve performed on past data only. It’s a tool for testing logic, not a prediction engine.

    Here’s another one. Testing too short a time range.

    A DCA plan tested over three months during a calm chop tells you basically nothing about how it handles a real drawdown. ngl, this is probably the most common mistake beginners make, because short tests feel faster and more convenient.

    Choosing weak assets without real trading history is its own trap too.

    And maybe the most dangerous mistake of all: treating backtest results like a guarantee.

    A strategy that returned well in the past isn’t promised to repeat that. Markets shift.

    Conditions change. Past performance is context, not a crystal ball.

    REF: VOL-NEUTRAL-2026

    Neutralize Volatility.
    Own the Growth.

    Access systematic playbooks designed to eliminate emotional bias. From Spot HODL frameworks to advanced Grid simulators.

    ◒
    Spot & HODL
    ◈
    DCA Engine
    ▦
    Grid Tactics
    ☯
    Rebalance

    Why Use DCA Backtesting Bot

    Manual backtesting works.

    Ngl though, it’s slow, and it’s easy to mess up the math by hand, especially once fees, slippage, and multiple time periods get involved.

    This is where a dedicated tool actually earns its keep.

    The DCA Backtest Bot on CryptoGates lets you plug in your rules, real market data, and get results back without building a spreadsheet from scratch every time.

    Ryan Sean Adams
    “Dollar cost average in, crypto and cash are all you need.”

    Ryan Sean Adams, Bankless co-founder

    Honestly, that’s the whole philosophy behind DCA in one line.

    Keep it simple, keep it systematic.

    A tool that lets you test that simplicity against real data, fast, is what turns a decent idea into something you can trust with actual capital.

    Setup takes minutes, and comparing different schedules side by side is a lot easier than juggling five spreadsheet tabs.

    This connects straight back to the CG belief: verify first, risk later. A DCA Backtesting Bot doesn’t replace your judgment.

    It just gives that judgment something real to stand on.

    How to Improve Your DCA Strategy After Backtesting

    So the backtest’s done. Now what?

    Honestly, this is where a lot of people just stop, save the screenshot, and forget the whole thing was a starting point, not a finish line.

    Here’s the thing. A backtest tells you what happened under one set of rules.

    Change the rules a little, and the results shift too. That’s not a flaw, that’s the whole point of testing in the first place.

    CONFIDENTIAL // RESEARCH
    STRATEGY INTELLIGENCE

    Proven Setups &
    Expert Breakdowns.

    We don’t just show you the data; we engineer and validate high-performance strategies, providing the “Alpha” behind the numbers.

    Start by adjusting the obvious levers. Buy amount, buy frequency, total duration.

    Small changes here can move your average cost more than people expect.

    Then compare weekly versus monthly buying on the same asset over the same window.

    Sometimes weekly smooths things out better.

    Sometimes monthly wins because fewer transactions means less fee drag.

    You won’t know until you actually run both.
    Wait, there’s one more layer worth doing.

    Test the same rules across a completely different asset, or a different market period.

    A setup that looked solid during one stretch of chop might get clapped during a real trend.

    Refining based on what the data shows, not on a gut feeling that the last version “felt right,” is the whole game here.

    Reality Check

    Common belief: DCA is a defensive strategy, so it should outperform buy-and-hold in most conditions.

    What CryptoGates research found: In one internal backtest, a DCA bot ran through a month where BTC rallied 14.5%. It closed 8 of 9 sessions in profit — a technically clean result — but simple buy-and-hold still beat it by roughly $120 over the same window, because DCA’s staggered entries can’t fully capture a sharp, sustained rally.

    Why it matters: A backtest that only covers downtrends or sideways chop will never reveal this trade-off. Running the same rule set through a strong bull period, exactly as this section recommends, is what shows whether a strategy is genuinely balanced or just well-suited to the one market condition it happened to be tested in.

    View Complete Playbook: BTC Ran +14.5% and Our DCA Bot Only Made $40

    Should I change my DCA strategy after one backtest?

    Not really.

    One test shows one scenario.

    Running it across a few different time periods and assets gives a fuller, more honest picture.

    DCA Backtesting vs Live Investing

    Look, backtesting and live investing aren’t the same animal, even though people talk about them like they are.

    Backtesting is for testing an idea in a clean environment. No stress, no fear, no 3am portfolio checking. Just the strategy against real historical price data, cold and simple.

    Live investing adds everything a backtest can’t simulate. Slippage that’s worse than expected. Market pressure.

    And honestly, the emotional pull to abandon the plan the moment things get red.

    A strategy can pass every backtest with flying colors and still fail live, purely because the trader panic sold at the wrong candle.

    LIVE DATA FEED // UNFILTERED

    The Truth in Numbers.

    Designed for the 10% who require absolute clarity. We strip away the hype to reveal the structural reality of the crypto markets.

    11.6M TOKENS DEFUNCT (2025)
    “The Illusion of the Infinite Pump.” Most assets are designed to fail. We track the ones that don’t.
    ⚠ Shocking Crypto Statistics

    Neither one replaces the other.

    Backtesting proves the logic holds up on paper.

    Live investing tests whether you can actually stick to that logic when real money and real feelings are involved.

    Skip the first step, and you’re basically trading blind.

    Skip the discipline part, and the best backtest in the world won’t save you.

    Test the Plan Before You Trust It With Real Money

    So here’s where it all comes together.

    DCA strategy backtesting isn’t some extra step for perfectionists.

    It’s the difference between trading on a hunch and trading on proof.

    Real market data shows you the drawdowns, the chop, the slow bleeding months your gut never accounted for.

    Honestly, most bagholders aren’t bad traders.

    They just never tested the plan before funding it.

    That’s the whole gap CryptoGates exists to close.

    Run your own parameters and see what the data shows. The DCA Backtest Bot on CryptoGates makes this whole process quick, and you don’t need to guess your way through it.

    FAQs

    How long should a DCA backtest period be?

    Longer is usually better. A full cycle, covering a bull run, a drawdown, and some chop, gives a far more honest picture than a few months of calm price action.


    Not really. Assets with more history and stronger liquidity tend to give cleaner, more reliable results than newer or thinly traded coins.


    No. Backtesting shows how a plan handled the past. Live trading adds fees, slippage, and emotion, so results can and often do differ.

  • Crypto Trading Strategy Comparison 📊: Choose the Right Strategy 🎯 for Your Trading Style 📈

    Crypto Trading Strategy Comparison 📊: Choose the Right Strategy 🎯 for Your Trading Style 📈

    You’ve probably asked yourself this at 2 am while staring at a red candle: Which crypto trading strategy actually works?

    Ser, you’re not alone.

    Most traders bounce between DCA, Grid, Rebalance, and five other setups without ever running a real crypto trading strategy comparison first.

    They just copy whatever CT is hyping that week. Here’s the thing, though.

    The strategy that printed for some anon on Twitter might be the exact one that gets you rekt, because your risk tolerance, your capital, and your time aren’t the same as theirs.

    A survey of 1,005 retail crypto traders published by NFTEvening found that 84% lost money in their first year, and day trading alone caused 54% of those losses.

    That’s not a market problem.

    That’s a strategy-fit problem.

    Especially when 97% of day traders lose money before reaching their second year because they relied on luck over a structured framework.

    This guide breaks down eight major strategies, side by side, so you can finally see which one matches your personality, your capital, and the market you’re actually trading in right now, helping you escape the statistics where 21% of crypto owners report net losses on their holdings.

    EXECUTIVE SUMMARY
    • The Problem: Most traders pick a strategy because it’s trending on CT, not because it fits their risk profile or the current market.
    • The Solution: A direct, side-by-side crypto trading strategy comparison across DCA, Grid, Rebalance, Buy & Hold, Swing, Trend, Mean Reversion, and Breakout.
    • The Incentive: Clarity means fewer emotional decisions, fewer wasted trades, and a system built for survival instead of guesswork.
    • The Risk: Even the “right” strategy on paper can fail if it’s never been tested against real historical data first.

    How to Compare Crypto Trading Strategies

    Look, before we jump into DCA vs Grid vs everything else, you need one thing first: a fair way to judge them.

    Ngl, most comparison content skips this part completely. They just tell you Grid is “better” without explaining better for whom, or under what conditions.

    Here’s the framework we’ll use for every single pairing in this crypto trading strategy comparison.

    Six factors. Same six, every time, so you’re not comparing apples to candles.

    Interactive Checklist: Before Picking Any Strategy

    • What’s my real risk tolerance, not my hoped-for one?
    • How much capital am I actually willing to commit?
    • How many hours a week can I realistically give this?
    • What’s the current market structure: trending, ranging, or chaotic?
    • Have I tested this on historical data, or am I just vibing?

    Risk level. How much can this strategy actually lose you, and how fast?

    Capital requirement. Some setups need a real size to work well.

    Others run fine on lunch money.

    Complexity.

    Is this something you set once, or something you babysit?

    Time commitment. Daily attention or weekly glance?

    Execution style. Manual, semi-automated, or fully bot-driven?

    Market fit.

    Does this thing even work in the market condition you’re in right now?

    HISTORICAL DATA AUDIT

    Battle-Test Your Strategy
    Before the Market Does.

    Eliminate guesswork with institutional-grade backtesting for DCA, Grid, and Rebalance bots. Real historical data. Real-world results.

    EST. OPTIMIZATION +42% ROI Efficiency
    Start Backtest Now

    Sourced from 5+ Years of Exchange Data

    Trade Frequency, Time Commitment & Emotional Pressure

    Some strategies want your attention every hour.

    Others run quietly in the background for weeks.

    Honestly, this is the factor most beginners ignore, and it’s the one that burns them out fastest.

    Trading psychology matters here just as much as the setup itself.

    Emotional discipline, passive versus active trading, and execution style all tie back to how much pressure a strategy puts on your head, not just your wallet.

    DCA vs Grid Trading – Which Accumulation Strategy Wins?

    DCA builds a position slowly, patiently, over time.

    Grid trading profits from price bouncing inside a range. Different tools.

    Different jobs.

    Let’s break both down before we compare them.

    1. What Is Dollar-Cost Averaging (DCA)?

    Dollar cost averaging is a systematic accumulation strategy.

    You buy at fixed intervals, regardless of price, which spreads your entries and lowers your average cost over time.

    Mark Douglas,
    “The consistency you seek is in your mind, not in the markets.”

    Mark Douglas, author of Trading in the Zone

    No timing skill required.

    That’s kind of the point.

    A DCA bot automates this so you’re not manually clicking buy every week like it’s a chore.

    2. What Is Grid Trading?

    Grid trading sets a price range, splits it into levels, and automates buy-low-sell-high orders inside that band.

    It thrives on volatility and sideways chop.

    When price oscillates without a clear trend, a grid bot just keeps farming those small moves over and over.

    3. DCA vs Grid – Key Differences

    01

    DCA Strategy

    • Works across time with scheduled, recurring investments.
    • Simple and mostly passive, focused on long-term accumulation.

    02

    Grid Strategy

    • Works across price using predefined buy and sell levels.
    • More active, aiming to capture repeated profits inside a trading range.

    4. Best Use Cases for DCA and Grid Bots

    DCA fits long-term conviction plays. If you believe in an asset for over a year or more and don’t want to time entries, DCA smooths that out.

    Grid fits choppy, sideways, high-volatility markets where price refuses to commit to a direction, as demonstrated when XRP went sideways for three months while our grid bot accumulated handsomely.

    Wrong tool, wrong market, and you’ll end up frustrated watching a grid bot sit idle during a strong trend, or watching a DCA plan bleed through a prolonged downtrend with no bottom in sight—though past results show how we successfully DCA’d into Polkadot’s worst downtrend to turn a falling knife into a winning position.

    CONFIDENTIAL // RESEARCH
    STRATEGY INTELLIGENCE

    Proven Setups &
    Expert Breakdowns.

    We don’t just show you the data; we engineer and validate high-performance strategies, providing the “Alpha” behind the numbers.

    Is DCA better than Grid trading in a bear market?

    DCA tends to hold up better in a sustained downtrend since it keeps lowering your average cost. Grid bots can struggle if price breaks below the set range entirely.

    5. Real-World Example: DCA vs Grid in Action

    Picture a 40% drawdown.

    One trader keeps adding a fixed amount every week regardless of the red candles, lowering their average cost as the price falls.

    Another trader, running a grid bot in the same coin, profits off every bounce between support and resistance during that same stretch.

    Same market.

    Two completely different outcomes, both valid, depending on the trader’s goal.

    Real Backtest Example

    Strategy: DCA
    Coin: ETH
    Market Condition: 46-day, 32% drawdown
    Objective: measure whether spreading entries over time actually softens a fast, sustained decline

    When ETH shed roughly $1,400 in under seven weeks, a fixed-interval DCA approach lost 1.81% against a straight buy-and-hold loss north of 6% on the same capital. The bot didn’t call the bottom, and it didn’t need to — every scheduled buy simply lowered the average cost basis as price kept falling.

    Expert Interpretation: The gap isn’t proof DCA “wins” in every crash. It’s proof that removing timing decisions from a bad market caps the damage rather than eliminating it. That distinction matters more than the headline number.

    View Complete Playbook: ETH Crashed 32% in 46 Days – Our DCA Bot Lost Only 1.81%

    You can actually run both of these scenarios yourself using the DCA Backtest Bot on CryptoGates before deciding which fits your situation better.

    Grid vs Rebalance – Tactical Trading vs Portfolio Discipline

    Grid trades price movement inside bands.

    Rebalancing manages exposure across your entire portfolio. Ngl, people mix these up a lot because both sound “automated” and “systematic.”

    But they’re solving completely different problems.

    1. What Is Portfolio Rebalancing?

    Rebalancing means resetting your portfolio back to its target asset allocation once it drifts.

    Say you set 60% BTC, 40% stables.

    If BTC pumps hard, that ratio can quietly shift to something way riskier than you signed up for.

    A 60/40 portfolio left untouched for roughly a decade can drift to nearly 80/20 as one asset class keeps outperforming the other.
    Vanguard Research

    Here’s the issue.

    Most people don’t notice this drift until a crash hits and they’re holding way more risk than they thought.

    “Most traders don’t lose because the market turned against them. They lose because their portfolio quietly turned into something they never agreed to hold. Rebalancing isn’t exciting. It’s discipline dressed up as a strategy.”

    ZAHEER, CEO CryptoGates

    2. Grid vs Rebalance – Key Differences

    01

    Grid Strategy

    • Trade-execution heavy, placing frequent buy and sell orders inside a defined price range.
    • Profits from repeated price swings, making it a tactical, short-term trading strategy.

    02

    Rebalance Strategy

    • Portfolio-allocation focused, adjusting asset weights to maintain your target allocation.
    • Manages long-term portfolio exposure, making it a strategic approach rather than an active trading system.

    3. Best Use Cases for Grid and Rebalance Strategies

    Grid fits range-bound markets where you’re actively managing a single asset’s chop.

    Rebalance fits diversified portfolios where you care more about long-term structure than catching every swing.

    4. Real-World Example: Grid vs Rebalance

    One trader runs a grid bot on a volatile altcoin, farming the range all week.

    A different investor holds BTC, ETH, and stables, and rebalances back to target weights after BTC makes a big move.

    Two totally different games, both disciplined, both data-driven instead of emotional.

    Real Backtest Example

    Strategy: Rebalance
    Assets: SOL / ETH
    Market Condition: simultaneous two-asset collapse (SOL −32%, ETH −48%) over roughly two months
    Objective: test whether rebalancing between two falling assets helps or just adds transaction cost to a loss

    A passive 50/50 holder of this pair would have absorbed close to a 29% portfolio loss. The rebalance bot, cycling capital between the two as their ratio drifted, ended down about $287 less – beating the do-nothing outcome without ever going net positive.

    Expert Interpretation: This is the honest version of what rebalancing actually promises. It’s not a hedge against a shared downturn, and it won’t turn two losing assets into a gain.

    What it does is keep exposure closer to target instead of letting the worse-performing asset’s decline quietly define the whole portfolio.

    View Complete Playbook: SOL −32%. ETH −48%. Our Rebalance Bot Lost $287 — and Still Beat Doing Nothing

    You can model both scenarios using the Grid Backtest Bot and the Rebalance Backtest Bot on CryptoGates before committing real capital.

    SYSTEM ACCESS: CG4.2

    Stop Guessing.
    Stress Test Your Edge.

    The market doesn’t care about your backtest. Our engine simulates 1,000+ “what-if” scenarios to ensure your strategy is built for survival.

    Run Crypto Strategy Engine →
    ROBUSTNESS SCORE
    75+ STRUCTURAL EDGE
    RISK OF RUIN < 1%
    TARGET HIT 92%

    DCA vs Buy & Hold – Timing Risk vs Simplicity

    DCA reduces timing risk by spreading entries out.

    Buy and hold is simpler, but honestly, it leaves you way more exposed to when you actually pull the trigger.

    1. What Does Buy & Hold Mean in Crypto?

    Buy and hold means you enter once, then just… hold.

    No rebalancing, no re-entry, just conviction and patience.

    Diamond hands, basically, through the pumps and the dumps alike.

    2. DCA vs Buy & Hold – Key Differences

    01

    DCA Strategy

    • Spreads entries across time instead of investing all at once.
    • Reduces market timing risk by averaging the purchase price over multiple buys.

    02

    Buy & Hold Strategy

    • Typically enters the market with a single purchase and holds long term.
    • Simpler to manage but fully exposed to the entry price and any immediate drawdown.

    3. Best Use Cases for DCA and Buy & Hold

    DCA fits situations where you’re unsure about entry timing, which, let’s be real, is most of the time for most people.

    Buy and hold fits strong long-term conviction plays where you don’t want to actively manage anything.

    Which is safer for beginners, DCA or Buy and Hold?

    DCA tends to feel safer for beginners since it removes the pressure of picking one perfect entry point. Buy and hold works better once you already have strong conviction.

    4. Real-World Example: DCA vs Buy & Hold

    One user buys BTC every month regardless of price.

    Another buys once and holds for years.

    Same asset, same time horizon, even, but completely different ride along the way.

    Swing Trading vs Trend Following – Timing vs Discipline

    Swing trading chases the next meaningful move.

    Trend following just rides whatever wave is already happening, for as long as it lasts.

    Honestly, these two get lumped together a lot, but the mindset behind them is pretty different.

    1. What Is Swing Trading?

    Swing trading means capturing medium-term price moves using technical levels and momentum.

    You’re not holding for months.

    You’re not scalping minute candles either.

    It’s the middle ground, patient enough to wait for a setup, active enough to actually manage it.

    2. What Is Trend Following?

    Trend following means riding the main directional move for as long as it keeps going.

    No predicting the top.

    No predicting the bottom.

    Just staying in while the trend holds and getting out when the structure breaks.

    Research across multiple asset classes published by the EFMA found that trend following cuts portfolio volatility by roughly 40 to 50% compared to equally weighted portfolios.
    EFMA trend following research

    3. Swing vs Trend – Key Differences

    01

    Swing Trading

    • Focuses on capturing the next meaningful price move.
    • Requires precise entries and exits with strong market timing.

    02

    Trend Following

    • Stays in winning trades for as long as the trend remains intact.
    • Demands patience and discipline to ignore normal pullbacks.

    4. Best Use Cases for Swing and Trend Strategies

    Swing fits traders who can actually monitor price action regularly.

    Trend following fits traders chasing the big macro moves, the ones who’d rather miss the first 10% of a move than fake-out their way into ten failed entries.

    5. Real-World Example: Swing vs Trend

    A swing trader enters after a pullback, targets the next resistance, and closes out.

    A trend follower stays in through multiple higher highs, ignoring the noise in between.

    Same asset. Same trend even. Wildly different holding periods.

    Mean Reversion vs Breakout Trading – Snapback vs Continuation

    Mean reversion bets that price snaps back to average.

    Breakout trading bets the opposite, that price keeps going once it escapes a level.

    Wait, that sounds contradictory, but both can be right, just in different market conditions.

    1. What Is Mean Reversion Trading?

    Mean reversion assumes price often returns to its average after stretching too far in one direction.

    It works well when a market is range-bound or clearly overextended, kind of like a rubber band that’s been pulled too tight.

    2. What Is Breakout Trading?

    Breakout trading enters when price escapes a key level, usually with rising volume behind it.

    It thrives when volatility expands and momentum actually follows through instead of fading.

    3. Mean Reversion vs Breakout — Key Differences

    01

    Mean Reversion

    • Trades price moves back toward the average within a range.
    • Performs best in sideways or range-bound market conditions.

    02

    Breakout

    • Trades the move after price breaks out of a key range or pattern.
    • Works best during strong expansion phases and trending markets.

    4. Best Use Cases for Mean Reversion and Breakout

    Mean reversion fits sideways markets and overextended moves.

    Breakout fits strong momentum and real volume expansion, not just a wick that fades in ten minutes.

    5. Real-World Example: Mean Reversion vs Breakout

    A coin keeps bouncing between the same support and resistance for weeks.

    A different coin finally breaks resistance on strong volume and just keeps climbing.

    Same chart pattern at first. Two completely different endings.

    You can stress test which of these fits your read on the market using the Strategy Engine on CryptoGates, which runs thousands of scenario simulations before you risk anything real.

    Which Crypto Trading Strategy Fits Which Trader Personality?

    Honestly, this is the part most guides skip completely.

    They’ll tell you Grid trading is great, but never ask if you’re even wired for active management.

    Strategy fit depends on temperament just as much as market conditions.

    Larry Fink, BlackRock
    “Humans have a greater fear of loss than enjoyment of success.”

    Larry Fink, BlackRock CEO

    Low risk, patient traders usually gravitate toward DCA, Buy & Hold, and Rebalance.

    These are the “set it and check in occasionally” crowd.

    Active traders lean toward Grid, Swing, and Breakout, the ones who don’t mind watching charts and adjusting on the fly.

    Analytical traders, the ones who love rules and backtests more than gut feel, tend to land on Trend Following and Mean Reversion.

    CG STRATEGY ANALYZER

    Confused about
    market outlook?

    Trading without a plan is just gambling. Our strategy architect analyzes your risk tolerance and capital to match you with a proven algorithmic framework.

    PASSIVE DCA Bot
    AGGRESSIVE Grid Pro
    BALANCED Rebalance

    That single line explains a lot of bad strategy switching, actually.

    People abandon a perfectly good system after one losing streak, not because the system broke, but because the loss felt heavier than the wins ever did.

    Wait, that’s kind of the whole point of this section.

    Trader personality, not just market condition, decides whether a strategy sticks or gets abandoned in month two.

    Which Crypto Strategy Fits Which Market Condition?

    Here’s the thing. Matching a strategy to your personality only gets you halfway there.

    You also need to match it to whatever market regime is actually happening right now.

    1. Which Trading Strategies Perform Best in Different Market Conditions?

    In a bull market, DCA, Buy & Hold, Trend Following, and Breakout tend to shine, since price is generally cooperating with you.

    In a bear market, DCA, Rebalance, and cautious Mean Reversion setups tend to hold up better, especially DCA since it keeps lowering your average cost through the pain.

    Sideways or chop-heavy markets favor Grid, Mean Reversion, and Rebalance, strategies that don’t need a clean trend to function.

    Research Highlight

    A pattern worth noting from CryptoGates’ Grid Playbooks: the strategy’s edge tends to widen, not narrow, the flatter the market gets. In one 90-day window where XRP opened and closed within a single cent of itself – effectively a dead flat, a grid bot still fired 875 trades and returned 27.74%, against a buy-and-hold result of 0.24% on identical capital.

    This isn’t a case of the bot predicting direction. There was no direction to predict. The return came entirely from harvesting the small, repeated oscillations that a static hold position simply can’t monetize. It’s a useful data point for anyone assuming a “boring” chart means a “boring” strategy result.

    View Complete Playbook: XRP Went Nowhere for 3 Months

    High volatility markets favor Grid, Breakout, and selective Swing setups that can actually capitalize on the bigger swings.

    And in a trendless market, Grid and Mean Reversion usually perform better than anything trying to catch a directional move that just isn’t there.

    2. Why Strategy Performance Depends on Market Regime, Not Hype

    The simple truth is, no single strategy survives every regime equally well.

    That’s exactly why testing across different market conditions before going live matters more than picking the “best” strategy off some CT thread.

    Risk, Capital & Complexity Comparison Across All Strategies

    Let’s break this down plainly, because complexity and capital needs swing hard across these eight strategies.

    1. Low-Complexity Strategies: DCA & Buy and Hold

    DCA and Buy & Hold sit at the simple end.

    Low complexity, low starting capital, and honestly, not much that can go wrong operationally.

    You set it, you forget it, mostly.

    2. Medium to High-Complexity Strategies: Grid, Rebalance, Swing & Breakout

    Grid and Rebalance sit in the middle.

    They need real structure.

    A grid bot needs sensible range boundaries or it just sits idle or gets steamrolled by a strong trend.

    Rebalancing needs a clear target allocation, or you’re just guessing when to trim and add.

    Swing and Breakout demand more skill and more active management.

    You’re reading charts, reacting to volume, managing entries in real time.

    This isn’t a “set it and walk away” category.

    SELECTION MATRIX V2.0

    Not sure which
    exchange fits you?

    Bypass the marketing hype. Our matrix cross-references your profile against 50+ institutional metrics—including Proof-of-Reserves and Slippage Models.

    PoR Verified Low Slippage API Ready
    B
    K
    C
    O
    Find My Gateway Analysis Time: < 60s

    3. Why the Best Strategy Is the One You Can Execute Consistently

    Trend Following and Mean Reversion are rule-based systems, but ngl, they only work if you actually follow the rules.

    The math behind them is solid.

    The discipline to execute it without second-guessing every pullback is the hard part.

    The simple truth is, complexity isn’t automatically bad and simplicity isn’t automatically safe.

    It’s about matching the system to what you can actually sustain.

    Practical Selection Framework for Crypto Trading Strategy Comparison

    Okay, so how do you actually pick, instead of just reading eight strategy breakdowns and still feeling stuck?

    1. Start With Your Risk, Capital, and Available Time

    Start with your risk tolerance first, before anything else.

    Then check how much capital you can realistically commit without it affecting your sleep.

    After that, figure out your available time and attention, because a strategy that needs daily monitoring is useless to someone with a nine to five.

    2. Choose a Strategy That Matches Your Trading Personality

    Match your personality with the strategy style you just read about.

    And here’s the step almost everyone skips: conduct a thorough DCA strategy backtesting setup or a portfolio simulation to validate your rules before investing real capital.

    3. Validate Your Strategy Before Risking Real Capital

    This is where a lot of traders get cooked, not because the strategy was bad, but because they never chose to backtest a DCA bot or run grid simulations against historical data first.

    Strategy tools exist for exactly this reason, to help you check your choice before your capital is on the line.

    CryptoGates Tools That Simplify Strategy Selection and Testing

    Look, everything above is useless if you can’t actually validate it against real data.

    That’s the whole gap between “I think this strategy works” and “I tested this strategy and here’s what actually happened.”

    1. Find the Right Strategy With CG Strategy Picker

    This is where CG Strategy Picker comes in.

    It’s a quick profile match, ten questions on your risk tolerance, capital, experience, and goals, and it points you toward a strategy framework that actually fits instead of whatever’s trending on CT this week.

    CG STRATEGY ANALYZER

    Confused about
    market outlook?

    Trading without a plan is just gambling. Our strategy architect analyzes your risk tolerance and capital to match you with a proven algorithmic framework.

    PASSIVE DCA Bot
    AGGRESSIVE Grid Pro
    BALANCED Rebalance

    2. Validate Every Strategy With CG Strategy Engine

    Once you’ve got a direction, CG Strategy Engine takes over.

    It runs thousands of Monte Carlo simulations against your setup, checking robustness, risk of ruin, and drawdown probability before you ever risk a single dollar.

    Honestly, this is the part most traders skip entirely.

    They backtest once, get a good result, and go live.

    One good run means nothing if the strategy falls apart the moment market conditions shift slightly.

    Together, these tools move you from “which strategy should I use?” to “how do I actually validate it properly?”

    That’s the real question anyway.

    Common Mistakes in Crypto Strategy Selection

    Most bad strategy choices don’t come from bad math.

    They come from bad psychology.

    1. The Most Common Strategy Selection Mistakes

    Choosing a strategy because it’s popular on CT is probably the biggest one.

    Just because some anon posted a 300% chart doesn’t mean that setup fits your capital or your risk tolerance.

    Using a strategy that doesn’t match your available time is another.

    A swing strategy is useless to someone who can’t check charts during work hours.

    Ignoring market regime gets people too.

    Running a grid bot through a strong trend, or trend following through a chop-heavy range, and wondering why it’s not working.

    2. Why Discipline Matters More Than Chasing the Next Winning Strategy

    Then there’s overestimating capital needs, or worse, ignoring fees entirely until they’ve quietly eaten a chunk of the gains.

    And switching strategies too often without enough data is maybe the sneakiest one.

    One bad week doesn’t mean the system is broken.

    It might just mean the sample size is too small to judge anything yet.

    The simple truth is, discipline beats cleverness here almost every time.

    Final Crypto Strategy Comparison Table

    Here’s the whole guide compressed into one quick-glance view.

    Useful if you just want the summary without rereading eight sections.

    Swipe to view full data →
    Strategy Pair Best For Best Market Risk Level Complexity
    DCA vs Grid Long-term accumulation vs range profits Downtrend/dip vs sideways chop Low vs Medium Low vs Medium
    Grid vs Rebalance Active range trading vs portfolio discipline Sideways vs diversified holdings Medium vs Low Medium vs Medium
    DCA vs Buy & Hold Uncertain timing vs strong conviction Any market vs bull trend Low vs Low Low vs Low
    Swing vs Trend Medium-term timing vs riding the wave Volatile swings vs strong trends Medium vs Medium Medium vs Medium
    Mean Reversion vs Breakout Range snapback vs momentum continuation Range-bound vs expansion phase Medium vs High Medium vs High

    There’s No Universal Best Crypto Trading Strategy

    The simple truth is, there’s no single winner in this crypto trading strategy comparison.

    The right pick depends on your capital, your risk tolerance, your available time, and whatever market regime you’re actually trading in right now. DCA reduces timing stress.

    Grid farms range-bound chop. Rebalance keeps your portfolio honest.

    Buy and hold rewards patience.

    Swing and trend both chase moves, just on different timelines.

    Mean reversion and breakout play opposite sides of the same price action.

    SYSTEM ACCESS: CG4.2

    Stop Guessing.
    Stress Test Your Edge.

    The market doesn’t care about your backtest. Our engine simulates 1,000+ “what-if” scenarios to ensure your strategy is built for survival.

    Run Crypto Strategy Engine →
    ROBUSTNESS SCORE
    75+ STRUCTURAL EDGE
    RISK OF RUIN < 1%
    TARGET HIT 92%

    Here’s the thing, though. Reading about a strategy isn’t the same as testing it.

    Before you commit real capital, run your idea through the CG Strategy Picker to check the fit, then stress test it with the CG Strategy Engine.

    Verify first. Risk later. Scale slowly.

    FAQs

    What is the safest crypto trading strategy for beginners?

    DCA is usually the safest starting point since it removes the pressure of timing entries.

    It spreads risk over time instead of betting everything on one price point.

    Yes, many traders run DCA for long-term accumulation, Grid for range-bound assets, and Rebalance to keep overall portfolio risk in check. Each one serves a different job.

    Grid trading tends to perform best in sideways, range-bound conditions since it profits from repeated price oscillation. Mean reversion and Rebalance also hold up well here.


  • Advanced DCA Strategies 📈: Dynamic ⚙️, Volatility & AI 🧠 Methods for Smarter Crypto Investing

    Advanced DCA Strategies 📈: Dynamic ⚙️, Volatility & AI 🧠 Methods for Smarter Crypto Investing

    Bitcoin just spent a rough stretch losing over fifty percent from its highs, and if you’ve been buying the same amount every week without changing anything, you’re probably wondering if there’s a smarter way.

    There is.

    Advanced DCA strategies take the basic idea of dollar cost averaging and add real logic to it, so your buys actually respond to what the market is doing instead of running on autopilot.

    Whale wallets added more than 270,000 BTC during the recent multi-week drawdown, a classic sign of quiet accumulation while retail sentiment stayed shaky.
    On-chain data via CryptoQuant, reported by 247 Wall Street

    This isn’t about timing the bottom perfectly.

    It’s about building a system that adjusts when the market gets emotional so you don’t have to.

    In this guide, we’ll break down dynamic DCA, volatility DCA, AI DCA, and the weekly vs monthly debate, so you can build a framework that actually fits how crypto behaves right now.

    EXECUTIVE SUMMARY
    • The Problem: Static DCA schedules buy the same amount no matter what the market’s doing, which means they miss the best entries and overpay during euphoric runs.
    • The Solution: Dynamic DCA, volatility DCA, and AI DCA adjust buy size, timing, and frequency based on real market conditions instead of a fixed calendar.
    • The Incentive: A smarter DCA framework can improve your average entry price and put capital to work when discounts actually show up.
    • The Risk: Adding too many rules without testing them first can backfire, turning a simple strategy into a confusing mess that’s hard to stick to.

    What Is Advanced DCA?

    Advanced DCA is just dollar cost averaging with a brain attached.

    Instead of buying the same amount on the same day every single time, you’re working off a set of rules that react to what price is actually doing.

    Think entries, frequency, volatility, and how efficiently your capital gets put to work.

    It’s still systematic investing at its core.

    You’re just letting the system flex a little instead of staying locked to one fixed rule.

    The traders who last aren’t the ones predicting tops and bottoms. They’re the ones who built a system, tested it, and trusted the process even when it felt boring. Verify first. Risk later. Scale slowly.

    ZAHEER, CEO CryptoGates

    Honestly, this is where a lot of traders get confused.

    They think “advanced” means complicated.

    It doesn’t.

    It means responsive.

    Why Basic DCA Is Not Always Enough

    Plain DCA works.

    But in a market that can drop twenty percent in a month and then rip back the other way just as fast, a fixed schedule can leave real opportunity on the table.

    BTC opened the current quarter after a monthly drop near twenty percent, with price sitting more than fifty percent below its recent all-time high.
    Market data via CoinDesk and Finbold

    You keep buying the same size no matter what, which means you’re not doing anything extra when the market hands you a discount.

    Is advanced DCA riskier than regular DCA?

    Not really. It still spreads out your buys over time. The rules just adjust size or frequency based on market conditions instead of staying fixed, which can actually lower your average cost.

    Here’s the issue.

    Static schedules don’t care about context.

    They don’t know the difference between a healthy pullback and a full-blown capitulation event.

    That’s exactly why more experienced traders lean toward adaptive DCA models that factor in market timing, risk control, and ongoing strategy optimization instead of running on a set-it-and-forget-it calendar alone.

    HISTORICAL DATA AUDIT

    Battle-Test Your Strategy
    Before the Market Does.

    Eliminate guesswork with institutional-grade backtesting for DCA, Grid, and Rebalance bots. Real historical data. Real-world results.

    EST. OPTIMIZATION +42% ROI Efficiency
    Start Backtest Now

    Sourced from 5+ Years of Exchange Data

    Dynamic DCA Explained

    Regular DCA treats every week the same.

    Buy the same amount, no matter what’s happening on the chart.

    Dynamic DCA throws that rulebook out.

    It changes your buy size, your frequency, or your timing based on what price is actually doing right now – not on a fixed calendar.

    Think of it as DCA with a brain attached.

    This adaptive investing style leans on volatility-based buying instead of blind repetition, and honestly, that’s the whole point.

    Traders who want more control than plain-vanilla accumulation but aren’t ready to go full algorithmic trading tend to land here.

    A computer simulation study from the American Association of Individual Investors found that value-based, condition-responsive contribution strategies outperformed fixed-schedule investing in roughly 95% of tested scenarios.

    American Association of Individual Investors, AAII Journal)

    Here’s the interesting part.

    That number isn’t specific to crypto, but crypto’s swings make the logic even sharper.

    A market that can drop 20% in a weekend and rip back the following week rewards a strategy that actually reacts to it.

    1. How Dynamic DCA Works

    The mechanics are simpler than they sound.

    You increase your buy size during sharp dips  the market hands you a discount, so you take more of it.

    You pull back during overheated, euphoric conditions, when everyone on CT is calling for the moon and price already ran too far too fast.

    CONFIDENTIAL // RESEARCH
    STRATEGY INTELLIGENCE

    Proven Setups &
    Expert Breakdowns.

    We don’t just show you the data; we engineer and validate high-performance strategies, providing the “Alpha” behind the numbers.

    Frequency shifts too.

    Some traders speed up during high volatility and slow down when the market goes quiet and chop-y.

    The one non-negotiable rule: keep it systematic.

    The second you start deciding buy sizes based on how you feel that morning, you’ve stopped doing dynamic DCA and started gambling with extra steps.

    Reality Check

    Common belief: Traders often assume dynamic DCA only proves its value in a slow, orderly bleed – something like a normal correction – and that it can’t really be tested against a sudden, panic-driven shock.

    What CryptoGates research found: In a backtest during Ethena’s USDe redemption panic, ENA dropped 45% in days after a multi-million-dollar redemption event hit collateral. A rules-based DCA bot running through that exact window still closed the period +$898.19, without any manual intervention or emotional decision-making mid-panic.

    Why it matters: The point isn’t that every panic event ends profitably. It’s that a systematic, pre-tested rule set kept buying through the fear instead of freezing or exiting – which is precisely the discipline problem advanced DCA is meant to solve. A strategy that only works in calm markets isn’t really “adaptive”; this is closer to a real stress test of that claim.

    View Complete Playbook → https://cryptogates.io/playbooks/ena-dca-bot-playbook-surviving-a-45-crash-for-898-profit/

    2. Benefits of Dynamic DCA

    Done right, this approach improves capital deployment.

    You’re not throwing the same dollar amount into every entry regardless of price quality.

    It also gives you more flexibility when volatility spikes, which – let’s be real – happens constantly in crypto.

    Does dynamic DCA actually beat regular DCA?

    It can, but only if the rules are consistent and tested first. Without backtesting, dynamic DCA just becomes emotional trading wearing a disguise.

    Your average entry price tends to improve over time because more capital lands during genuine drawdowns instead of getting spread evenly across good and bad entries alike.

    And for anyone building a position over months or years, that stronger accumulation compounds.

    Running these rule sets through a DCA Strategy Backtest Bot before committing real capital is how you find out if your logic actually holds up, or if it just sounds good on paper.

    Weekly vs Monthly DCA

    Once you’ve picked a DCA style, the next question is frequency.

    Weekly or monthly?

    This isn’t just a scheduling preference – it changes your average cost, how much discipline the strategy demands, and how well it fits your income cycle. Neither option is wrong.

    Swipe to view full data →
    Factor Weekly DCA Monthly DCA
    Entry Precision Tighter, catches more short-term swings Looser, can miss quick dips
    Effort Required More transactions to manage Fewer transactions, simpler upkeep
    Best Fit High-volatility assets, active accumulators Long-term investors, fixed paycheck cycles
    Discipline Needed Higher, more decision points Lower, closer to “set and forget”
    Fee Impact Can add up with frequent buys Lighter fee drag overall

    Wait, that’s not quite true either – one is usually wrong for you specifically, and figuring out which takes about two minutes of honest thinking about your own habits.

    1. Weekly DCA

    Weekly entries smooth out price swings more evenly, simply because you’re buying more often.

    That makes it a better match for high-volatility assets, where price can move a lot in just a few days.

    It suits people who want to stay closer to the market without full-time trading.

    More entries also means more chances to catch a real dip instead of averaging over a whole month of noise.

    2. Monthly DCA

    Monthly is the low-maintenance option.

    Fewer transactions, easier to automate, easier to forget about – in a good way.

    It fits people on a fixed salary who get paid once a month and want their crypto buys to just happen in the background.

    You give up some precision, sure, but for a lot of investors, that trade-off is worth the reduced mental overhead.

    3. Which Is Better?

    Neither wins outright.

    Weekly usually sharpens your average entry price.

    Monthly is easier to stick with for years without burning out.

    The honest answer comes down to budget, how much you actually want to look at charts, and how much conviction you have in the asset.

    Someone stacking sats with real conviction might prefer weekly.

    Someone who just wants exposure without the noise will probably do fine with monthly, or even lean toward automating it entirely through a bot so the schedule never depends on willpower.

    Volatility DCA Strategy

    Volatility isn’t the enemy here.

    It’s the raw material. Volatility DCA treats every market swing as a signal, not just noise to survive.

    You buy more when the market hands you a real discount, and you pull back when things get stretched and euphoric.

    That’s the whole idea, adaptive investing built around price behavior instead of the calendar.

    “Even though people compare Bitcoin to digital gold, it’s still very sensitive to geopolitical issues.”

    Min Jung, analyst at Presto Research

    Here’s the thing.

    Most traders already know volatility creates opportunity.

    Bitcoin’s sentiment reading can swing from Extreme Fear to Extreme Greed within weeks, and that swing is exactly what volatility DCA is built to exploit.

    The problem is turning that idea into rules you’ll actually follow instead of decisions made from the gut.

    CG STRATEGY ANALYZER

    Confused about
    market outlook?

    Trading without a plan is just gambling. Our strategy architect analyzes your risk tolerance and capital to match you with a proven algorithmic framework.

    PASSIVE DCA Bot
    AGGRESSIVE Grid Pro
    BALANCED Rebalance

    1. How Volatility DCA Works

    The setup usually uses volatility bands or defined price ranges instead of a flat schedule.

    When price drops into a deep drawdown zone, allocation goes up.

    When the market gets unstable and overbought, allocation shrinks.

    None of this works in isolation, though.

    Pairing it with basic support and resistance context, plus a read on overall trend direction, keeps the rules from firing on every random wick.

    2. Why Traders Use Volatility DCA

    The appeal is pretty simple.

    It captures better average prices than a flat schedule because more capital lands during genuine dislocations.

    Is DCA still effective in a highly volatile market?

    Yes, arguably more effective. Volatility is what creates the price gaps that volatility-based DCA is designed to capture.

    It also gives structure to something that would otherwise be pure guesswork, buying every dip without asking whether that dip is actually a discount or the start of a bigger bleed.

    Traders who run this through a Volatility Bot or backtest engine before going live tend to catch the difference fast.

    Real Backtest Example

    Strategy: DCA (1.5% step interval)
    Coin: TAO/USDT
    Market Condition: Sharp pump followed by a 17% round-trip bleed
    Objective: Test whether tight-interval DCA can catch repeated legs down inside a volatile reversal

    Key Result: Out of 140 total sessions, 139 closed in profit, and the bot still banked +$1,677 even as spot holders watched the same position swing from a near-$300 high into a 17% loss.

    Expert Interpretation: This is close to a live case study of volatility DCA doing exactly what it’s designed to do – the 1.5% step was tight enough to trigger fresh entries on almost every pullback inside the reversal, instead of waiting for one big drawdown signal. It’s a useful reference point for why step size, not just the decision to “buy the dip,” is what determines whether a volatility-based system actually captures the move.

    View Complete Playbook → https://cryptogates.io/playbooks/tao-dca-bot-made-1677-while-spot-holders-lost-17/

    AI DCA and Smart DCA

    Now let’s look at the more advanced end of the spectrum.

    AI DCA and smart DCA use data signals, models, or automation to sharpen timing without letting emotion creep back into the process.

    Think of smart DCA as a rules engine that adapts to trend, volatility, and price behavior on its own, instead of a human checking charts every morning.

    Bitcoin’s Fear & Greed Index has recently sat in the mid-30s, in Fear territory. That’s exactly the kind of sentiment data automated and AI-assisted models track constantly, filtering emotional noise out of entry decisions.

    (CFGI.io)

    Honestly, this is where a lot of retail traders get intimidated and assume “AI trading” means something out of their reach.

    It doesn’t have to be.

    Even a simple rule set that reacts to a sentiment index or a volatility band is technically doing the same job an AI model does, just with fewer inputs.

    1. What AI DCA Can Analyze

    An AI-driven model can scan a handful of signals at once, trend direction, shifts in volatility, momentum changes, and even sentiment or market regime data.

    Some go further and layer in historical performance patterns to fine-tune when and how much to buy.

    The goal isn’t prediction.

    It’s refinement, sharpening entries around conditions that already look favorable.

    2. Benefits of Smart DCA

    Smart DCA improves timing discipline because the rules don’t care how you feel that day.

    It uses capital more efficiently, since sizing responds to real conditions instead of a fixed calendar.

    And it adapts across market cycles, bull runs, chop, and bleed phases alike, call it three or four completely different regimes a typical cycle, without needing a full manual rebuild every time the market shifts character.

    Best Use Cases for Advanced DCA Strategies

    Advanced DCA isn’t for every situation.

    It shines in a few specific spots, and knowing where those spots are matters more than knowing every possible rule you could add to your setup.

    Sajid, Strategy & Research, CryptoGates
    “Most people ask me which DCA variant is best. Wrong question. Ask which variant fits the market you’re actually in. Verify first, risk later, scale slowly.”

    Sajid, Strategist Cryptogates

    Long-term crypto investing is the obvious fit.

    If you’re building a position over months or years, dynamic or volatility-based sizing lets you take advantage of the chop instead of just riding through it blind.

    Volatile market periods are another sweet spot, honestly the whole reason these strategies exist in the first place.

    When price is swinging hard between fear and greed, a flat schedule ignores information that’s sitting right there on the chart.

    SYSTEM ACCESS: CG4.2

    Stop Guessing.
    Stress Test Your Edge.

    The market doesn’t care about your backtest. Our engine simulates 1,000+ “what-if” scenarios to ensure your strategy is built for survival.

    Run Crypto Strategy Engine →
    ROBUSTNESS SCORE
    75+ STRUCTURAL EDGE
    RISK OF RUIN < 1%
    TARGET HIT 92%

    It also works well for conviction investing, building a real position in an asset you’ve actually researched rather than something you’re aping into because CT is loud about it that week.

    Portfolio building over full market cycles, accumulation phases, distribution phases, and everything in between, tends to reward the investor who adjusted their buying instead of the one who just showed up on the same day every month.

    Common Mistakes in Advanced DCA

    Here’s the issue with most advanced DCA setups.

    They don’t fail because the tools are bad.

    They fail because someone added five rules when two would’ve done the job.

    1. Overcomplicating the Strategy

    The most common trap is stacking rules without a clear plan behind them.

    Someone reads about volatility bands, adds them, reads about AI signals, adds those too, and ends up with a system nobody, including them, can explain in one sentence.

    That’s strategy overfitting, where your rules look great on old data and fall apart the moment real volatility shows up.

    2. Changing Settings Too Often

    Ser, if you’re tweaking your DCA rules every week based on how the last seven days went, you’re not running a strategy anymore.

    You’re just reacting with extra math attached.

    Consistency is the whole point of DCA in the first place, breaking it defeats the purpose.

    3. Applying DCA to Weak Assets

    No amount of clever timing rescues a project with no real fundamentals behind it.

    Advanced sizing rules just make you accumulate a bagholder position faster.

    The strategy only works if the underlying asset has a real reason to recover.

    REF: VOL-NEUTRAL-2026

    Neutralize Volatility.
    Own the Growth.

    Access systematic playbooks designed to eliminate emotional bias. From Spot HODL frameworks to advanced Grid simulators.

    ◒
    Spot & HODL
    ◈
    DCA Engine
    ▦
    Grid Tactics
    ☯
    Rebalance

    4. Ignoring Fees, Liquidity, and Discipline

    Plenty of traders overlook the boring stuff.

    Fees eat into small, frequent buys.

    Thin liquidity on a low-cap asset can slip your entries badly.

    And once the excitement of building the system wears off, basic discipline is what keeps it running, not the cleverness of the rules.

    How to Build Your Own Advanced DCA Framework

    A strong framework doesn’t start complicated. It starts simple, then earns the right to add rules.

    1. Pick the Asset and Base Schedule

    Choose one asset with real conviction behind it, not whatever’s pumping on CT this week.

    Set a base schedule first, weekly or monthly, before adding anything advanced on top of it.

    2. Layer in Dynamic and Volatility Rules

    Once the base is set, decide how buy size should shift.

    Bigger buys on real dips, smaller ones when price looks stretched.

    Add volatility bands or AI-style filters only if they solve a problem your base schedule can’t handle on its own.

    3. Test Before Going Live

    Here’s the thing. None of this matters if you skip testing.

    Run the full rule set through a DCA Strategy Backtest Bot against real historical data across a few different market conditions before committing actual capital.

    Review performance regularly once live, and refine instead of tearing the whole system apart every time it has one rough month.

    Advanced DCA vs Traditional DCA

    Traditional DCA is the OG accumulation method.

    Same amount, same schedule, no exceptions. It’s simple, it’s boring, and honestly, that’s exactly why it works for so many people.

    Advanced DCA asks for more attention but gives back more control over your entries.

    Portfolio research comparing lump-sum investing to scheduled, averaged buying has found lump sum wins on raw returns roughly two-thirds of the time in trending markets. Averaged approaches still reduce regret and smooth out entry timing.

    (Vanguard portfolio research)

    1. Where Traditional DCA Wins

    It wins on simplicity. Set it, automate it, forget it.

    No monitoring, no rules to second-guess, no risk of overengineering something that didn’t need fixing.

    For a normie who just wants exposure without becoming a chart-watcher, that’s a real advantage.

    LIVE DATA FEED // UNFILTERED

    The Truth in Numbers.

    Designed for the 10% who require absolute clarity. We strip away the hype to reveal the structural reality of the crypto markets.

    11.6M TOKENS DEFUNCT (2025)
    “The Illusion of the Infinite Pump.” Most assets are designed to fail. We track the ones that don’t.
    ⚠ Shocking Crypto Statistics

    2. Where Advanced DCA Wins

    Advanced DCA wins on flexibility and capital efficiency.

    It reacts to real conditions, sharp dips, overheated euphoria, volatility spikes, instead of ignoring them.

    Over a full market cycle, that responsiveness tends to improve average entry price, assuming the rules were actually tested first.

    3. Which Fits You

    Depends on your profile, not on which one sounds smarter.

    Cost averaging discipline matters more than complexity.

    If you’d rather automate and walk away, traditional wins.

    If you want more control and you’re willing to backtest before deploying, advanced earns its extra steps.

    Building a DCA System That Actually Fits You

    Here’s the simple truth.

    Advanced DCA strategies exist for people who want more control than a flat recurring buy, not for people chasing a shortcut.

    Dynamic sizing, weekly vs monthly planning, volatility bands, AI-assisted timing, they all point back to the same idea: react to real conditions instead of ignoring them.

    HISTORICAL DATA AUDIT

    Battle-Test Your Strategy
    Before the Market Does.

    Eliminate guesswork with institutional-grade backtesting for DCA, Grid, and Rebalance bots. Real historical data. Real-world results.

    EST. OPTIMIZATION +42% ROI Efficiency
    Start Backtest Now

    Sourced from 5+ Years of Exchange Data

    The best DCA system isn’t the most complicated one on paper.

    It’s the one that actually matches your goals, your budget, and how the market is behaving right now, not how you wish it would behave.

    Run your own parameters and see what the data shows before you commit real capital.

    Test this setup yourself → CryptoGates DCA Strategy Backtest Bot.

    FAQs

    What is the main difference between dynamic DCA and regular DCA?

    Regular DCA buys the same amount every time. Dynamic DCA adjusts the amount based on price action and volatility.

    Not inherently. It’s riskier only if rules are added without testing them first on historical data.

    Traditional weekly or monthly DCA. Advanced styles work best once you’ve tested a strategy and understand why each rule exists.

  • What Is a DCA Bot? 🤖 The Complete Beginner’s Guide to Automated Crypto Investing 📈 Made Simple 📚

    What Is a DCA Bot? 🤖 The Complete Beginner’s Guide to Automated Crypto Investing 📈 Made Simple 📚

    Ever bought crypto, watched it dump the next day, then bought again at an even worse price?

    Yeah, most beginners have been there. A DCA bot exists for exactly that problem – it buys on a fixed schedule, no matter what your gut is screaming at you.

    No checking charts every hour.

    No “should I buy now or wait” anxiety.

    Just a simple, repeatable system running in the background while you go live your life.

    Over 70% of retail crypto traders lose money chasing short-term price moves.
    Resonanz Capital research on retail trading behavior

    Honestly, that alone changes how people experience crypto, because the stress of timing every single entry just disappears.

    EXECUTIVE SUMMARY
    • The Problem: Beginners buy based on emotion, timing the market badly and locking in losses.
    • The Solution: A DCA bot automates fixed-interval buying, removing guesswork and emotional timing.
    • The Incentive: Smoother average entry price over time, even through volatile swings.
    • The Risk: A DCA bot doesn’t guarantee profit – bad settings or a one-way falling market can still hurt returns.

    What Is a DCA Bot, Exactly?

    A DCA bot is software that buys a fixed amount of crypto at set intervals, regardless of price.

    Daily, weekly, whatever you choose. It doesn’t try to predict tops or bottoms. Honestly, that’s the whole point – it’s built to ignore the noise.

    Here’s the thing.

    Most people think successful trading means picking the perfect entry.

    But a DCA bot works on a different idea entirely: consistency beats precision.

    You’re not trying to be right once. You’re trying to be steady, again and again, until the average works in your favor.

    Consistent, scheduled buying reduces the impact of short-term volatility on overall returns.

    Vanguard research on systematic investing

    Think about it this way.

    If you tried to manually time twelve buys over a year, you’d need to be right twelve separate times.

    That’s exhausting, and honestly, nobody is that good at predicting short-term price moves – not even professionals with years of experience.

    A DCA bot sidesteps the whole problem.

    It just buys. Same amount, same schedule, no debate involved.

    Where the Term “DCA” Comes From

    Dollar-Cost Averaging isn’t new – it’s a strategy traditional investors have used for decades in stock markets, long before crypto existed.

    The basic idea was always simple: instead of investing one lump sum at one moment, you spread it out.

    CryptoGates and other platforms simply automated this for digital assets, where prices move a lot faster and a lot harder than they ever did in traditional markets.

    What took a human trader manual discipline to do in stocks now runs on autopilot for crypto.

    How Does a DCA Bot Actually Work?

    Set it up once, and it just runs.

    You pick the asset, the amount per order, and how often to buy.

    That’s basically it. No constant babysitting, no opening the app five times a day to check if “now” is the right moment.

    Wait, that sounds too simple, right?

    It kind of is.

    The complexity isn’t in the buying – it’s in choosing settings that actually fit your budget and your goals.

    A bot buying too aggressively can drain a budget fast.

    One buying too cautiously might barely build a position before the year ends.

    HISTORICAL DATA AUDIT

    Battle-Test Your Strategy
    Before the Market Does.

    Eliminate guesswork with institutional-grade backtesting for DCA, Grid, and Rebalance bots. Real historical data. Real-world results.

    EST. OPTIMIZATION +42% ROI Efficiency
    Start Backtest Now

    Sourced from 5+ Years of Exchange Data

    The Three Settings That Control Everything

    Three levers decide how a DCA bot behaves: the interval, the amount per order, and the total budget.

    The interval decides how often the bot buys – daily, weekly, or even monthly.

    Shorter intervals mean smaller, more frequent purchases, which smooths the average price even further.

    Longer intervals mean fewer transactions, which some traders prefer for simplicity.

    CG STRATEGY ANALYZER

    Confused about
    market outlook?

    Trading without a plan is just gambling. Our strategy architect analyzes your risk tolerance and capital to match you with a proven algorithmic framework.

    PASSIVE DCA Bot
    AGGRESSIVE Grid Pro
    BALANCED Rebalance

    The amount per order is exactly what it sounds like – how much gets spent each time the bot executes.

    This should match what someone can comfortably commit without disrupting daily life or savings goals.

    The total budget defines when the bot stops or when it starts a new cycle.

    Without this, a strategy can run indefinitely without a clear endpoint, which makes performance harder to evaluate.

    Get these three wrong, and even a solid strategy underperforms.

    Get them right, and the bot just quietly does its job in the background.

    A Simple Example

    Say someone buys $50 of an asset every week for a year.

    Some weeks the price is high, some weeks it’s low.

    Is a DCA bot good for beginners?

    Yes. It removes the hardest part of trading – deciding when to buy – and replaces it with a fixed, repeatable schedule that doesn’t depend on experience or market timing skill.

    Over time, those highs and lows blend into one average cost – usually smoother than trying to time a handful of “perfect” entries.

    By the end of the year, that trader has built a position without ever needing to predict a single price swing.

    Why Do Traders Use DCA Bots Instead of Manual Buying?

    Manual buying sounds fine in theory.

    In practice, it falls apart fast.

    You get busy, you forget, or worse – you panic and buy at the exact wrong moment because the price just pumped 8% and FOMO took over.

    “We didn’t build CryptoGates to help people guess better. We built it so they don’t have to guess at all. Verify first. Risk later. Scale slowly.”

    ZAHEER, CEO CryptoGates

    A DCA bot doesn’t have that problem.

    It doesn’t get scared during a red day.

    It doesn’t get greedy during a green one.

    It just executes the plan, every single time, exactly as set.

    There’s something almost boring about that consistency.

    But boring, in trading, is usually a good sign.

    Reality Check

    A common assumption is that a DCA bot will eventually turn any falling market into a profit – it won’t.

    What it does reliably do is reduce the damage compared to a lump-sum or panic-driven entry.

    In a CryptoGates backtest on ETH during a 46-day, 32% price decline, a DCA bot closed the window down just 1.81%, while a simple buy-and-hold position on the same capital was down considerably more over the same stretch. The bot didn’t turn a loss into a win — it never claimed to.

    What it demonstrated is that scheduled, unemotional buying narrows the gap between “doing nothing” and “getting it right,” even in a market that never recovers within the test window.

    This is the honest version of what DCA can and can’t do: It manages downside exposure, it doesn’t manufacture upside that isn’t there.

    Full Playbook: https://cryptogates.io/playbooks/eth-crashed-32-in-46-days-our-dca-bot-lost-only-1-81/

    The Emotion Problem DCA Bots Solve

    Fear and greed wreck more portfolios than bad strategy ever does.

    A trader who’s calm on paper often isn’t calm when their money’s actually on the line.

    That’s not a character flaw – it’s just human.

    Watching a chart move red for three days in a row triggers a very real, very physical stress response, and that stress is exactly what leads to bad decisions.

    A DCA bot simply removes the moment where emotion could even step in.

    There’s no decision to make in real time, which means there’s no moment for panic to take over.

    The plan was already set, calmly, before the market got volatile.

    Is a DCA Bot Right for Every Market Condition?

    Short answer?

    No. And anyone who tells you a DCA bot works perfectly in every market is selling something.

    Mark Douglas,
    “Market analysis will not solve the problems created by a lack of discipline and confidence.”

    Mark Douglas, Author, Trading in the Zone

    DCA bots tend to do well in choppy, sideways, or uncertain markets – the kind where nobody really knows what’s coming next.

    They’re less suited to short, sharp trading windows where speed matters more than consistency, or to markets that fall continuously without ever recovering.

    SYSTEM ACCESS: CG4.2

    Stop Guessing.
    Stress Test Your Edge.

    The market doesn’t care about your backtest. Our engine simulates 1,000+ “what-if” scenarios to ensure your strategy is built for survival.

    Run Crypto Strategy Engine →
    ROBUSTNESS SCORE
    75+ STRUCTURAL EDGE
    RISK OF RUIN < 1%
    TARGET HIT 92%

    When DCA Bots Are Most Useful

    Markets that grind sideways for weeks or months are where DCA really earns its place.

    Instead of trying to guess a breakout direction, the bot just keeps accumulating at a steady average, ready for whichever way the market eventually moves.

    Does a DCA bot work in a falling market?

    It can soften the damage by lowering your average buy price, but it won’t make you profitable in a market that only goes down. The trend still matters.

    The same logic applies during uncertain or news-driven periods, where prices swing on headlines rather than fundamentals.

    Nobody can consistently predict those swings, so steady accumulation becomes the more reliable approach.

    Real Backtest Example

    Strategy: DCA
    Coin: BTC/USDT
    Market Condition: Sideways-to-bearish (a slow 2% grind down over the month)
    Objective: Test whether small, scheduled buys can stay profitable when a market isn’t trending in either direction

    Key Result: Across 8 total sessions, 7 closed in profit, and the bot finished the month up +1.93% even as BTC itself was in the red.

    Expert Interpretation: This is the market condition where DCA bots tend to be most useful in practice — not sharp crashes, not strong rallies, but the slow, directionless chop that makes manual timing almost impossible to get right. The one losing session in the data is arguably more instructive than the wins: it shows that even in a favorable setup, not every cycle closes green, which is why testing a strategy against real historical data before going live matters more than picking numbers by feel.

    Full Playbook: https://cryptogates.io/playbooks/btc-fell-2-in-march-our-dca-bot-made-1-93-anyway/

    How to Test a DCA Bot Strategy Before Using Real Money

    Here’s what most beginners miss.

    They set up a DCA bot, pick random numbers for the interval and amount, and just hope it works.

    That’s not a strategy – that’s a guess with extra steps.

    Swipe to view full data →
    Market Type What a DCA Bot Typically Shows Why It Matters
    Falling Market Lower average entry over time Reduces damage from buying too early
    Sideways Market Steady accumulation, no major loss Builds position without guessing direction
    Rising Market Slightly higher average cost than lump sum Trade-off for reduced risk earlier on

    Look, the smarter approach is to test the setup against real historical data first.

    See how it would’ve performed during a crash, a sideways grind, and a bull run – before a single dollar of real capital touches it.

    That’s the whole “verify first, risk later” idea in practice, not just a slogan.

    What CryptoGates’ Backtest Tool Shows You

    CryptoGates runs DCA strategies against real 1-minute OHLCV data across major exchanges – not rounded, simplified candles.

    This means the backtest reflects how the bot would’ve actually behaved, not a smoothed-out approximation.

    Systematic, rules-based strategies consistently reduce behavioral timing errors compared to discretionary entries.
    Newfound Research

    You can adjust the interval, amount, and asset, then immediately see how that exact setup performed across different time periods.

    No spreadsheets. No manual math.

    Just a clear picture before any money moves.

    Interactive Checklist: Before Running a DCA Bot With Real Money

    • Backtest the exact interval and amount across at least two market conditions
    • Confirm the total budget fits comfortably without affecting other savings
    • Check how the strategy performed during a falling market specifically
    • Review the average entry price compared to a lump sum approach
    • Set a clear stop or pause condition before going live

    And honestly, this step is the part most beginners skip – which is exactly why so many of them end up disappointed with results that a few minutes of testing could’ve predicted.

    Start Small, Test First, Automate Later

    A DCA bot isn’t magic.

    It won’t fix a bad strategy or guarantee profit in a market that only goes one direction.

    But here’s the thing – it does remove the single biggest reason beginners lose money: emotional, badly-timed decisions.

    The real value isn’t the automation itself. It’s testing the setup first, seeing how it actually performs, and only then trusting it with real capital.

    That’s the difference between gambling and building something repeatable.

    Start with the CG DCA Backtest Tool, run a few scenarios, and adjust before going live.

    FAQs

    Do DCA bots guarantee profit?

    No. They reduce timing risk and emotional decisions, but they can’t protect against a market that keeps falling without recovery.

    There’s no fixed minimum. Most traders start small – even $10 to $50 per interval – and scale up once the strategy proves itself in testing.

    It depends on the platform. CryptoGates connects with several partner exchanges, including Binance, KuCoin, and OKX, for automated execution after backtesting.

  • Real DCA Bot Backtest Results 📊: One Coin Crashed 64% 📉-The Other Lost 32% ⚠️

    Real DCA Bot Backtest Results 📊: One Coin Crashed 64% 📉-The Other Lost 32% ⚠️

    Most people guess whether a DCA bot actually works.

    They watch a clip, read a thread, and decide based on vibes.

    Real DCA bot backtest results don’t work that way.

    They come from actual price candles, fixed settings, and sessions that either close in profit or don’t.

    A Vanguard research paper on dollar-cost averaging found that, across U.S. historical data, lump-sum investing beat DCA about two out of three times in rising markets.


    Vanguard, “Dollar-cost averaging just means taking risk later

    We pulled two real backtests from the CG Strategy Lab to show you exactly what that looks like.

    One where the bot turned a falling coin into profit.

    One where it simply lost less than doing nothing.

    Here’s what the numbers actually say.

    EXECUTIVE SUMMARY
    • The Problem: Most traders trust hype or gut feeling instead of real tested data before running a DCA bot.
    • The Solution: Two real CG Strategy Lab backtests show what a DCA bot actually does in a brutal bear run and in a slow, grinding decline.
    • The Incentive: You get exact settings and outcomes instead of a sales pitch, so you can judge a strategy before risking a single dollar.
    • The Risk: A well built DCA bot can still lose money, and a past backtest never guarantees what happens next.

    What Counts as a Real DCA Bot Backtest Result?

    A lot of “results” floating around crypto spaces aren’t results at all.

    They’re screenshots with no settings shown, no losing trades mentioned, and no real timeframe attached.

    A real result means the strategy ran against actual price candles, used fixed settings the whole way through, and reported every session, win or lose, not just the good ones.

    Mark Douglas,
    “Anything can happen.”

    Mark Douglas, Trading Psychology Author

    That line matters here.

    A backtest doesn’t predict the future.

    It shows you how one specific setup behaved against one specific stretch of real price action.

    That’s the whole value of it, and it’s also the limit of it.

    HISTORICAL DATA AUDIT

    Battle-Test Your Strategy
    Before the Market Does.

    Eliminate guesswork with institutional-grade backtesting for DCA, Grid, and Rebalance bots. Real historical data. Real-world results.

    EST. OPTIMIZATION +42% ROI Efficiency
    Start Backtest Now

    Sourced from 5+ Years of Exchange Data

    How CG Strategy Lab Tests These Bots

    Every playbook in the CG Strategy Lab runs on real 1-minute exchange data, not simplified daily averages.

    That level of detail matters because a coin can swing 3% and recover within hours, and a daily candle would miss that completely.

    The bot tracks every order, every session close, and every fee paid down to the cent.

    Nothing gets rounded up to look better.

    Case Study One – A DCA Bot That Profited Through a 64% PEPE Crash

    Here’s the thing about this one: it’s not a cherry-picked bull market win.

    PEPE lost 64% of its value over 112 days of steady selling.

    No crash, no panic, just a slow, grinding bleed where every small bounce got sold into.

    A DCA bot ran through the entire thing.

    The Setup and Strategy Parameters

    The bot wasn’t trying to predict a bottom.

    It was built to buy small dips and sell small bounces, over and over, regardless of where the bigger trend was heading.

    PEPE DCA Backtest – Core Settings

    Swipe to view full data →
    Setting Value Why It Mattered
    Base & DCA Order Size $300 each Kept early exposure low
    DCA Step 3% Matched PEPE’s bounce rhythm
    Take Profit 2.5% Loose enough to catch mini-pumps
    Max DCA Orders 14 Covered deep, extended drawdowns

    The Results vs Buy and Hold

    Out of 100 sessions, 99 closed in profit.

    Call it 99 wins out of 100, in a coin that was losing value the entire time.

    The bot closed with $2,542.73 in realized profit.

    A spot holder who bought and just held the same capital lost $704.79 over that same stretch.

    That’s a gap of over $3,200 between the two outcomes, on the same asset, in the same window.

    Continue Your Research

    PEPE and ETH show the two extremes — a deep memecoin bleed that produced profit, and a steady ETH decline that still lost money. For a fuller picture of how the same DCA logic behaves across different assets and crash types, two more CG Strategy Lab backtests are worth reviewing:

    Can a DCA bot make money in a falling market?

    Yes, if the asset still produces small bounces along the way down. The bot profits from those bounces, not from the overall trend direction.

    The catch is real, too.

    Max drawdown on individual sessions hit over 93%, which means at points the bot was deep underwater before a bounce finally triggered the exit.

    Anyone running this would’ve needed the full budget liquid and untouched the whole time.

    Tools like the DCA Backtest Bot exist specifically so you can see that drawdown curve before you commit real money to it, not after.

    SYSTEM ACCESS: CG4.2

    Stop Guessing.
    Stress Test Your Edge.

    The market doesn’t care about your backtest. Our engine simulates 1,000+ “what-if” scenarios to ensure your strategy is built for survival.

    Run Crypto Strategy Engine →
    ROBUSTNESS SCORE
    75+ STRUCTURAL EDGE
    RISK OF RUIN < 1%
    TARGET HIT 92%

    Case Study Two – A DCA Bot That Lost Less Than Doing Nothing on ETH

    Not every backtest ends in green, and that’s exactly why this one belongs here.

    ETH dropped 32% over 46 days.

    No recovery, no bounce back to even.

    The bot lost money.

    But here’s what actually matters: how much it lost compared to just holding.

    H3: The Digital Ledger Revolution

    This wasn’t a memecoin freefall.

    It was a slow, grinding decline with lower highs and lower lows, the kind that wears down a spot holder’s patience one red candle at a time.

    ETH DCA Backtest – Core Settings

    Swipe to view full data →
    Setting Value Why It Mattered
    Base & DCA Order Size $100 each Smaller stack for a steady grind
    DCA Step 2% Tighter spacing for shallower dips
    Take Profit 3% Gave each session real exit margin
    Max DCA Orders 10 Buffer for a multi-leg decline

    The Results vs Buy and Hold

    14 of 15 sessions closed in profit. Sounds strong, right?

    But the math still landed negative overall, at -$101.49.

    Honestly, that’s the part most people miss when they only look at win rate.

    One session opened near the top, deployed the full order stack averaging down, and that single session dragged the whole result into the red.

    “We don’t pretend every backtest ends in profit. Sometimes the real win is losing less than the market did. That’s the kind of data we want you to see before you ever risk real capital.”

    ZAHEER, CEO CryptoGates

    Here’s where it gets interesting, though.

    A spot holder with the same $1,100 lost $354.61 over the same 46 days.

    The bot’s loss was real, but it was $253 smaller.

    That’s not a win. It’s damage control, and in a falling market, damage control is sometimes the actual goal.

    What These Two Backtests Teach You About DCA Bots

    Put both backtests side by side, plus a third DCA bot playbook where a bot banked $898 through a 45% crash, and a pattern shows up fast.

    PEPE: 99% session win rate, big profit.

    ETH: 93% session win rate, still a loss.

    Almost the same win rate, completely different outcome.

    So what actually decided it?

    Interactive Checklist: Before You Trust Any DCA Bot Result

    • Was the backtest run on real exchange data, not simulated estimates
    • Does it report every session, including the losing ones
    • Is the max drawdown disclosed, not just the final profit number
    • Was the result compared against simple buy and hold
    • Were the exact settings (step %, take profit %, order size) shown

    Research Snapshot

    The PEPE and ETH cases aren’t isolated outcomes. Across other CG Strategy Lab DCA backtests run on sharply declining coins, the same pattern repeats: a high session win rate on its own tells you very little about the final P&L.

    In a 7-month, 56% DOT downtrend, 79 of 80 sessions closed in profit, and the bot still finished ahead of spot holders by nearly $1,000.

    In a volatile TAO round trip that ultimately left spot holders down 17%, 139 of 140 sessions closed green, delivering +$1,677.

    The recurring lesson: win rate measures consistency, not magnitude. What decides the outcome is how few sessions open badly — and how large those specific losses are relative to everything else. That’s the number worth checking before trusting any DCA result at face value.

    Full breakdowns: DOT DCA Bot Backtest | TAO DCA Bot Backtest

    Why a High Win Rate Doesn’t Always Mean Profit

    The real difference wasn’t the bot’s skill.

    It was where each new session opened.

    In the PEPE case, the price kept oscillating enough that each session, even a losing one, had room to recover into a small profit.

    Nic Carter
    “The thoughtful and patient investor often does better.”

    Nic Carter, crypto analyst and Castle Island Ventures co-founder

    In the ETH case, one session opened high and averaged all the way down, and that single session’s loss outweighed several smaller wins combined.

    Why did a 93% win rate still lose money on ETH?

    Because one session opened at a high price and used the full order stack averaging down, and that single loss outweighed the smaller wins from the other sessions.

    That’s basically the lesson in numbers.

    Patience and a tested setup beat reacting to whatever the last candle did.

    The Real Lesson from These Two Backtests

    Two backtests, two different markets, two different outcomes.

    One turned a 64% crash into real profit.

    The other lost money, just less of it than doing nothing would have.

    Neither result came from a guess.

    Both came from real settings tested against real price data, win or lose, fully disclosed.

    CG STRATEGY ANALYZER

    Confused about
    market outlook?

    Trading without a plan is just gambling. Our strategy architect analyzes your risk tolerance and capital to match you with a proven algorithmic framework.

    PASSIVE DCA Bot
    AGGRESSIVE Grid Pro
    BALANCED Rebalance

    That’s really the whole point of backtesting.

    Not to promise a win every time, but to know what you’re actually signing up for before you commit real capital to it.

    If you want to see how a setup like this would have performed on a coin and timeframe of your choosing, the CG DCA Strategy Validator lets you run that test yourself, free, before risking anything.

    FAQs

    Does a DCA bot always make a profit?

    No. The ETH case study here lost money. It performed better than buy and hold, but it still wasn’t profitable on its own.

    Win rate alone doesn’t tell the full story. A 93% win rate still lost money in one case, while a 99% win rate produced a large profit in another.

    A backtest uses real historical data but assumes you have the full capital liquid and available the entire time. Real trading adds emotion, hesitation, and the temptation to intervene.

  • What Is a Grid Bot? 🤖 The Complete Guide 🧭 to Profiting in Sideways Crypto Markets 📈

    What Is a Grid Bot? 🤖 The Complete Guide 🧭 to Profiting in Sideways Crypto Markets 📈

    Most traders think automation means setting up a bot and walking away.

    That part’s true.

    But the part nobody talks about is what happens when the bot runs in the wrong market with the wrong settings.

    A grid bot is one of the most powerful tools in crypto trading. It’s also one of the fastest ways to lock up capital in a losing position if you skip the setup.

    Here’s exactly what it is, how it works, and what you need to know before deploying one.

    EXECUTIVE SUMMARY
    • The Problem: Most retail traders can’t monitor crypto markets around the clock, missing trades and reacting emotionally when they do engage.
    • The Solution: A grid bot automates buy and sell orders across a defined price range, capturing volatility systematically without constant supervision.
    • The Incentive: When properly configured and tested, grid bots generate consistent small profits in sideways markets without requiring active trading decisions.
    • The Risk: Deployed in a trending market with wrong settings, a grid bot compounds losses automatically at every grid level until capital is trapped or exhausted.

    What Is a Grid Bot?

    A Grid Bot is an automated trading program that places a series of buy and sell orders at fixed price intervals within a set range.

    Instead of trying to predict where the market is going, it simply profits from price moving up and down inside that range.

    According to a Pionex internal report, grid trading bots on their platform executed over 10 million trades per month across active users, with the majority of profitable sessions occurring during low-volatility, sideways market periods. (Source: Pionex Trading Data Report)

    Every time price drops to a buy level, the bot buys. Every time it rises to the next level, it sells.
    That’s it. No predictions. No guessing. Just systematic execution.

    The Basic Idea Behind Grid Trading

    Price in crypto almost never moves in a straight line.

    Even in a strong uptrend, price dips and recovers constantly. A grid bot is built specifically to exploit that behavior. It doesn’t care about direction.

    It cares about movement.
    Think of it like a vending machine for trades.

    Set the range, set the levels, put in the capital. The bot handles everything else.

    How Grid Bots Differ From Manual Trading

    Here’s the thing.

    A human trader watching BTC at 2 AM might hesitate, second-guess, or simply fall asleep.

    A grid bot doesn’t do any of that. It executes every order at the exact price level, every single time, with zero emotional interference.

    “Automated grid strategies remove the two biggest enemies of retail traders: emotion and inconsistency. The bot doesn’t feel fear when price drops. It just buys the next level as programmed.”

    Dr. Yan Zhang, Quantitative Trading Researcher (Source: Journal of Algorithmic Finance)

    Manual trading relies on discipline you may not always have.

    A grid bot doesn’t need discipline. It runs on rules.

    How a Grid Bot Actually Works

    The mechanics are simpler than most traders expect.

    You define a price range.

    The bot divides that range into equal levels called grids.

    At each grid level, it places a buy order below and a sell order above. When price moves between levels, trades execute automatically and the bot pockets the difference.

    The profit per trade is small. But it compounds across dozens or hundreds of trades over time.

    HISTORICAL DATA AUDIT

    Battle-Test Your Strategy
    Before the Market Does.

    Eliminate guesswork with institutional-grade backtesting for DCA, Grid, and Rebalance bots. Real historical data. Real-world results.

    EST. OPTIMIZATION +42% ROI Efficiency
    Start Backtest Now

    Sourced from 5+ Years of Exchange Data

    Upper Bound, Lower Bound, and Grid Levels Explained

    The upper bound is the highest price in your range.

    The lower bound is the lowest. Everything in between gets divided into grid levels.

    If you set 10 grids between $90 and $110 on an asset, the bot places orders every $2.

    Swipe to view full data →
    Setting What It Controls Common Mistake
    Upper Bound Max price bot operates Setting too wide
    Lower Bound Min price bot operates Setting too tight
    Grid Count Number of order levels Too many grids, fee drag
    Investment Amount Capital allocated Allocating too much too soon
    Grid Spacing Gap between each level Ignoring spread and fees

    More grids means more trades, smaller profit per trade, and higher fee exposure.

    Fewer grids means bigger profit per trade but fewer opportunities to execute.

    A Simple Example With Real Price Movement

    Say you set a grid bot on ETH between $2,800 and $3,200 with 8 grids. Each grid is $50 apart.

    Price starts at $3,000. It drops to $2,950, your bot buys. Price recovers to $3,000, your bot sells. That one round trip just made you the $50 spread minus fees.

    Now imagine that happening across 8 levels, multiple times per day. Small wins. Consistent execution.

    What Happens When Price Breaks Out of the Range

    This is where most beginners get surprised.

    If price breaks above your upper bound, the bot stops buying and just holds.

    If price crashes below your lower bound, the bot may hold a losing position in a falling asset with no more buy orders left to average down.

    A breakout doesn’t automatically stop your bot. It just makes it useless, or worse, harmful.

    Key Components That Make a Grid Bot Work

    Understanding what a grid bot is made of matters more than most traders realize.

    Two traders can run the same bot on the same pair and get completely different results, simply because they configured the core components differently.

    Before you touch any settings, understand what each component actually controls.

    Price Range and Grid Spacing

    The price range is the foundation of everything.

    It defines the upper and lower boundaries within which your bot operates.

    All buy and sell orders live inside this range. Nothing happens outside it.

    Grid spacing is how far apart each order level sits within that range.

    If your range is $200 wide and you set 10 grids, each grid level is $20 apart. That $20 gap is the gross profit per completed round trip before fees. Narrow spacing means more trades but smaller profit per trade.

    Wide spacing means fewer trades but larger profit per trade.

    Here’s the thing most beginners miss.

    Grid spacing and fees are directly connected. If your spacing is $20 but your round-trip fee costs $18 in trade value, you’re making $2 per trade.

    That’s not a strategy. That’s barely breaking even on a good day.

    Order Size and Capital Allocation

    Order size is the amount of capital deployed at each grid level.

    If you allocate $1,000 total across 10 grids, each grid level gets roughly $100 to work with.

    When a buy order triggers at one level, that $100 buys the asset.

    When the sell triggers at the next level up, that position closes and the profit gets added back to your available capital.

    Andreas M. Antonopoulos
    “Treat grid bot capital allocation the same way a fund manager treats position sizing. No single position should be large enough to meaningfully damage your overall portfolio if it goes wrong. Grid bots are tools for consistent small gains, not vehicles for concentrating risk.”

    Andreas Antonopoulos, Bitcoin Educator and Author (Source: Mastering Bitcoin, O’Reilly Media)

    Capital allocation is the bigger decision.

    How much of your total trading capital goes into this one bot on this one pair?

    This is where most retail traders make a mistake that compounds quickly. They allocate too much.

    One bad trend move breaks their range, the bot holds losing positions, and suddenly a large chunk of their capital is trapped in an underwater grid waiting for a recovery that may take weeks.

    Stop-Loss Logic and Emergency Exit Conditions

    Most grid bot tutorials skip this entirely. That’s a problem.

    A grid bot running without a stop-loss or emergency exit condition is a bot with no defense mechanism.

    If price trends hard against your range and keeps going, the bot will keep executing buy orders all the way down with no instruction to stop.

    LIVE EXCHANGE RATES

    Calculate Your Swaps

    Seamlessly bridge your assets with our lightning-fast conversion engine. Get the best rates across 500+ pairs with zero hidden fees.

    From 1.00 BTC
    To 64,281.50 USDT
    Launch Converter

    A stop-loss condition tells the bot to shut down and close all positions if price drops below a defined threshold.

    Not every exchange or bot platform supports this natively. But you need to know where your personal exit point is before you deploy.

    Decide in advance. Write it down. If price hits that level, you close the bot manually if necessary.

    This isn’t pessimism. This is the single most important risk management decision you make before going live.

    Grid Bot Performance Metrics — What to Actually Track

    Running a grid bot without tracking the right numbers is like driving without a dashboard.

    You might be moving forward. You might be running out of fuel.

    You genuinely can’t tell without looking at the right data.

    Most beginners check one number. Total profit. That’s not enough.

    Profit Per Grid vs Total Return

    Profit per grid tells you how much each completed round trip actually made after fees.

    This number should always be positive.

    If it isn’t, your grid spacing is too narrow for your fee structure and you’re losing money on every single trade while the bot looks busy.

    Total return is the bigger picture number. It accounts for all completed trades across the entire bot runtime.

    But here’s the trap. Total return can look positive while your unrealized PnL is deeply negative. If price has trended down and your bot is holding positions bought at higher levels, your realized gains may be $50 while your unrealized losses are $300.

    That’s not a profitable bot. That’s a bot with a hidden problem.

    Always look at both numbers together. Never celebrate realized profit while ignoring unrealized loss.

    Fee Impact on Net Profit

    That $45 monthly fee cost is not dramatic on a well-configured bot with proper grid spacing.

    But on a bot with narrow grids generating $0.30 profit per trade, fees erase everything and then some.

    Binance charges a standard spot trading fee of 0.1% per trade. A grid bot executing 15 trades per day on a $1,000 position pays approximately $1.50 daily in fees alone, totaling roughly $45 per month before any profit is calculated. (Source: Binance Fee Schedule, Binance.com)

    Calculate your expected fee cost before deploying.

    Multiply your expected daily trade count by your exchange fee percentage by your average order size.

    That number needs to be comfortably below your expected daily profit for the strategy to make sense.

    Drawdown and Capital Efficiency

    Drawdown measures how far your bot’s total value dropped from its peak before recovering.

    A bot that makes $200 in profit but experiences a $600 drawdown along the way is not a stable strategy. The risk-to-reward profile is broken even if the final number looks positive.

    Capital efficiency asks a simpler question.

    Is the capital locked in this grid bot working hard enough to justify being here instead of somewhere else?

    A bot tying up $2,000 to generate $30 per month is a 1.5% monthly return. That may or may not be acceptable depending on your goals.

    But you should know that number and make a conscious decision about it, not discover it three months later.

    Grid Bot Strategy Examples

    Theory only gets you so far. Seeing how different configurations actually look in practice makes the decision process much clearer.

    Here are three distinct approaches, each designed for a different type of trader and market condition.

    Conservative Range Grid

    This is the right starting point for most beginners.

    Wide range.

    Moderate grid count. Small capital allocation. Low frequency trading.

    Example setup on BTC/USDT. Range set between $58,000 and $68,000. Ten grids. Each grid level $1,000 apart.

    Total capital $2,000. Each grid order is $200.

    Expected trades per week in a ranging market: 8 to 12.

    Expected profit per grid after fees on a 0.1% fee exchange: approximately $0.80 to $1.20 per $200 order.

    This setup won’t make you rich quickly. That’s the point.

    It runs quietly, generates small consistent returns, and gives you real live data on how your bot performs without putting significant capital at risk.

    REF: VOL-NEUTRAL-2026

    Neutralize Volatility.
    Own the Growth.

    Access systematic playbooks designed to eliminate emotional bias. From Spot HODL frameworks to advanced Grid simulators.

    ◒
    Spot & HODL
    ◈
    DCA Engine
    ▦
    Grid Tactics
    ☯
    Rebalance

    High-Frequency Tight Grid

    This approach suits more experienced traders who understand fee structures deeply and are trading on low-fee or zero-fee exchanges.

    Narrow range.

    High grid count. More trades per day. Smaller profit per trade.

    Example on ETH/USDT.

    Range set between $3,100 and $3,400. Twenty grids. Each grid level $15 apart.

    Total capital $3,000. This bot may execute 20 to 40 trades per day in an active sideways market.

    Profit per grid after fees needs careful calculation here. On a 0.1% fee exchange this setup likely doesn’t work.

    On a 0.01% fee exchange or with fee rebates, it becomes viable.

    Wait. This is exactly where beginners get burned. They see high trade frequency as high profit.

    It isn’t. High trade frequency is only high profit if your grid spacing comfortably clears your fee cost on every single trade.

    Neutral Grid on a Mid-Cap Pair

    Mid-cap assets like SOL/USDT or MATIC/USDT sometimes offer better grid bot opportunities than BTC or ETH because their higher relative volatility creates more frequent price oscillations within a defined range.

    The risk is higher too.

    Mid-cap assets trend harder and break ranges more aggressively than BTC.

    A neutral grid on a mid-cap pair should use a wider range, fewer grids, and strictly limited capital allocation

    Never more than 5% of total trading capital on a single mid-cap grid bot position.

    Always backtest mid-cap pairs across at least 60 days of historical data before deploying.

    The ranging periods look attractive on the chart. But the trend periods can be brutal and fast.

    Security and API Risk — What Most Traders Ignore

    Your grid bot connects to your exchange account through an API key.

    That API key is the link between your bot and your money.

    Most traders set it up once, never think about it again, and have no idea what risks that connection creates.

    API Permission Settings

    When you generate an API key for your grid bot, you control what permissions that key has.

    A correctly configured API key for a grid bot needs exactly two permissions. Trading access and read access. That’s it.

    It should never have withdrawal permissions. Never.

    If your API key has withdrawal permissions and it gets compromised, an attacker can empty your exchange account without triggering any trade-based security alerts.

    This one setting is the single easiest security improvement any grid bot trader can make and the most commonly ignored.

    Is a grid bot good for beginners?

    Yes, but only with proper setup and testing first. Grid bots are simple to understand, but wrong settings in a trending market can lead to quick losses. Start small, backtest your settings, and use a spot grid before touching futures.

    Exchange Reliability and Operational Risk

    Your bot is only as reliable as the exchange it runs on.

    Exchange downtime, API outages, and maintenance windows can pause your bot mid-operation, leaving open orders sitting unfilled at levels that may no longer be relevant when the connection restores.

    SELECTION MATRIX V2.0

    Not sure which
    exchange fits you?

    Bypass the marketing hype. Our matrix cross-references your profile against 50+ institutional metrics—including Proof-of-Reserves and Slippage Models.

    PoR Verified Low Slippage API Ready
    B
    K
    C
    O
    Find My Gateway Analysis Time: < 60s

    A CoinGecko Exchange Reliability Report found that even top-tier exchanges experience an average of 4 to 6 hours of partial API downtime per month, which directly impacts automated trading bots that depend on continuous connectivity. (CoinGecko Exchange Trust Score Report)

    Types of Grid Bots

    Not all grid bots are built the same.

    The type you pick should match your market view, your risk tolerance, and how much capital you’re willing to put to work.

    Picking the wrong type for the wrong market is one of the fastest ways to lose money with an otherwise solid strategy.

    A Binance Academy study found that spot grid bots outperformed futures grid bots in risk-adjusted returns during sideways market periods, largely because futures grids carry liquidation risk that can wipe positions during sudden volatility spikes. (Binance Academy Research)

    Spot Grid Bot vs Futures Grid Bot

    A spot grid bot trades actual assets.

    You buy real ETH, real BTC, real USDT pairs.

    There’s no leverage. If price moves against you, you hold the asset and wait.

    It’s slower, safer, and far more forgiving for beginners.

    “Futures grid bots are not a shortcut to bigger profits. They’re a faster route to bigger losses if you don’t understand how leverage interacts with your grid spacing.”

    Alex Krüger, Macro Trader and Crypto Analyst (Source: Krüger Research Newsletter)

    A futures grid bot uses leverage.

    That means bigger potential gains, but also the very real possibility of liquidation.

    One bad move in a leveraged futures grid can erase your entire position.

    Honestly, most beginners have no business running a futures grid bot until they’ve tested and understood a spot grid first.

    Long Grid, Short Grid, and Neutral Grid

    A long grid is set up expecting price to stay above a certain level or trend mildly upward. The bot holds more base asset and profits as price oscillates upward through the grid.

    A short grid works the opposite way. It’s designed for assets expected to drift lower, capturing profits as price falls through grid levels. This type carries more risk and isn’t recommended for beginners.

    “At CryptoGates, we always tell traders the same thing. Don’t choose a grid type based on what sounds exciting. Choose it based on what the market data is actually showing you. A neutral spot grid on a liquid, ranging pair is where most traders should start. Test it first. Scale later.”

    ZAHEER, CEO CryptoGates

    A neutral grid sits in the middle, and if you’re still weighing it against long and short setups, our Grid Trading Strategy Guide breaks down all five grid types with an ROI calculator.

    It doesn’t lean bullish or bearish. It just captures movement in either direction within the range.

    For most traders, especially those just starting out, a neutral spot grid is the safest place to begin.

    Best Market Conditions for a Grid Bot

    A grid bot is not a set-it-and-forget-it machine that works in every market.

    It has a very specific environment where it performs well.

    Put it in the wrong conditions and it will lose money just as systematically as it would have made money in the right ones.

    Research published by the CFA Institute found that range-bound markets account for roughly 70% of total market time across major asset classes, suggesting grid strategies have a statistically significant window of opportunity when deployed correctly. (Source: CFA Institute Market Behavior Study)

    The ideal environment is a sideways, ranging market with moderate volatility.

    Price bouncing between clear support and resistance levels. No strong directional trend. Predictable oscillation.

    Research Snapshot

    Across CryptoGates‘ internal grid bot testing, one pattern shows up consistently: the strategy’s edge is almost entirely tied to how “flat” a market actually is, not how volatile it looks day to day.

    In one 90-day test on XRP — where the coin opened and closed within a single cent of each other — an 875-trade grid session generated a 27.74% return while simple buy-and-hold earned just 0.24%, a gap created entirely by the bot capturing micro-oscillations a passive holder never touches. A separate SOL/USDT test over 76 days, where price actually trended 18.6% upward, told a different story: the bot returned 16.72%, still solid, but buy-and-hold edged it out by capturing the full upside a bounded grid can’t chase.

    The lesson holds regardless of the pair: grids don’t need calm markets; they need boundaries that hold.

    View Complete Playbook: XRP Went Nowhere for 3 Months 📉 Our Grid Bot Made +27.74% Anyway

    How to Identify a Ranging Market Before You Deploy

    Look, you don’t need to be a technical analysis expert to spot a ranging market.

    A few simple checks are enough. First, look at the Average True Range (ATR)

    If it’s been relatively stable and not spiking, that’s a good sign.

    Second, check Bollinger Band width. Narrow bands suggest consolidation, which is exactly what you want.

    CONFIDENTIAL // RESEARCH
    STRATEGY INTELLIGENCE

    Proven Setups &
    Expert Breakdowns.

    We don’t just show you the data; we engineer and validate high-performance strategies, providing the “Alpha” behind the numbers.

    Third, and most practically, just zoom out on the chart.

    Has price been bouncing between two clear levels for a reasonable period? That’s your range. That’s your grid zone.

    When to Pause or Stop Your Grid Bot

    Here’s what most traders don’t want to hear.

    Running a grid bot during a strong trend is not brave. It’s expensive.

    A major news event, a regulatory announcement, or a sudden market-wide move can push price far outside your range and leave your bot holding losing positions with no recovery path in sight.

    Interactive Checklist: Before You Deploy Your Grid Bot

    • Has price been ranging for a sustained period with no strong trend?
    • Is ATR stable and not spiking over recent sessions?
    • Have you confirmed the pair has strong liquidity and tight spreads?
    • Have you backtested your settings on at least 30 days of historical data?
    • Have you set a maximum loss threshold or stop condition?

    The smarter approach is to treat your grid bot like a tool you pick up and put down based on conditions, not something you leave running indefinitely and hope for the best.

    Monitor it.

    Pause it when conditions shift. Restart it when the range returns.

    Can a grid bot lose money?

    Yes, absolutely. A grid bot loses money when price trends strongly in one direction outside your set range. In a sharp downtrend, the bot keeps buying a falling asset with no sell orders triggering to recover losses. Risk management and backtesting before going live are non-negotiable.

    How to Set Up a Grid Bot Step by Step

    Setup is where most traders either get it right or guarantee failure before a single trade fires.

    The good news is the process itself isn’t complicated.

    The bad news is most people rush through it, skip the testing phase, and wonder why their bot lost money in the first week.

    Follow the sequence. Don’t skip steps. That’s really the whole secret.

    Choosing the Right Trading Pair

    This is the first decision and arguably the most important one.

    A grid bot is only as good as the pair it runs on.

    You want a pair that moves enough to generate trades but not so wildly that it blows through your range in one candle.

    Four filters matter here. Liquidity comes first.

    High-volume pairs like BTC/USDT or ETH/USDT have tight spreads and deep order books, which means your bot’s orders fill cleanly without slippage eating your profit.

    Volatility comes second.

    You need enough price movement to trigger multiple grid levels regularly.

    Spread comes third. Wide spreads on thin pairs can make each trade unprofitable before fees are even counted.

    Historical range behavior comes fourth. Look back at the chart.

    Has this pair been ranging?

    Or has it been trending hard in one direction?

    Knowledge Check

    If a malicious actor changes a transaction in Block #50, what happens to Block #51?

    Avoid meme coins, newly listed tokens, and anything with low daily volume.

    Those pairs look exciting and move fast, but not in the controlled, oscillating way a grid bot needs.

    Setting Your Range, Grid Count, and Investment Amount

    Here’s where traders overthink things and end up paralyzed. Keep it simple to start.

    Your range should sit around the current price, with the upper and lower bounds set at recent resistance and support levels.

    Don’t guess these.

    Look at the actual chart and find where price has consistently reversed.

    That’s your range.

    Your grid count should be between 5 and 20 for most beginners.

    Fewer grids means bigger profit per trade but fewer opportunities.

    More grids means more trades but smaller margins and higher fee exposure.

    Around 10 grids is a reasonable starting point for most liquid pairs.

    “Position sizing is the most underrated part of grid bot setup. Most beginners allocate too much capital to a single bot on a single pair. A smarter approach is to limit any single grid bot to no more than 5-10% of your total trading capital until you have verified performance data.”

    Michaël van de Poppe, Crypto Trader and Educator (Source: Van de Poppe Trading Academy)

    Your investment amount should be money you can afford to have locked in this position for weeks.

    A grid bot is not a liquidity-on-demand tool. Once capital is deployed, it’s working inside the grid. Don’t deploy rent money.

    Don’t deploy emergency funds.

    Start with a small amount, see how the bot performs, then scale slowly if results justify it.

    Backtesting Before Going Live

    Wait. Before you hit start on anything, backtest your settings.

    This step alone separates traders who consistently profit from those who consistently wonder what went wrong.

    Backtesting runs your grid settings against historical price data to show you how the bot would have performed in past market conditions.

    It won’t predict the future perfectly.

    But it will immediately expose settings that are obviously broken, ranges that are too tight, grid counts that generate no meaningful profit after fees, and pairs that trend too hard for a grid strategy to survive.

    CryptoGates’ Grid Backtest Bot lets you run these simulations before committing real capital. Test multiple settings.

    Compare results.

    Only deploy the configuration that shows consistent, fee-adjusted profitability across different market conditions, not just one favorable period.

    LIVE DATA FEED // UNFILTERED

    The Truth in Numbers.

    Designed for the 10% who require absolute clarity. We strip away the hype to reveal the structural reality of the crypto markets.

    11.6M TOKENS DEFUNCT (2025)
    “The Illusion of the Infinite Pump.” Most assets are designed to fail. We track the ones that don’t.
    ⚠ Shocking Crypto Statistics

    Grid Bot Risks and Common Mistakes

    Here’s the part most grid bot tutorials skip because it’s not exciting to talk about.

    Grid bots can and do lose money.

    Not because the strategy is flawed, but because traders deploy them incorrectly, in the wrong conditions, with the wrong settings, and with zero risk management in place.

    Knowing exactly where things go wrong is more valuable than any setup guide.

    Reality Check

    Common belief: A grid bot’s built-in “buy the dip, sell the rally” logic naturally softens the blow during a market crash, so the drawdown will always be manageable.

    What CryptoGates research found: In a 79-day backtest on BNB — a 33% wipeout following an all-time high — the grid bot fired 171 trades and generated $163.94 in gross grid profit. That’s real, working profit. Yet total ROI still landed at −21.64%. Grid profit and total return are not the same number, and a trending crash can erase every gain the grid captured along the way, plus more.

    Why it matters: A bot “working correctly” and a bot “being profitable” are two separate outcomes. Traders who only check for executed trades — without checking whether price broke the lower bound — can mistake a slow bleed for a functioning strategy.

    View Complete Playbook: BNB Crashed 33% After Its ATH 📉 Our Grid Bot Lost Less — But Still Lost ⚠️

    The Trend Risk Problem

    This is the biggest risk. Full stop.

    A grid bot is designed for ranging markets.

    Deploy it into a strong downtrend and something uncomfortable happens.

    Price keeps falling through your grid levels. The bot keeps buying at each level exactly as programmed.

    But there are no sell orders triggering above because price isn’t recovering.

    It just keeps dropping.

    A study by Coin Bureau Research found that approximately 65% of grid bot losses reported by retail traders occurred during strong directional market moves that broke below the bot’s lower bound within the first two weeks of deployment. (Source: Coin Bureau Research Report)

    The result is a bot holding a growing position in a falling asset with unrealized losses stacking up at every level.

    The bot isn’t broken. It’s doing exactly what you told it to do. The problem is you deployed it in the wrong market condition.

    Fee Drag and Over-Optimization

    Here’s something that surprises most beginners.

    Fees are not a small detail. They are a core part of your profit calculation.

    A grid bot making dozens of small trades per day is also paying a trading fee on every single one of those trades.

    On a 0.1% fee exchange, a bot executing 20 trades per day is paying 2% of trade value daily in fees alone.

    If your grid spacing is too narrow and your profit per grid level doesn’t comfortably exceed the round-trip fee, your bot is losing money on every trade while looking busy and productive.

    “Never optimize your grid bot settings for peak historical performance. Optimize for consistency across multiple different market regimes. A bot that performs moderately well in ranging, trending, and volatile conditions will always outlast one that looks perfect in backtests but only works in one specific scenario.”

    Ernest Chan, Quantitative Trader and Author of Algorithmic Trading (Source: Algorithmic Trading, Wiley Finance)

    Over-optimization is the other trap.

    Backtesting a set of settings that performed perfectly over one specific historical period and assuming it will repeat is a dangerous mistake.

    Markets change. A setting optimized for last quarter’s price action may be completely wrong for current conditions.

    Honestly, the traders who struggle most with grid bots are often the ones who spent the most time fine-tuning settings for a specific past period instead of testing for robustness across multiple different market conditions.

    Grid Bot vs DCA Bot

    These two bots get compared constantly, and the confusion is understandable.

    Both are automated. Both remove emotion from trading.

    Both work without you staring at a screen all day. But they are built to solve completely different problems, and using one when you need the other is a mistake that costs real money.

    Understanding the difference isn’t just academic. It directly affects which tool you should be running right now based on your goal and your current market view.

    What Each Bot Is Designed to Do

    A grid bot is a short to medium-term income tool.

    It profits from price oscillating up and down within a defined range.

    It doesn’t care where pric ends up. It just needs movement.

    If price stays flat or bounces predictably, the grid bot keeps collecting small profits on every round trip.

    Swipe to view full data →
    Feature Grid Bot DCA Bot
    Primary Goal Profit from price oscillation Accumulate asset over time
    Best Market Sideways, ranging Any, especially downtrends
    Time Horizon Short to medium term Long term
    Risk Type Trend breakout risk Drawdown and time risk
    Profit Style Many small frequent gains One larger long-term gain

    A DCA bot is a long-term accumulation tool.

    It buys an asset at regular intervals or when price drops by a set percentage, averaging down your entry price over time.

    It doesn’t try to profit from small oscillations.

    It builds a position slowly and bets that the asset will be worth significantly more at some point in the future.

    When to Use Both Together

    Here’s the interesting part.

    Some traders run both simultaneously, and when done correctly it actually makes sense.

    The grid bot generates small, consistent profits in the ranging phase of a market cycle.

    The DCA bot quietly accumulates the base asset during the same period, building a long-term position at averaged prices.

    The key word there is correctly.

    Running both bots on the same asset without testing each independently first is asking for trouble.

    Capital gets split, settings conflict, and you end up with two half-working strategies instead of one well-tested one.

    If you want to explore this combined approach, CryptoGates runs both a Grid Backtest Bot and a DCA Backtest Bot separately.

    Test each configuration on its own first.

    Confirm each one performs as expected. Then consider running both with clearly defined capital limits for each.

    A Grid Bot Is a Tool, Not a Guarantee

    A grid bot works.

    But it works the way any well-designed tool works.

    Use it in the right conditions, with tested settings, and it performs consistently.

    Use it in the wrong market with rushed configuration and it loses money just as systematically as it would have made it.

    REF: VOL-NEUTRAL-2026

    Neutralize Volatility.
    Own the Growth.

    Access systematic playbooks designed to eliminate emotional bias. From Spot HODL frameworks to advanced Grid simulators.

    ◒
    Spot & HODL
    ◈
    DCA Engine
    ▦
    Grid Tactics
    ☯
    Rebalance

    The traders who succeed with grid bots share the same habits.

    They test before they risk. They start with small capital and scale only after seeing verified results.

    They track fee impact, drawdown, and unrealized PnL together, not just total profit.

    They monitor market conditions and pause the bot when the environment shifts.

    And they never deploy capital they can’t afford to have locked in a position for weeks.

    CG STRATEGY ANALYZER

    Confused about
    market outlook?

    Trading without a plan is just gambling. Our strategy architect analyzes your risk tolerance and capital to match you with a proven algorithmic framework.

    PASSIVE DCA Bot
    AGGRESSIVE Grid Pro
    BALANCED Rebalance

    Grid bots aren’t passive income machines.

    They’re systematic trading tools that reward preparation and punish shortcuts.

    Use CryptoGates’ Grid Backtest Bot to simulate your settings on real historical data before a single dollar goes live.

    That one step alone puts you ahead of the majority of retail traders who deploy first and learn the hard way.

    FAQs

    Does a grid bot work in a bear market?

    A grid bot can work in a mild bear market if price stays within your range and oscillates enough to trigger levels. In a strong sustained downtrend it keeps buying a falling asset with no sell orders triggering, trapping capital fast.

    Starting with 8 to 12 grids works well for most beginners on liquid pairs like BTC/USDT or ETH/USDT. Too many grids on a narrow range creates spacing so tight that fees erase profit on every single trade.

    You can, but completely ignoring it creates real risk. A quick check every few days confirms price is still ranging within your boundaries and no major market move has pushed your bot outside its operating range.