

 Bitcoin
  Ethereum
  Solana
  TRON
TRON  Zcash
Zcash  Hyperliquid
  Dogecoin
  Monero
  Chainlink
  Cardano
  Stellar
  Uniswap
  Sui
Sui  Hedera
  Bittensor
  Shiba Inu
  Ripple USD
  Polkadot
  Aster
Aster  World Liberty Financial
  Render
  Artificial Superintelligence Alliance
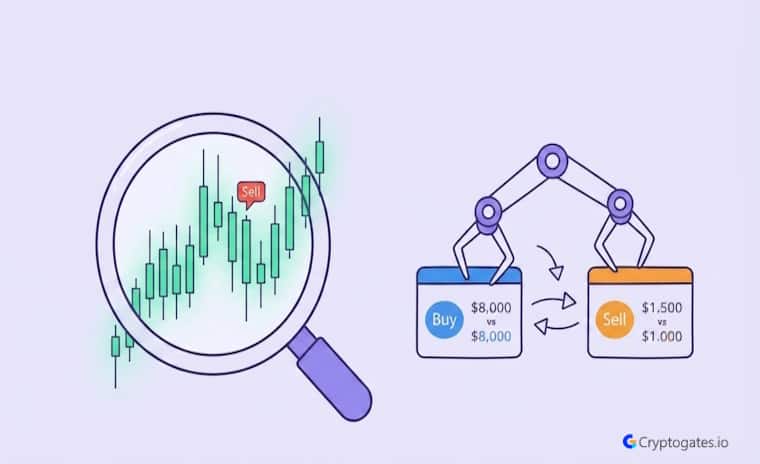
High volume looks like the dream setup. Fat spreads. Fast moves. Charts that scream opportunity every few minutes.
Here’s the thing though. Volume alone doesn’t make you money. Execution does.

Coinglass and independent liquidity studies
We wanted to know if an arbitrage strategy during high volume chaos actually holds up once fees, slippage, and delays enter the picture. Not in theory. In an actual test.
Ser, arbitrage sounds like free money on paper. Two exchanges. One price gap. Buy low, sell high, pocket the difference. Sounds easy, right?
But chaos changes everything. And that’s exactly what we tested.
- The Problem: Many traders think arbitrage is nearly risk-free, especially when high trading volume creates large spreads.
- The Solution: We tested a cross-exchange arbitrage strategy during high-volume market chaos to see if those spreads were actually tradable.
- The Incentive: Knowing whether arbitrage holds up under pressure helps you avoid chasing opportunities that vanish on execution.
- The Risk: Fees, slippage, transfer delays, and partial fills can quickly turn an apparent guaranteed profit into a loss.
What "High Volume Chaos" Means
Chaos isn’t just a vibe.
It’s a specific market condition, and it shows up in predictable ways once volume spikes hard enough.
Look, most traders picture chaos as just “the market moving fast.” That’s part of it. But the deeper story is about how prices across exchanges stop agreeing with each other, even for a few seconds.
1. What Happens During Volume and Volatility Spikes
When volume surges — one of the clearest signs of rising crypto volatility — order books thin out faster than people expect.
Buy and sell walls that looked solid a minute ago suddenly aren’t there anymore. Price starts moving in bigger jumps instead of smooth steps.
This is where things change.
Liquidity providers pull back. Market makers widen their quotes to protect themselves. That widening is exactly what creates the arbitrage window everyone gets excited about.
Research Insight:
Why Gross Opportunity Rarely Equals Net Profit
Traders tend to treat a visible price gap the way they’d treat a visible discount — as money already earned. Our internal testing across automated strategies tells a more complicated story. In a Grid Bot backtest run during a 33% BNB drawdown, the bot generated $163.94 in gross trading profit from 171 executed trades, yet the position still closed at a net loss once the underlying price decline was factored in. Gross activity and net outcome measured two different things entirely.
The same gap applies to arbitrage. A 1% spread is a gross figure — it describes a price difference, not a captured profit. Fees, slippage, and the time between confirming an opportunity and closing both legs all sit between that number and what actually lands in the account. Strategies that look identical on a spread chart can produce very different results depending on what happens between signal and fill.
View Complete Playbook: Grid Bot vs. a 33% BNB Crash
2. Common Chaos Conditions (Slippage, Spread Expansion, Delayed Fills)
Four things tend to show up together during chaos: fast price moves, wider spreads, slippage on execution, and fills that take longer than usual.
Here’s what actually matters. Each one of these eats into the theoretical profit you thought you had, and the hidden cost of a trade is usually far bigger than the advertised fee.
A spread that looks like a solid 1% gap can shrink to almost nothing once your order actually fills.
3. Why Chaos Creates More Opportunity — and More Risk
More chaos, more mispricing. That part is true.
Exchanges genuinely do disagree more during volume spikes — we saw the same dynamic play out when we put a grid strategy through a real market crash — and those disagreements are where arbitrage profit comes from.
But there’s a problem.
The same chaos that creates the gap also makes it harder to execute cleanly. Higher reward and higher risk aren’t separate here. They’re the same event.
Battle-Test Your Strategy
Before the Market Does.
Eliminate guesswork with institutional-grade backtesting for DCA, Grid, and Rebalance bots. Real historical data. Real-world results.
4. Example of Exchange Price Divergence During Chaos
Picture this.
BTC dumps hard on one exchange because of a large sell order. For a few seconds, that exchange shows a price noticeably lower than everywhere else. Traders watching closely could, in theory, buy there and sell on another exchange showing the normal price.
Sounds simple.
In practice, dozens of bots are racing for that same gap in milliseconds. By the time a manual trader confirms the opportunity, it’s often already gone.
The Arbitrage Strategy We Tested
We kept the strategy simple on purpose. Complexity doesn’t help when you’re already dealing with chaotic conditions.
1. Strategy Type (Cross-Exchange, Price-Gap, Spread Trading)
This was a cross-exchange spot arbitrage setup.
The idea: monitor the same asset across two exchanges and act when the price gap crosses a set threshold.
No derivatives. No leverage. Just spot price differences, which keeps the risk profile easier to reason about.
2. Assets, Exchanges, and Test Setup
We focused on a major, highly liquid asset rather than a random altcoin. Low-liquidity assets tend to show “fake” spreads that vanish the moment you try to trade them.
Two verified crypto exchanges were used for comparison, both with reasonable volume and API access for price monitoring.
3. Manual, Semi-Automated, or Bot Execution
Honestly, this matters more than most people think. We used a semi-automated setup. Price monitoring was automatic. Trade execution required a manual confirmation step.
That single detail changes the results a lot, and we’ll get into why later.

It can be, but net profit depends heavily on execution speed and fees. Gross opportunity and net reality are often very different numbers.
4. Entry and Exit Logic Explained Simply
Simple put: if the price gap between the two exchanges crossed a minimum threshold, after accounting for estimated fees, the system flagged it.
Exit meant executing both legs, buy on the cheaper exchange, sell on the more expensive one, as close to simultaneously as possible.
Stop Guessing.
Stress Test Your Edge.
The market doesn't care about your backtest. Our engine simulates 1,000+ "what-if" scenarios to ensure your strategy is built for survival.
Run Crypto Strategy Engine →Test Conditions and Assumptions
Assumptions decide almost everything in arbitrage. Get one wrong, and a profitable-looking setup turns into a loss.
1. Fees, Transfer Times, Minimum Trade Size, Slippage
We built in trading fees on both exchanges, not just one.
That’s a common mistake beginners make. They calculate the spread and forget fees get charged twice.
Data Highlight:
Fee Load Quietly Decides the Real Edge
Fees rarely get top billing in strategy breakdowns, but they tend to be the difference between a strategy that works on paper and one that works in an account. In a BTC Grid Bot test run through a 10% May rally, the strategy returned +7.74% while spending just $3.26 in fees across the entire test window — a fee load light enough that it barely dented the result.
That’s a useful contrast for arbitrage specifically, where two separate legs, two separate exchanges, and often a transfer step mean fees get charged more than once per round trip. A strategy that looks profitable when fees are estimated at a flat percentage can behave very differently once real, per-leg costs are applied. Low-fee execution isn’t a nice-to-have in arbitrage — it’s closer to a precondition for the spread surviving the trip from signal to settlement.
View Complete Playbook: BTC Grid Bot Backtest — May 2025
Transfer times were assumed to be non-instant, since moving funds between exchanges almost never happens in real time.
Minimum trade size was kept realistic too, not some idealized bulk amount. Slippage was estimated conservatively based on order book depth at the time.
2. Why Assumptions Matter More in Arbitrage Than Directional Trades
In a normal directional trade, being off by a small percentage on your entry doesn’t ruin the trade. In arbitrage, margins are thin to begin with.
Confused about
market outlook?
Trading without a plan is just gambling. Our strategy architect analyzes your risk tolerance and capital to match you with a proven algorithmic framework.
The simple truth is this: if your fee assumption is wrong by even half a percent, you can flip a “profitable” trade into a losing one. There’s very little room for error here compared to trend-following or swing setups.
How the Strategy Worked in Practice
The Arbitrage Execution Workflow
- Detect a price gap above the minimum threshold
- Confirm there's enough liquidity to fill both legs
- Place buy and sell orders as close to simultaneously as possible
- Monitor for slippage or partial fills during execution
- Record the final net result after fees and transfers
1. The Execution Workflow (Detect, Confirm, Place, Manage, Record)
This sounds clean on a checklist.
In practice, it’s a lot messier. Detection was fast. Confirming liquidity took a few extra seconds. And those seconds mattered more than we expected going in.
2. When Spreads Looked Good but Orders Filled Badly
Here’s the issue.
Several times, the spread on screen looked great right up until the order actually filled. By the time the sell leg executed, the price had already moved back toward normal.
This wasn’t rare either. It happened often enough that it became the main theme of the entire test, not a one-off edge case.
What the Results Showed
Numbers matter more than impressions here.
So let’s look at what actually happened, not what the setup felt like in the moment.
1. Net Return, Hit Rate, and Fee Survival
Gross opportunities appeared frequently.
Net profitable trades, after fees and slippage, showed up far less often. A meaningful chunk of flagged opportunities didn’t survive contact with real execution costs.
The hit rate on trades that were actually placed was decent, but nowhere near what the raw spread data suggested going in.
Bots and algorithmic traders react in milliseconds, closing price gaps almost as soon as they appear. Manual or slower execution often misses the window entirely.
Why Arbitrage Is Harder Than It Looks
“Risk-free” gets thrown around a lot with arbitrage. Ngl, that word doesn’t hold up once you actually run the numbers in live, chaotic markets.
1. Fees, Latency, and Liquidity Gaps
Fees stack up fast when you’re trading both legs on two separate exchanges.
Latency, even a second or two, can be the difference between catching a spread and missing it entirely.
Proven Setups &
Expert Breakdowns.
We don't just show you the data; we engineer and validate high-performance strategies, providing the "Alpha" behind the numbers.
Liquidity gaps make things worse.
A spread might exist on paper, but if there isn’t enough depth to fill your full size, you’re stuck taking a partial trade at a worse average price.
2. Partial Fills, Transfer Delays, and Spread Collapse
Partial fills were one of the bigger issues during testing. Getting half your order filled at the target price and the rest at a worse price quietly erodes the edge.
Transfer delays matter too, especially when moving funds between exchanges to rebalance positions. And sometimes the spread just collapses mid-trade, closing before both legs complete.
Best Use Cases for This Strategy
Arbitrage isn’t dead as a strategy. It just needs the right conditions to actually work.
1. When It's Most Viable (Liquidity, Predictable Spreads, Fast Execution)
This setup performs best in highly liquid markets, where spreads open up in patterns you can actually plan around.
Fast, low-latency execution infrastructure matters more here than almost anywhere else in trading.
If you’re working with a major asset and solid infrastructure, arbitrage can still make sense as part of a broader strategy.
2. When It's Least Viable (Low Liquidity, Slow Transfers, High Fees)
Low liquidity assets are the opposite. Spreads look juicy but vanish the second you try to trade real size.
Slow transfer times between exchanges and high fee structures make the math even worse.
Chasing arbitrage under these conditions usually means chasing spreads that were never really there.

Zaheer here. This is a good example of why we say verify first, risk later. Arbitrage looks clean on paper, but the real edge only shows up once you test it against real fees, real delays, and real chaos. Scale slowly, even when a strategy looks solid on the surface.
Final Verdict — Was Arbitrage Worth It During the Chaos?
So, was it worth it? Realistically, yes, but only under the right conditions and at the right size.
High volume chaos does create real price gaps between exchanges.
That part checked out. But the same chaos that creates the opportunity also makes execution messier, slower, and less predictable.
Gross opportunity looked strong throughout the test. Net reality was a lot more modest once fees, slippage, and delayed fills entered the picture.
Neutralize Volatility.
Own the Growth.
Access systematic playbooks designed to eliminate emotional bias. From Spot HODL frameworks to advanced Grid simulators.
The takeaway isn’t that arbitrage doesn’t work. It’s that arbitrage without proper testing is just guessing with extra steps.
Verify first. Risk later.
Scale slowly, exactly the way this strategy needs to be approached.
If you want to see how a strategy like this holds up before risking real capital, run it through the Backtest Bot and check your own assumptions against real market data.
FAQs
Is crypto arbitrage risk-free?
No. Fees, slippage, and execution delays mean arbitrage carries real risk, even though it’s often marketed as risk-free.
Does high trading volume make arbitrage easier?
Not exactly. Volume creates more price gaps, but it also makes execution less predictable and fills less reliable.
What matters most for arbitrage to work?
Fast execution and reliable liquidity matter more than the size of the spread itself.