🌐 Explore, share, learn & grow.

🧭 Confused about market outlook?

  • bitcoinBitcoin (BTC) $ 77,408.00 0.21%
  • ethereumEthereum (ETH) $ 2,246.14 0.83%
  • solanaSolana (SOL) $ 95.78 0.48%
  • tronTRON (TRX) $ 0.318083 4.73%
  • zcashZcash (ZEC) $ 1,285.60 3.72%
  • hyperliquidHyperliquid (HYPE) $ 86.98 4.23%
  • dogecoinDogecoin (DOGE) $ 0.075264 0.41%
  • moneroMonero (XMR) $ 593.49 1.16%
  • chainlinkChainlink (LINK) $ 11.56 4.68%
  • cardanoCardano (ADA) $ 0.192534 0.01%
  • stellarStellar (XLM) $ 0.169145 1.62%
  • uniswapUniswap (UNI) $ 6.98 1.09%
  • suiSui (SUI) $ 0.894950 1.39%
  • hedera-hashgraphHedera (HBAR) $ 0.072009 0.07%
  • shiba-inuShiba Inu (SHIB) $ 0.000005 1.85%
  • bittensorBittensor (TAO) $ 235.13 1.28%
  • ripple-usdRipple USD (RLUSD) $ 1.00 0%
  • aster-2Aster (ASTER) $ 0.695998 2.13%
  • polkadotPolkadot (DOT) $ 0.953252 0.89%
  • world-liberty-financialWorld Liberty Financial (WLFI) $ 0.050203 0.55%
  • render-tokenRender (RENDER) $ 1.57 1.2%
  • fetch-aiArtificial Superintelligence Alliance (FET) $ 0.160826 1.38%
Trend Following Strategy
BTC/USDT, ETH/USDT Futures Short Term

Pure Price Action Strategy: Market Structure & Supply/Demand Zones

A 3-step mechanical price action strategy focused on valid market structure, supply/demand zones, and a strict 2.5:1 Risk-to-Reward ratio.

STRATEGY CONTRIBUTOR

Strategy shared by

Eshal
Eshal
@eshalsajid
View Profile
STRATEGY OVERVIEW

Strategy Snapshot

The key details of this trading strategy at a glance.

Strategy Type
Trend Following
Assets
BTC/USDT, ETH/USDT
Market
Futures
Time Horizon
Short Term
Risk Profile
Moderate
Trading Frequency
Several Times a Week
THE GAME PLAN

Strategy Rules

The core rules that define how this strategy works.

1) TREND (Market Structure)
Uptrend = higher highs + higher lows. Downtrend = lower lows + lower highs.
The trend stays valid until the key swing low (uptrend) or swing high (downtrend) is broken.

2) MARK ZONES
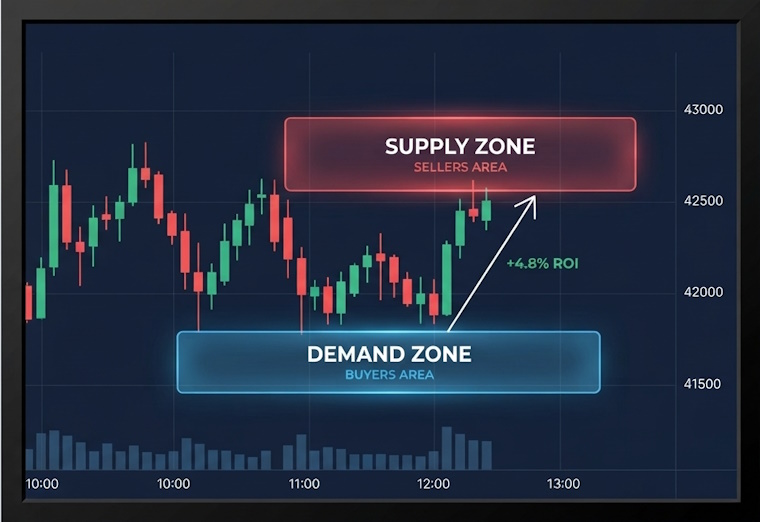
Uptrend: find a small consolidation right before a strong move up. Mark that last candle (low to high) as a Demand zone.
Downtrend: find a consolidation right before a strong move down. Mark that candle as a Supply zone.

3) TRADE
Entry: when price comes back to retest the zone (Long at Demand, Short at Supply).
Stop loss: just below the Demand zone (Long) or just above the Supply zone (Short).
Take profit: recent high (Long) or recent low (Short).
Filter: minimum 2.5:1 risk-to-reward. If it is lower, skip the trade.

INSIDE THE STRATEGY

Strategy Details

Explore the complete strategy, including its approach, entry and exit rules, and risk management.

A simple price action strategy with no indicators. It is built on three steps: read the trend, mark the zone, and check the risk-to-reward before entering.

STEP 1: READ THE TREND (MARKET STRUCTURE)
– Uptrend: higher highs and higher lows.
– Downtrend: lower lows and lower highs.
– The trend stays valid until the key swing point is broken (the last important low in an uptrend, the last important high in a downtrend).
– Only look for Longs in an uptrend and Shorts in a downtrend. Do not trade against the structure.

STEP 2: MARK THE SUPPLY OR DEMAND ZONE
Demand zone (uptrend):
1. Find a small sideways consolidation right before a strong move up.
2. Draw a box over the last candle before that move, from its low to its high.
3. Wait for price to come back into the box.

Supply zone (downtrend):
1. Find a small consolidation right before a strong move down.
2. Draw a box over the last candle before that move, from its low to its high.
3. Wait for price to come back up into the box.

STEP 3: CHECK RISK-TO-REWARD BEFORE ENTRY
– Entry: when price retests the zone.
– Stop loss: just below the Demand zone (Long) or just above the Supply zone (Short).
– Take profit: the recent high (Long) or the recent low (Short).
– Minimum 2.5:1 risk-to-reward. Example: risking $100 should give a target of $250 or more. If the setup offers less, skip it.

WHEN TO AVOID IT
– During high-impact news, when price can move fast and slip.
– In tight sideways ranges with no clear swing highs and lows.
– When you cannot place a clear stop loss.

HOW TO PRACTICE
Before using real money, go back on the chart, find past setups that follow these rules, and note how many reached the target and how many hit the stop. Keep the same 2.5:1 filter while you do this.

WATCH & LEARN

Strategy Video

Watch the creator explain this strategy in more detail.

A NOTE FROM THE CREATOR

Creator's Note

Sharing this simple price action framework for learning and discussion. It is based on a TradingLab video, written in my own words. The key rules: trade only with the trend, wait for a retest of the zone, and skip any setup below 2.5:1 risk-to-reward. No backtest results here, so please review it on past charts before using real money.

See something misleading or inappropriate? Report this Strategy
Found this strategy useful? Share it with others or contribute your own.
Share Your Strategy
PUT YOUR STRATEGY TO THE TEST

Ready to Test This Strategy?

Don't rely on assumptions. Backtest your strategy against historical market data and see how it performs.

Backtest This Strategy