Bitcoin
 Ethereum
 Solana
 TRON
 Zcash
 Hyperliquid
 Dogecoin
 Monero
 Chainlink
 Cardano
 Stellar
 Uniswap
 Sui
 Hedera
 Shiba Inu
 Bittensor
 Ripple USD
 Aster
 Polkadot
 World Liberty Financial
 Render
 Artificial Superintelligence Alliance


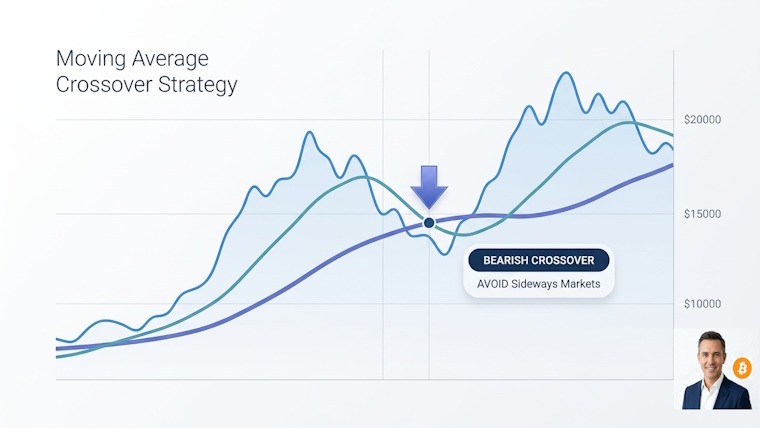
This post summarizes the moving average crossover strategy from the Trading Data video "Best Moving Average Crossover Trading Strategy Explained (20 & 50 MA)". The method is from the video. This is my summary of its rules.
THE PROBLEM WITH CROSSOVERS
Most traders buy every time the 20 MA crosses above the 50 MA and sell every time it crosses below. That only works in strong trends. In a sideways market you get faked out again and again. Using too many moving averages gives late entries, and using lower timeframes adds noise and false signals.
THE SETUP
– Use only two moving averages: the 20 and the 50. (The video does not say SMA or EMA, so use the same type for both and test.)
– Use higher timeframes such as 15-minute, 1-hour or 4-hour, for cleaner signals.
– Add a 200 MA as a trend filter.
THE GOLDEN RULE: ONLY TRADE THE NEXT CROSSOVER IF THE LAST TWO WORKED
Look back at the two most recent crossovers. Did price follow through in the same direction after each cross? If both were winning moves, you can trade the next signal. If even one failed, skip the trade. The video says this one filter removes most bad setups.
ENTRY RULES
– Buy: the 20 MA crosses above the 50 MA, and price is above the 200 MA.
– Sell: the 20 MA crosses below the 50 MA, and price is below the 200 MA.
Only trade in the direction of the 200 MA. The video claims this filter can lift a win rate from about 38% to about 48%. That is the video's own claim, and I have not verified it.
STOP LOSS AND TAKE PROFIT
– Stop loss: just below the recent swing low for a buy. (For a sell, the mirror is just above the recent swing high.)
– Take profit: twice the size of the stop.
A SIMPLE NUMBER EXAMPLE (example numbers, not a real trade)
Buy at 100 with the stop at 98, so the risk is 2. The target is twice that: 104. With a 2 to 1 reward-to-risk, you break even at a win rate of about 1 in 3 (33%) before fees. Fees and slippage push that number up, so a higher win rate is needed in practice.
USE MOVING AVERAGES AS DYNAMIC SUPPORT AND RESISTANCE
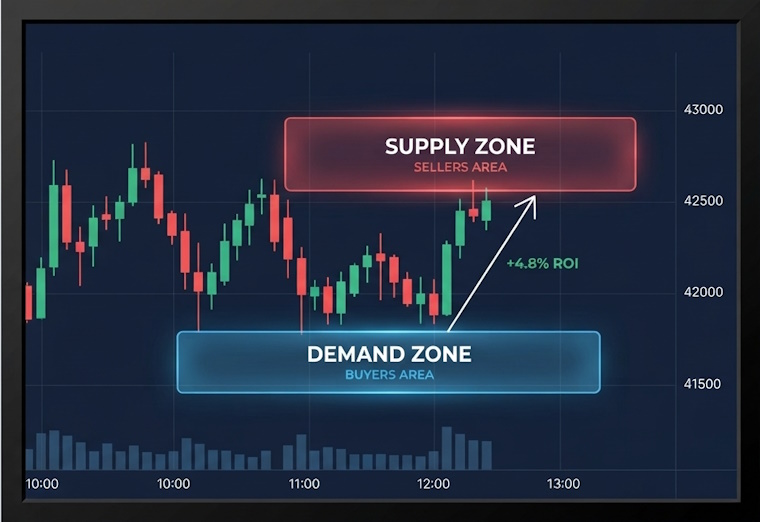
Price often bounces off a moving average or gets rejected by it. The video's example: if price keeps bouncing off the 50 MA and the RSI shows overbought, that is a high-probability short. If price dips to the moving average and the RSI shows oversold, that is a solid long setup. The video does not give exact RSI levels; 70 and 30 are the common defaults.
WHEN IT MAY WORK
Strong trending markets, where crossovers are followed by real moves.
WHEN IT MAY STRUGGLE
– Sideways or ranging markets: the 20 and 50 cross back and forth and give false signals.
– Lower timeframes, which are full of noise.
– Sell trades need a Futures market. Futures and leverage add risk.
– The golden rule can make you skip many trades, so signals will be less frequent.
TRY IT YOURSELF
The video itself says to backtest it. Put the 20 MA, 50 MA and 200 MA on a BTC/USDT 1-hour or 4-hour chart, mark past crossovers, and check how many of them followed through. Test different periods and include fees.
SOURCE
Trading Data: "Best Moving Average Crossover Trading Strategy Explained (20 & 50 MA)" (video linked in this post). All credit for the method goes to the creator.
RISK
No backtest of my own is included here. This is not financial advice. No strategy wins every trade. Always use a stop loss and a small position size. Only use money you can afford to lose.