
 Bitcoin
  Ethereum
  Solana
  TRON
TRON  Zcash
Zcash  Hyperliquid
  Dogecoin
  Monero
  Chainlink
  Cardano
  Stellar
  Uniswap
  Hedera
  Sui
Sui  Shiba Inu
  Bittensor
  Ripple USD
  Polkadot
  Aster
Aster  World Liberty Financial
  Render
  Artificial Superintelligence Alliance
You just added 50 more grids to your bot, and the profit number barely moved.
Sound familiar?
Here’s the thing about grid density grid trading bot setups: everyone assumes stacking more levels just means more money.
More trades, more fills, more profit, right?
Not exactly.
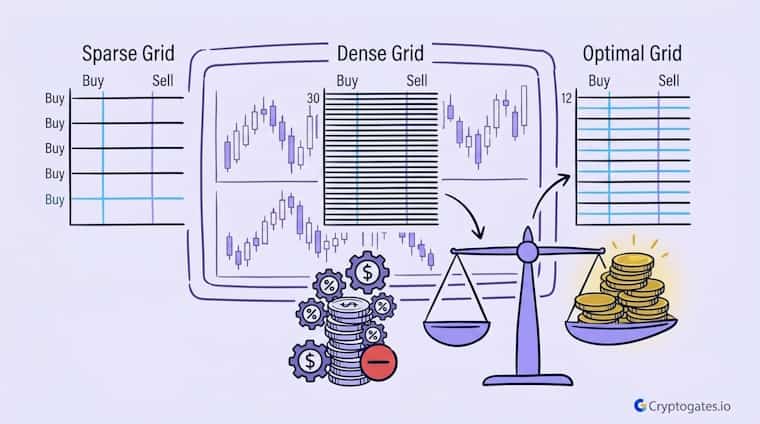
Grid density is simply how many buy and sell levels sit inside your price range, and cranking that number up doesn’t scale your returns the way most beginners expect.

Source: KoinX
Somewhere between “not enough grids” and “way too many grids,” there’s a spot where density actually works for you instead of against you.
Finding it is the real skill.
- The Problem: Most traders assume adding more grids to a bot automatically means more profit, then get confused when returns barely shift.
- The Solution: Grid density has to match your price range and volatility, not just get maxed out because "more" sounds better.
- The Incentive: Get the density right and you pull more out of the same range without bleeding it all back out in fees.
- The Risk: Push density too high in a wide or trending range and fees can quietly eat more than the strategy captures.
What "Grid Density" Actually Means in a Grid Bot
Grid density sounds technical, but honestly, it isn’t.
It’s just how many buy and sell levels your grid bot places between the top and bottom of your chosen range.
| Aspect | Low Grid Density | High Grid Density |
|---|---|---|
| Trade Frequency | Fewer fills, spaced apart | Frequent fills, tight spacing |
| Fee Exposure | Lower total fees | Higher total fees over time |
| Best Fit | Wider, choppier ranges | Tight, low-volatility ranges |
| Management Feel | Feels slower, less to watch | Feels active, more to track |
Think of it like slicing a pizza.
Fewer slices mean bigger pieces.
More slices mean smaller ones.
Same pizza either way.
1. Why Most Beginners Default to a Low Grid Count
Most new grid traders start small on purpose.
A handful of grids feels safer. Feels easier to understand.
Feels like less can go wrong. That instinct isn’t wrong exactly; it’s just incomplete.
Real Backtest Example
Fee Drag in Real Numbers
Fees feel abstract until you count fills. In our XRP grid backtest, price opened at $2.08 and closed at $2.09 after 90 days, basically flat. The bot still fired 875 trades and generated $1,817.91 in gross grid profit. Net profit came in at $1,387.14, so about $430, roughly a quarter of the gross figure, sat between what the grid earned and what the trader kept.
That’s the trade-off from this section in real numbers. The bot still returned 27.74% because the range was choppy enough for each fill to pay its own way. Fees only become a problem when the spacing between levels is too thin to cover what a round trip costs.
Read the full test: XRP Went Nowhere for 3 Months – Our Grid Bot Made +27.74% Anyway
Low density keeps things simple.
Fewer trades, fewer numbers, fewer decisions to second-guess.
But simple doesn’t always mean optimal, and that’s usually where the confusion kicks in for a lot of traders once they see someone else running double their grid count.
2. What Changes When You Push the Grid Count Higher
Add more levels and the bot starts firing more often, like the 55-grid SUI bot that fired 1,759 trades in 38 days.
More buys, more sells, more small wins stacking up through the day.
Sounds great, until you remember that the real cost of a trade runs well above the advertised fee.

Not really. More grids mean more trades, but each trade adds a fee. Past a certain point, those extra fees can quietly cancel out the gains from all that added activity.
Wait, here’s the issue.
Fees eat into that stack of small wins fast, especially on exchanges like Binance or Pionex, where fills happen constantly, and Pionex’s 0.05% trading fee applies to every one of them.
The bot isn’t doing anything wrong by trading more.
The range and fee structure just need to actually support that pace.
Does More Grids Always Mean More Profit?
The honest answer is it depends, and that’s probably not what you wanted to hear.
Grid count doesn’t work in a vacuum.
It works against your price range, your volatility, and how much of your gains fees are allowed to eat.
Real Backtest Example
20 vs. 45 vs. 80 Grids on NEAR
- Strategy: Grid bot, tested at three different densities
- Coin: NEAR
- Market condition: One shared 45-day window, so grid count was the variable being tested
- Objective: See whether more grids actually beat fewer, and whether either beat buy & hold
- Key result: The 45-grid setup returned 17.18% ROI and was the only configuration to beat buy & hold. The 20-grid and 80-grid versions both trailed it.
Expert interpretation: Neither extreme won, which is the same trade-off this article describes. Too few levels leave price swings uncaptured. Too many squeeze the profit on each level against trading costs. The middle setup won on this range, and a different range or volatility profile would likely move that sweet spot.
Full test: 20 Grids, 45 Grids, 80 Grids: Only One Beat Buy & Hold on NEAR
Zoom out for a second.
A grid bot is basically farming small, repeated price swings inside a box.
Density decides how finely you’re slicing that box.
Slice too coarse, and you miss moves. Slice too fine, fees start winning instead of you.
Stop Guessing.
Stress Test Your Edge.
The market doesn't care about your backtest. Our engine simulates 1,000+ "what-if" scenarios to ensure your strategy is built for survival.
Run Crypto Strategy Engine →1. The Trade Frequency vs. Fee Drag Balance
Every extra grid level you add is another chance for a fill, sure, but it’s also another fee.
That trade-off is the entire game here.
In a market that’s barely moving, tighter grids catch more of the small wiggle.
In a market swinging wide, wider grids let you actually capture the bigger moves without wasting fills on noise.
Source: Binance
Look, this is exactly why “just max out the grids” is bad advice without context.
Frequency without a fee-aware structure is just… expensive noise.
2. When a Tight, Choppy Range Rewards Higher Density
Not every setup punishes high density, though.
When a coin gets stuck grinding sideways in a narrow band, and this happens more often than people realize, higher density can actually thrive.
Smaller, more frequent captures inside a tight box tend to add up faster than a handful of wide, spaced-out trades.
More grids tend to work better in a tight, low-volatility range where price keeps bouncing inside a small band. In a wider or trending market, fewer, wider grids usually hold up better.
The overlooked factor here is range width.
A dense grid inside a wide range is where fee drag usually shows up worst.
A dense grid inside a genuinely tight range is a different story entirely.
Finding Your Own Grid Density Sweet Spot
There’s no universal magic number here, and honestly, anyone who tells you otherwise is skipping the part where your range and volatility actually matter.
Somewhere around 15 to 30 grids tends to be a reasonable starting range for most setups, though that number shifts depending on how tight your price box is and how much fee drag your exchange charges per trade.
Battle-Test Your Strategy
Before the Market Does.
Eliminate guesswork with institutional-grade backtesting for DCA, Grid, and Rebalance bots. Real historical data. Real-world results.
The real move isn’t guessing your way to a density that feels right.
It’s testing a few counts against the same range and watching what the numbers actually say, which is exactly what CryptoGates’ Grid Strategy Backtest Bot is built for.
FAQs
What is grid density in crypto grid trading?
Grid density refers to how many buy and sell levels a grid bot places inside your chosen price range. Higher density means tighter spacing between levels.
Is a higher grid count always better for a grid bot?
No. More grids mean more trades and more fees, so returns don’t scale in a straight line. The right count depends on your range and volatility.
How do I know the right number of grids for my strategy?
Backtest a few different grid counts against the same price range and compare the results. That’s the only reliable way to see what actually fits your setup.