Ser, be honest with yourself for a second.
How many trades did you look at before you decided your strategy actually works?
If the number is somewhere around 10 or 15, ngl, you haven’t tested anything yet. You’ve just gotten lucky or unlucky, and your brain is calling it proof either way.

(Source: Quantitative trading research)
A statistically valid backtest needs way more data than most beginners think, and that gap is exactly why so many “profitable” strategies fall apart the moment real money touches them.
This pattern aligns with 97% of day traders losing money in their first year of trading. Here’s the thing.
The market doesn’t care how confident you feel after a good streak.
- The Problem: Most traders judge a strategy after 10-20 trades, which is barely enough to say anything statistically meaningful.
- The Solution: Understanding the real trade count threshold, and using tools like the Crypto Strategy Engine, separates real edge from a lucky streak.
- The Incentive: Fewer blown accounts from strategies that only ever “worked” on a tiny, lucky sample.
- The Risk: Even a large sample doesn’t guarantee future performance, it just lowers the odds you’re fooled by randomness.
Why Trade Count Decides If Your Backtest Means Anything
Look, this is where most beginners get tripped up.
A strategy can win 8 out of 10 trades and still be garbage.
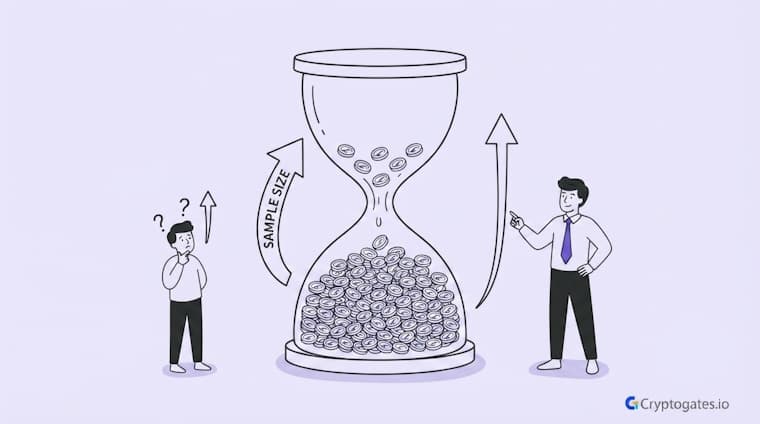
Not because the math is wrong, but because 10 trades isn’t a sample; it’s basically a coin flip with extra steps. Small numbers swing wildly.
Backtest Sample Size Audit
- Did you test fewer than 30 trades? Treat results as unreliable.
- Did your sample include only one market condition? Red flag.
- Did you cherry-pick the date range? Results are biased.
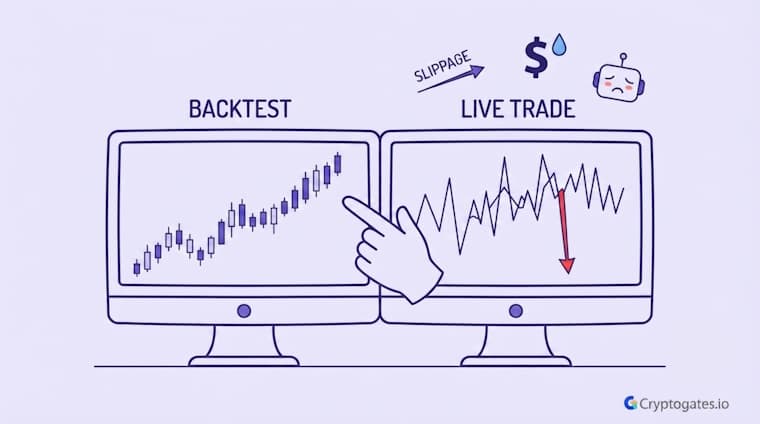
- Did you ignore fees and slippage? Numbers are inflated.
- Did you test across multiple assets? Stronger validity signal.
One good week can make a mediocre system look genius, and one bad week can make a solid system look broken.
That’s not an opinion, tbh; that’s just how probability works when your sample is tiny.
1. What “Statistically Valid” Actually Means in Trading
Statistically valid doesn’t mean guaranteed.
It means the pattern you’re seeing is unlikely to be random noise dressed up as an edge. That’s it. It’s a confidence thing, not a certainty thing.
A strategy can be statistically valid and still lose money next month, a caveat regulators echo in guidance noting that backtested performance is hypothetical, never a guarantee of future returns.
What it can’t do is claim to have “proven” anything off a handful of trades. The math just doesn’t support that conclusion, no matter how good the equity curve looks on your screen.
2. The Danger of Judging a Strategy on 10-20 Trades
Here’s the issue.
A coinflip strategy, one with genuinely zero edge, can produce a 70% win rate over 10 trades just by chance.
It happens more often than people assume.
Bagholders love to defend a strategy because “it worked the last dozen times,” not realizing a dozen times proves almost nothing in a market this noisy.
The real test only shows up once the sample grows large enough to drown out luck.
The Real Number of Trades You Need
So what’s the actual number?
Most quants treat 100 trades as a reasonable floor and 300 or more as the point where results start to hold up against a proper crypto backtesting methodology.
Battle-Test Your Strategy
Before the Market Does.
Eliminate guesswork with institutional-grade backtesting for DCA, Grid, and Rebalance bots. Real historical data. Real-world results.
That might sound like a lot, sir, but crypto moves fast enough that hitting these numbers isn’t unrealistic, especially once you’re backtesting across months or years of historical data instead of watching live trades trickle in one at a time.
1. Why 30 Trades Is the Bare Statistical Minimum
Thirty shows up a lot in stats textbooks because it’s roughly where basic distribution assumptions start to hold up.
Below that, you’re working with numbers too small for standard statistical tools to say much of anything.
| Trade Count | Confidence Level |
|---|---|
| Under 30 | Statistically meaningless |
| 30-99 | Weak, bare minimum |
| 100-299 | Reasonable confidence |
| 300+ | Strong, professional-grade |
Above it, at least the math stops actively lying to you.
But here’s the catch. Thirty is a floor, not a finish line.
It’s the point where you can stop calling your results “meaningless” and start calling them “weak.”
2. Why Professionals Push Past 100 or 300 Trades
More trades mean luck gets diluted.
A five-trade winning streak barely moves the needle once it’s buried inside 200 other trades. That’s the whole point.
Professional quants and prop desks generally won’t take a strategy seriously below a few hundred trades, because anything less still leaves too much room for randomness to be doing the heavy lifting instead of actual edge.
Real Backtest Example
Strategy: Geometric Grid Bot
Coin: PEPE/USDT
Market Condition: Flat, high-volatility chop (near-zero net price change over 62 days)
Objective: Test whether trade volume alone can generate edge when price direction offers none
Key Result: 256 trades fired inside a single test window, producing +11.07% ROI while the underlying coin moved -0.92%
Expert Interpretation: This is the kind of sample size the “100 or 300 trades” threshold is actually talking about. A single grid bot run generated more executed trades than most manual traders rack up in a year of live discretionary trading. That volume is exactly why the result holds weight, it isn’t one lucky session, it’s 256 independent data points inside the same regime, and the outcome held up across nearly all of them rather than depending on one or two outlier trades.
View Complete Playbook: 256 Trades. A Coin Down -0.92%. A Bot Up +11.07%. This Is What Geometric Grids Do to Meme Coin Volatility

Fifty is better than 10 or 20, but it’s still on the thin side. It clears the bare statistical minimum but won’t hold up across different market regimes. Treat it as an early signal, not final proof.
How Market Regimes Change This Number
Here’s what most guides miss.
Three hundred trades from a single six-month bull run doesn’t tell you what happens when the market chops sideways for a year.
A strategy needs exposure across bull, bear, and range-bound conditions, including the sustained downtrends Binance Academy defines as bear markets, not just a stretch where everything was pumping. Otherwise, you’re not testing a strategy; you’re testing one specific market mood.
Research Insight
Traders often assume a strategy either “works” or “doesn’t,” treating the test window as a single verdict. Our internal Playbook data tells a different story. In one DCA backtest on TAO, the coin pumped 36% and then round-tripped into a 17% loss, all inside the same test period.
That’s technically one continuous window, but functionally two opposite market regimes stitched together: a strong uptrend followed by a hard reversal.
Strategy: DCA Bot
Coin: TAO/USDT
Market Condition: Sharp pump followed by a reversal into a 17% net loss
Objective: See whether a strategy tuned for accumulation survives a regime flip inside a single run
Key Result: 139 of 140 sessions closed in profit, netting +$1,677 despite spot holders ending the period down 17%
Expert Interpretation: This is the practical version of what the article calls regime exposure. A sample size number on its own says nothing about whether the market conditions inside that sample actually varied. 140 sessions spanning a pump-then-dump cycle tells you far more about a strategy’s durability than 140 sessions from a single uninterrupted trend would.
View Complete Playbook: TAO Pumped 36%, Then Bled Back to a 17% Loss — Our DCA Bot Still Banked +$1,677
How to Check If Your Sample Size Is Actually Reliable
Okay, so you’ve got more than 30 trades. Does that mean you’re done?
Not quite. Trade count is just the starting point.
The real question is whether your results hold up once you account for the natural randomness baked into any sample, even a decent-sized one.
1. Using Confidence Intervals and Standard Deviation
Here’s a simple gut check.
If your win rate is 55% but the confidence interval around that number stretches from 35% to 75%, you don’t actually know if you have an edge.

Zaheer puts it simply: verify first, risk later, scale slowly. A backtest with a shaky sample size is still a guess wearing a strategy’s clothes.
You just guess with a number attached.
Wide intervals mean your sample size hasn’t done its job yet.
The tighter the range around your results, the more the data is actually telling you something instead of just reflecting noise.
2. Why the Crypto Strategy Engine’s Monte Carlo Approach Solves This
This is where things get interesting. Instead of trusting one single backtest run, the Crypto Strategy Engine reshuffles your trade sequence thousands of times through Monte Carlo simulation.
If your Robustness Score holds steady across those thousands of “what-if” universes, your edge is probably structural.
Your results become statistically meaningless, even if the equity curve looks great. A small sample can’t separate genuine edge from a random lucky streak, which means you’re risking real capital on what’s essentially a guess.
If the score swings wildly from run to run, ser, that’s the market politely telling you it was luck all along.
It’s basically stress testing your sample size assumptions instead of just trusting them blindly.
Trade Count Is the Foundation of Every Real Backtest
At the end of the day, sample size isn’t some boring technicality you can skip past.
It’s the difference between testing a strategy and just watching a coin flip land your way a few times in a row.
Stop Guessing.
Stress Test Your Edge.
The market doesn’t care about your backtest. Our engine simulates 1,000+ “what-if” scenarios to ensure your strategy is built for survival.
Run Crypto Strategy Engine →Thirty trades get you out of “meaningless” territory.
A few hundred gets you somewhere close to real confidence. Anything less, and you’re building conviction on noise, not data.
Run your own parameters through the Crypto Strategy Engine and see what the Monte Carlo simulation actually says about your edge before you scale anything with real capital.
FAQs
How many trades do I need before I trust a backtest?
Thirty trades is the bare statistical minimum, but most quants want 100 to 300 before trusting the results with real confidence.
Can a strategy with only 20 trades still be profitable?
It can look profitable on paper, but 20 trades isn’t enough to tell if that’s a real edge or just a lucky streak.
Does more trades always mean a better strategy?
No, more trades just means more statistical confidence. The strategy still needs to survive different market regimes to hold up.











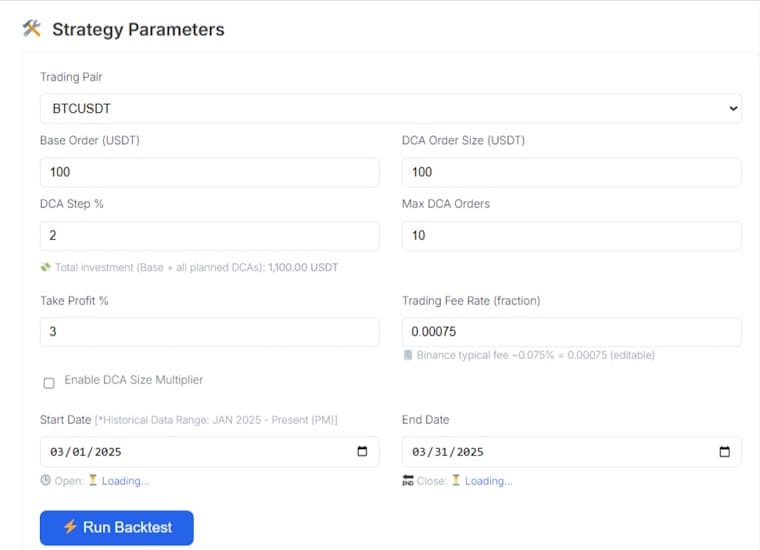 Open the DCA Backtest Bot and the first two fields are Trading Pair and the Start/End Date.