

 Bitcoin
  Ethereum
  Solana
  TRON
TRON  Zcash
Zcash  Hyperliquid
  Dogecoin
  Monero
  Chainlink
  Cardano
  Stellar
  Uniswap
  Sui
Sui  Hedera
  Bittensor
  Shiba Inu
  Ripple USD
  Polkadot
  Aster
Aster  World Liberty Financial
  Render
  Artificial Superintelligence Alliance
Rebalance bots get pitched as some magic profit machine.
They’re not.
Here’s the thing, though, that’s not actually what makes them useful.
Most crypto content shows you a green chart and calls it a day.
We’re not doing that here.
Below are three real rebalance strategy backtest results, run on CryptoGates using actual market data from June through December 2025, and two of them lost money.
That’s not a typo.
But losing less than the market did, while staying automated and stress-free, is the entire point of a rebalance strategy backtest, and that’s what we’re breaking down.

Vanguard's research on portfolio rebalancing discipline.
Look, if you’ve ever wondered whether a rebalance bot actually beats just holding your coins, this is the honest answer with the receipts attached.
- The Problem: Traders assume a rebalance bot should always print green numbers, so one red backtest makes them abandon the whole strategy.
- The Solution: Compare rebalance results against a HODL benchmark, not against zero, to see if the bot is actually doing its job.
- The Incentive: Two of three playbooks below beat their HODL benchmark by double-digit margins even while posting negative ROI overall.
- The Risk: Rebalancing highly correlated volatile pairs can produce a negative edge versus HODL, meaning the bot underperforms simply holding. This is not financial advice. DYOR.
How We Actually Tested These Rebalance Playbooks
Same bot. Same rebalance logic style.
Three completely different pairs.
Seven months of real historical data, June 1 to December 31, 2025, run through the Rebalance Strategy Backtest Bot on CryptoGates.
Ngl, we picked these three on purpose. Not because they all won.
Because together they show you what actually moves the needle in a rebalance strategy: how correlated your two assets are, how tight your rebalance ratio is, and how often the bot checks in.
Proven Setups &
Expert Breakdowns.
We don't just show you the data; we engineer and validate high-performance strategies, providing the "Alpha" behind the numbers.
Each playbook below used the same core mechanic.
Split capital 50/50 between two assets. Set a ratio trigger, meaning the bot rebalances whenever one asset drifts too far from its target weight. Check prices every hour. Sell the winner, buy the laggard, repeat.
Wait, that’s the whole strategy?
Pretty much.
The complexity isn’t in the mechanics. It’s in picking the right pair and the right threshold for the market condition you’re actually in.
What "Rebalancing Edge" Means (and Why It Matters More Than Raw ROI)
Here’s the key idea.
Every result below gets measured two ways: the bot’s own ROI, and something called Rebalancing Edge, which is the bot’s ROI minus what a simple buy-and-hold of the same two assets would have returned.
Research Highlight
A pattern shows up consistently across CryptoGates‘ rebalance testing: when both assets in a pair are falling, the size of the rebalancing edge tends to track how differently the two assets are falling, not whether the portfolio ends up green.
In a separate 41-day test pairing FET and SOL, FET dropped 32% while SOL fell only 10%. The rebalance bot still lost money overall, down 19.17%, but a passive holder of the same pair lost 21.37%.
That’s a 2.20 percentage point edge, produced almost entirely because the bot kept trimming the relatively steadier SOL side and buying the harder-hit FET side lower.
The lesson lines up with what the ENA/BTC and ASTER/SOL results above already suggest: the wider the divergence between two falling assets, the more room a rebalance strategy has to work, even inside an overall losing period.
View Complete Playbook: https://cryptogates.io/playbooks/fet-crashed-32-sol-held-steadier/
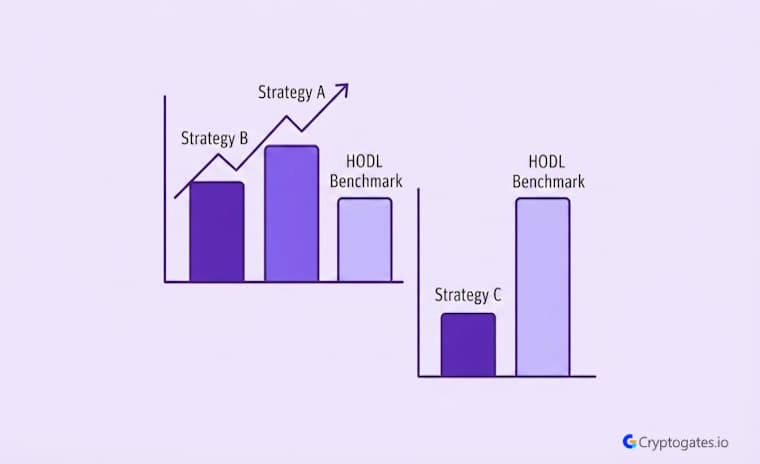
A positive edge means the bot beat HODL.
A negative edge means HODL would’ve done better, and you paid fees for nothing. This single number is the real report card, way more than the headline ROI figure ever could be.
Playbook 1 — SHIB/ETH Stable-Yield Rebalance
⚖️ SHIB/ETH, 3000 USDT, June through December 2025. This one’s a good lesson in what happens when correlation works against you.
Results vs Benchmark
Final ROI came in at negative 19%, a total P&L of negative 569.97 USDT across 22 trades.
The HODL benchmark for the same period landed at negative 14.43%.
Unfortunately, that puts the rebalancing edge at negative 4.57%. The bot underperformed simply holding both coins.
Here’s what actually matters, though.
SHIB and ETH aren’t exactly a natural rebalance pair. SHIB moves in violent, fast bursts while ETH tends to grind.

No. It means the pair or ratio setting wasn't a fit for that market condition. The bot executed exactly as configured. The parameters were the issue, not the tool.
When the bot rebalanced on a tight 2% ratio during choppy sideways action, it kept selling SHIB into short pumps and buying it back higher shortly after.
That’s a classic whipsaw pattern.
Tighter thresholds aren’t automatically better, and this backtest proves it plainly.
Playbook 2 — ASTER/SOL Ecosystem Drift
⚖️ ASTER/SOL, 2000 USDT. This is where the strategy starts proving its worth.
1. Setup and Parameters
50/50 allocation across ASTER and SOL, same 2% ratio trigger, hourly checks, 0.1% fee on Bybit.
Highest trade count of the three playbooks is 59 rebalances over the test window.
2. Results vs Benchmark
ROI landed at negative 46.92%, with a total P&L of negative 938.39 USDT.
Rough number on its own. But here’s the interesting part: the HODL benchmark for ASTER/SOL over the same period was negative 50.25%.
| Playbook | ROI | HODL Benchmark | Rebalancing Edge |
|---|---|---|---|
| SHIB/ETH | -19.00% | -14.43% | -4.57% |
| ASTER/SOL | -46.92% | -50.25% | +3.33% |
| ENA/BTC | -13.30% | -25.52% | +12.22% |
That gives a rebalancing edge of positive 3.33%. The bot lost less money than simply holding would have.
In a market where both assets were bleeding, the rebalance mechanic still did its job, systematically trimming the outperformer and rotating into the laggard, softening the drawdown along the way.
Playbook 3 — ENA/BTC Trend Mitigation
⚖️ ENA/BTC, 2500 USDT. Ser, this is the standout of the three.
1. Setup and Parameters
50/50 split between ENA and BTC, with a slightly looser 5% ratio trigger and hourly checks, 0.08% fee assumption on OKX.
This generated the most activity of any playbook at 103 rebalance events.
2. Results vs Benchmark
ROI finished at negative 13.30%, total P&L negative 332.55 USDT. Still red, sure. But the HODL benchmark here was negative 25.52%, nearly double the bot’s loss.

Larry Fink, BlackRock
That puts the rebalancing edge at positive 12.22%, the strongest of the three playbooks by a wide margin.
Pairing a volatile alt like ENA against BTC gave the bot a clear structural advantage.
The pairing of a high-volatility altcoin against a relatively stable major gave the bot more useful drift to capture. Bigger swings between the two assets meant more meaningful rebalance opportunities.
BTC’s relative stability against ENA’s sharp breakout-then-reversion behavior meant the rebalance mechanic kept skimming profit off ENA’s spikes and parking it in BTC before the pullbacks hit.
That’s the rebalance strategy doing exactly what it’s designed to do.
What These 3 Backtests Actually Prove About Rebalancing
Zoom out for a second.
All three playbooks lost money in absolute terms. That’s the part a hype account would never show you. But two out of three beat their HODL benchmark, one by over 12 points.
That’s the actual story here, not the red numbers on the ROI line.

Zaheer here. People ask me all the time why we show backtests with negative ROI. Because that's the real data, and hiding it would break the entire reason CryptoGates exists. Verify first, risk later, that only works if we show you the losses too.
The simple truth is rebalancing isn’t sold as a way to guarantee green.
It’s sold as a way to lose less when the market’s bleeding and to systematically bank profit when it’s not.
In a seven-month window where most of crypto was correcting, two of these bots did precisely that job.
Real Backtest Example
Another CryptoGates test tells a very similar story, from the opposite direction of the market.
Running a 50/50 SOL/ETH rebalance strategy between October 20 and December 15, 2025, both assets fell hard: SOL dropped nearly 32%, and ETH collapsed 48%. On a 1,000 USDT allocation, the rebalance bot still closed at a loss, down 287 USDT.
But the comparison point is what matters.
A passive 50/50 holder over the same window lost more. The bot’s rebalancing activity – trimming the relatively stronger asset and rotating into the weaker one on each drift trigger – softened the drawdown rather than eliminating it.
It’s the same pattern seen across the SHIB/ETH, ASTER/SOL, and ENA/BTC tests above: a red ROI line isn’t proof the mechanic failed, it’s proof the benchmark needs to be HODL, not zero.
View Complete Playbook: https://cryptogates.io/playbooks/sol-crashed-32-eth-crashed-48-did-rebalancing-help/
When Rebalancing Edge Turns Negative
Now let’s look at the flip side.
SHIB/ETH is the case study in what not to expect from this strategy.
Highly correlated, high-volatility pairs with tight rebalance thresholds can get chopped up by the bot’s own trading activity.
Every rebalance trigger has a fee attached, and if the pair whipsaws often enough, those fees and the buy-high-sell-low pattern from short-term noise start eating into what should’ve been a stabilizing mechanic.
Interactive Rebalance Strategy Checklist
- Check correlation between your two assets before setting a tight ratio trigger
- Widen the rebalance threshold for highly volatile or meme-driven pairs
- Compare bot ROI against a HODL benchmark, never against zero
- Run the same pair across multiple timeframes before trusting one result
- Factor exchange fees into your expected edge, not just raw price movement
This is where things change if you’re picking your own pair.
A wider ratio trigger, like the 5% used in the ENA/BTC playbook versus the 2% used for SHIB/ETH, gives the bot room to breathe and avoids reacting to every minor fluctuation.
Test Your Own Pair Before You Trust Any Playbook
Three playbooks, three different outcomes, one consistent lesson.
Rebalancing edge matters more than raw ROI, and the pair you choose plus the ratio you set decides whether that edge lands positive or negative.
Nobody, including us, can promise which side of that line your own setup will land on.
Confused about
market outlook?
Trading without a plan is just gambling. Our strategy architect analyzes your risk tolerance and capital to match you with a proven algorithmic framework.
That’s kind of the whole point of testing before deploying.
Run your own parameters and see what the data shows before you put real capital behind any of this.
FAQs
Does a negative ROI mean a rebalance strategy failed?
Not on its own. Check the ROI against a HODL benchmark for the same pair and period. A smaller loss than HODL still counts as the bot doing its job.
What's a good rebalancing edge to look for?
Any positive number means the bot outperformed holding. Double digit edges, like the 12.22% seen in the ENA/BTC playbook, are strong results worth studying further.
How often should a rebalance bot check prices?
It depends on the pair’s volatility. Hourly checks worked across all three playbooks here, but tighter or wider intervals can change results significantly depending on the asset.