

 Bitcoin
  Ethereum
  Solana
  TRON
TRON  Zcash
Zcash  Hyperliquid
  Dogecoin
  Monero
  Chainlink
  Cardano
  Stellar
  Uniswap
  Sui
Sui  Hedera
  Bittensor
  Shiba Inu
  Ripple USD
  Polkadot
  Aster
Aster  World Liberty Financial
  Render
  Artificial Superintelligence Alliance
XRP pushes above a key resistance level.
Volume spikes.
Every signal says breakout. Then, within an hour, the price is back below that level, and everyone who bought the move is underwater.
This XRP fake breakout strategy scenario plays out often enough that it’s basically a pattern of its own.

Here’s the thing.
Fake breakouts aren’t random bad luck. They’re specific market behaviors, and once you understand why they happen, they get a lot easier to filter out, something we confirmed when we ran a full XRP fake breakout backtest.
That’s not a small number. It means chasing every breakout is closer to a coin flip than a strategy.
- The Problem: XRP frequently breaks resistance levels that look confirmed, then reverses fast, trapping traders who entered on the initial move.
- The Solution: Understand what actually separates a real breakout from a fake one before entering, not after getting stopped out.
- The Incentive: Filtering for confirmation reduces how often you get caught on the wrong side of a reversal.
- The Risk: No filter catches every fake breakout. Even solid confirmation rules will get faked out occasionally. That's part of trading this pattern, not a flaw in the method.
What a Fake Breakout Actually Looks Like on XRP
Price approaches a resistance level everyone’s watching.
It pushes through, sometimes with a strong candle and a convincing volume spike.
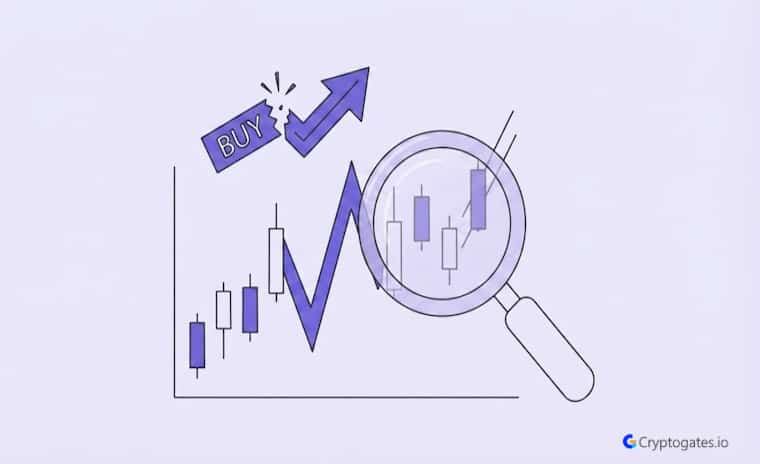
Then, instead of continuing, it stalls and reverses back below that same level within a few candles, the textbook shape of a false breakout. Anyone who bought the breakout is now holding a losing position almost immediately.
Confused about
market outlook?
Trading without a plan is just gambling. Our strategy architect analyzes your risk tolerance and capital to match you with a proven algorithmic framework.
Look, this isn’t unique to XRP, but XRP shows this pattern often enough that it’s worth studying closely. The push above resistance looked real in the moment. It just didn’t have anything backing it up.
Why XRP Is Prone to This Pattern
A few things stack up here.
XRP often trades in zones with thinner liquidity compared to BTC or ETH, which means a smaller amount of volume can push price through a level without real conviction behind it.
News headlines and retail-heavy participation add another layer, since sudden spikes in attention can trigger short bursts of buying that fade fast.
Lai Yuen, Investment Analyst, Fisher8 Capital
Research Insight
Why XRP’s Range-Bound Zones Create the Perfect Setup for Fake Breakouts
In a separate proprietary backtest, CryptoGates ran a grid bot on XRP during a 90-day window where price opened at $2.08 and closed at $2.09 – a near-perfect flatline.
Despite the lack of net movement, the bot still triggered 875 trades inside that range, confirming that XRP spends extended periods oscillating tightly around key levels rather than trending cleanly through them.
This repeated back-and-forth inside a narrow band is exactly the kind of environment where a single push above resistance can look like a breakout but is really just another swing inside the same range.
The data suggests that in XRP’s case, “breaking” a level and “holding” a level are two very different events, which lines up directly with why confirmation matters more than the initial move.
Playbook Link: https://cryptogates.io/playbooks/xrp-grid-bot-returned-27-74-in-90-days-while-buy-hold-made-0-24/
Honestly, this combination makes XRP a common case study for exactly this kind of trap.
It’s not that XRP is uniquely broken. It’s just more exposed to this specific pattern.
What Happens to a Strategy Caught in a Fake Breakout
A strategy built around breakout entries usually triggers when the price closes above a resistance level.
That’s the simple version.
The problem is that a single close above a level doesn’t tell you whether buyers actually have control, or whether the move was a quick spike that’s about to snap back.

Zaheer's view on this is straightforward. A breakout isn't confirmed by price alone. It's confirmed by price holding, and holding takes more than one candle to prove.
1. Where a Tested Strategy Avoids the Trap
Strategies that require confirmation, like waiting for a retest of the broken level, or a minimum volume threshold, or holding above the level for a set number of candles, avoid a large share of fake breakouts.
They’re not trying to catch the exact top of the move.
They’re trying to avoid the trap.

No, some fake breakouts pass even solid confirmation checks. The goal is reducing how often you get caught, not eliminating the risk entirely.
2. Where It Still Gets Caught
But there’s a problem worth being honest about.
Even confirmation rules don’t catch everything. Wait, that’s actually an important point.
Some fake breakouts are convincing enough to pass a retest and still fail afterward. No filter is perfect, and pretending otherwise sets up bad expectations.
The Real Lesson From Watching This Play Out
Here’s what stands out once you look at enough of these.
The traders who get hurt most usually aren’t wrong about the direction.
They’re just early, entering on the initial spike instead of waiting for confirmation that the move actually has support behind it, the same setup behind one single day where 335,000 traders got forcibly liquidated after betting the same direction as everyone else.
The simple truth is that fake breakouts punish speed more than they punish bad analysis.
Someone who correctly identifies XRP is about to move, but enters too fast, ends up in the same losing position as someone who read the setup completely wrong.
Real Backtest Example
Strategy: Rebalance Bot
Coin: XRP
Market Condition: Strong, sustained directional move (+27% over 51 days)
Objective: Capture and lock in genuine trend continuation vs. a temporary spike
Key Result: When XRP’s move was real and sustained rather than a quick spike, a rebalance strategy captured $184.24 in profit across 22 swaps, outperforming passive holding by 1.64 percentage points.
Expert Interpretation: The contrast is instructive – this was a case of price actually holding above prior levels for weeks, not just one strong candle. It shows what a “real” move looks like structurally compared to the fast reversals described earlier in this article: sustained follow-through over time, not a single close.
Playbook Link: https://cryptogates.io/playbooks/xrp-exploded-27-in-51-days/
What This Means for Manual Breakout Traders
If you’re trading XRP breakouts manually, the instinct to jump in immediately when price crosses a level is probably costing you more than it’s earning.
Waiting for confirmation feels like missing the move. Ngl, it usually just means missing the fake ones.
How to Filter Out Fake Breakouts Before Entering a Trade
You can’t predict which breakout will hold and which will fail.
What you can do is build a filter that reduces exposure to the ones most likely to reverse.
1. What to Verify Before Trusting a Breakout
Pre-Trade Strategy Audit
- Check if volume actually spiked, not just price
- Wait for a retest of the broken level before entering
- Confirm the breakout holds across a few candles, not just one
- Check higher timeframe structure for alignment
- Avoid entering during major news spikes without confirmation
Running this kind of filter through the Strategy Engine shows how a breakout entry rule would’ve performed across past XRP price action, instead of relying on how convincing a single candle looks in the moment.
2. Why do fake breakouts happen so often on lower timeframes?
Lower timeframes react to smaller volume spikes, which makes it easier for a short burst of buying to push price through a level without real conviction behind the move.
The Bottom Line on Trading Breakouts Like XRP's
Fake breakouts aren’t a prediction problem.
They’re a filtering problem. You’re not trying to guess whether XRP breaks out correctly every time.
You’re trying to avoid entering the moves most likely to snap back before they even confirm.
Battle-Test Your Strategy
Before the Market Does.
Eliminate guesswork with institutional-grade backtesting for DCA, Grid, and Rebalance bots. Real historical data. Real-world results.
Verify first, risk later applies directly here.
Before trusting the next breakout that looks convincing, it’s worth checking how similar setups played out historically, like this XRP grid bot playbook from a 90-day sideways stretch, instead of reacting to how strong the candle looks in the moment.
FAQs
What is a fake breakout in crypto trading?
It’s when price pushes past a resistance or support level but fails to hold, reversing back shortly after. Traders who entered on the initial move end up trapped on the wrong side.
Why is XRP known for fake breakouts?
XRP often trades in thinner liquidity zones and sees sudden attention spikes from news and retail activity. Both can push price through a level without real buying conviction behind it.
How do you confirm a breakout before entering a trade?
Check for a volume spike, wait for a retest of the broken level, and see if price holds for a few candles instead of just one. Higher timeframe alignment adds another layer of confirmation.