Bitcoin
 Ethereum
 Solana
 TRON
 Zcash
 Hyperliquid
 Dogecoin
 Monero
 Chainlink
 Cardano
 Stellar
 Uniswap
 Sui
 Hedera
 Shiba Inu
 Bittensor
 Ripple USD
 Aster
 Polkadot
 World Liberty Financial
 Render
 Artificial Superintelligence Alliance

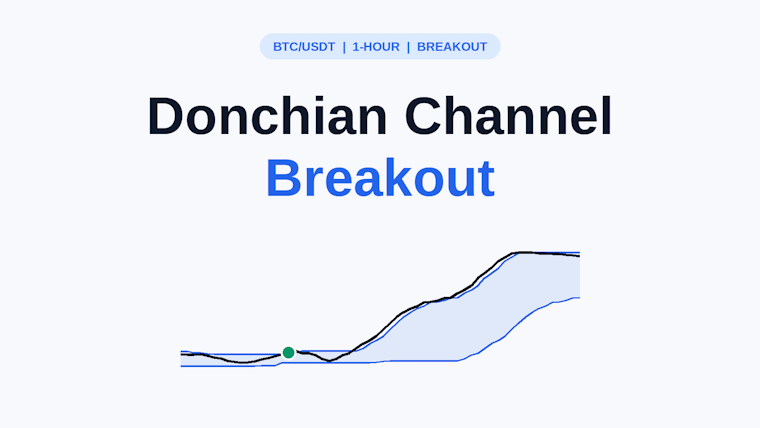
A trend-following breakout system for BTC/USDT on the 1-hour chart, based on the Donchian Channel. This post explains the rules, how the setting was chosen, and what the reported tests do and do not tell us.
THE IDEA
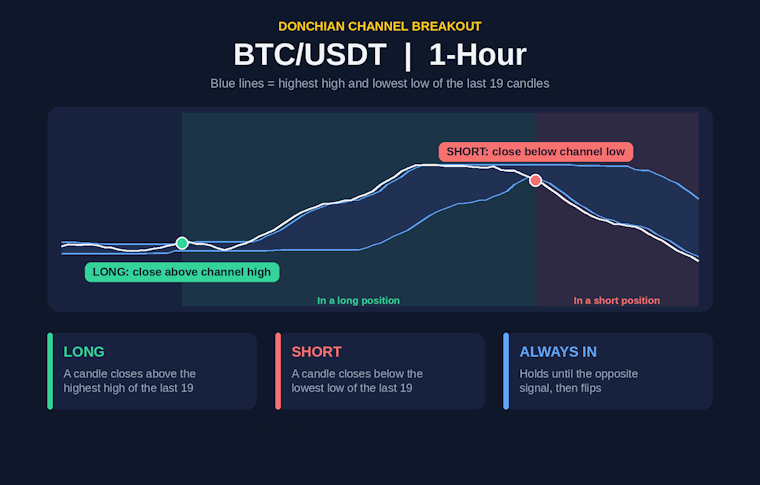
A Donchian Channel draws two lines: the highest high and the lowest low of the last N candles. When price closes outside the channel, it is breaking out of its recent range. The strategy follows that move: it buys upward breakouts and sells (shorts) downward breakouts.
THE RULES
Pair: BTC/USDT
Timeframe: 1 hour
Lookback (N): 19 candles (19 hours)
Long: a candle closes above the highest high of the last 19 candles.
Short: a candle closes below the lowest low of the last 19 candles.
Position: always in the market. It stays long or short until the opposite signal appears, then it flips.
Note: shorting needs a Futures market.
HOW THE 19-HOUR SETTING WAS CHOSEN
The lookback was picked by grid search. Many lookback values were tested on hourly BTC data from 2016 to 2019 (the in-sample period), and 19 gave the best result. Profit factor in-sample: 1.08. (Profit factor = total profit divided by total loss. Above 1.0 means the system made more than it lost.)
TEST 1: MONTE CARLO PERMUTATION TEST
Picking the best setting from many options can fool you, because some settings look good by pure luck. To check this, the price data was shuffled 1,000 times, which destroys real patterns and leaves only noise. The same optimization was then run on each shuffled copy. Reported result: the real data's profit factor of 1.08 beat almost all of the shuffled results (p-value 0.3%). In simple words, a result like this would be unlikely to come from noise alone.
TEST 2: WALK-FORWARD TEST
The system was then run on 2020 data it had never seen, re-optimizing every 30 days. Reported profit factor: 1.04. So it stayed slightly profitable on new data.
HOW TO READ THESE RESULTS HONESTLY
– A profit factor of 1.04 to 1.08 is a small edge. Trading fees and slippage can reduce it a lot, especially on a 1-hour system that flips often.
– The walk-forward test covers one year only (2020), which was a strong trending year for BTC. It may not repeat.
– The shuffle test lowers the chance of a lucky result, but it does not guarantee future profit.
– Past results do not guarantee future results.
WHEN IT MAY WORK
Clear trending markets, where price keeps breaking out in one direction.
WHEN IT MAY STRUGGLE
Sideways, choppy markets. Price breaks the channel, falls back, and the system flips again and again, losing a small amount each time (called whipsaws).
TRY IT YOURSELF
Open CG Backtest and test a Donchian breakout on BTC/USDT 1h with a 19-candle lookback. Turn fees on. Then try nearby values (for example 15 to 25) and other periods. If the result changes a lot with small changes, the edge is fragile.
SOURCE
The test setup and numbers come from [ADD SOURCE NAME AND LINK HERE]. I did not run these tests myself.
RISK
This is not financial advice. Futures trading and shorting are risky, and a system that is always in the market can lose money for long periods. Only use money you can afford to lose.