🌐 Explore, share, learn & grow.

🧭 Confused about market outlook?

  • bitcoinBitcoin (BTC) $ 76,765.00 2.45%
  • ethereumEthereum (ETH) $ 2,238.91 0.82%
  • solanaSolana (SOL) $ 95.39 1.6%
  • tronTRON (TRX) $ 0.330166 7.11%
  • hyperliquidHyperliquid (HYPE) $ 88.97 3.61%
  • zcashZcash (ZEC) $ 1,234.55 0.99%
  • dogecoinDogecoin (DOGE) $ 0.075326 0.75%
  • moneroMonero (XMR) $ 589.72 3.97%
  • chainlinkChainlink (LINK) $ 11.28 3.3%
  • cardanoCardano (ADA) $ 0.193933 1.59%
  • stellarStellar (XLM) $ 0.168695 3.34%
  • uniswapUniswap (UNI) $ 6.98 11.18%
  • suiSui (SUI) $ 0.895547 1.93%
  • hedera-hashgraphHedera (HBAR) $ 0.071962 3.48%
  • shiba-inuShiba Inu (SHIB) $ 0.000005 2.5%
  • bittensorBittensor (TAO) $ 235.44 0.12%
  • ripple-usdRipple USD (RLUSD) $ 1.00 0.08%
  • aster-2Aster (ASTER) $ 0.681140 1.21%
  • polkadotPolkadot (DOT) $ 0.973307 5.74%
  • world-liberty-financialWorld Liberty Financial (WLFI) $ 0.050007 1.87%
  • render-tokenRender (RENDER) $ 1.57 0.94%
  • fetch-aiArtificial Superintelligence Alliance (FET) $ 0.166737 1.28%
Mean Reversion Strategy
BTC / USDT, ETH / USDT Spot & Futures Short Term

Bollinger Bands + RSI Strategy: Mean Reversion Setup

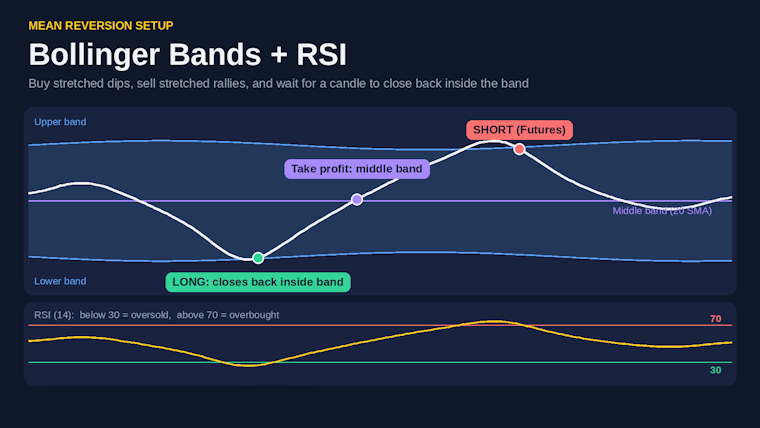
Buy near the lower Bollinger Band when RSI is oversold, sell near the upper band when RSI is overbought. Wait for a candle confirmation.

STRATEGY CONTRIBUTOR

Strategy shared by

Eshal
Eshal
@eshalsajid
View Profile
STRATEGY OVERVIEW

Strategy Snapshot

The key details of this trading strategy at a glance.

Strategy Type
Mean Reversion
Assets
BTC / USDT, ETH / USDT
Market
Spot & Futures
Time Horizon
Short Term
Risk Profile
Moderate
Trading Frequency
Several Times a Week
THE GAME PLAN

Strategy Rules

The core rules that define how this strategy works.

INDICATORS
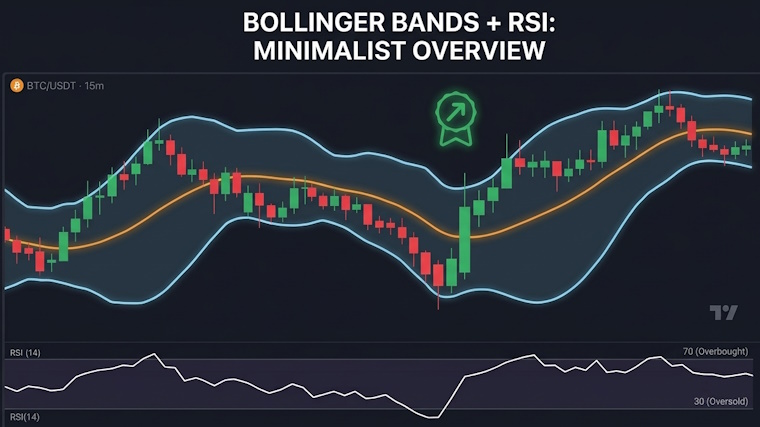
Bollinger Bands: period 20, standard deviation 2.
RSI: period 14, levels 30 and 70.

LONG ENTRY
- Price touches or slightly pierces the lower band.
- RSI is below 30.
- Wait for a candle to close back inside the band, then enter.

SHORT ENTRY (Futures)
- Price touches or slightly pierces the upper band.
- RSI is above 70.
- Wait for a candle to close back inside the band, then enter.

EXIT
- Stop loss: just beyond the recent swing low (Long) or swing high (Short).
- Take profit: middle band (20 SMA). Optional: take half there and aim for the opposite band with the rest.

AVOID: strong trends where price keeps riding the outer band.

No backtest results included. Not financial advice.

INSIDE THE STRATEGY

Strategy Details

Explore the complete strategy, including its approach, entry and exit rules, and risk management.

A simple mean reversion setup that uses two common indicators: Bollinger Bands to spot stretched price, and RSI to confirm that momentum is overbought or oversold. The idea is that price often returns toward its average after a stretch.

STEP 1: SET UP THE CHART
Open a chart (for example on TradingView) and add:
1. Bollinger Bands: length 20, standard deviation 2.
2. RSI: length 14, with levels at 30 (oversold) and 70 (overbought).

STEP 2: LONG (BUY) SETUP
– Price touches or slightly pierces the lower Bollinger Band.
– RSI is below 30.
– Do not enter on the touch alone. Wait for a candle to close back inside the lower band, then enter Long.

STEP 3: SHORT (SELL) SETUP, FUTURES ONLY
– Price touches or slightly pierces the upper Bollinger Band.
– RSI is above 70.
– Wait for a candle to close back inside the upper band, then enter Short.

STEP 4: EXIT AND STOP LOSS
– Stop loss: just beyond the recent swing low (Long) or swing high (Short), so normal noise does not stop you out.
– Take profit: the middle Bollinger Band (20 SMA).
– Optional: take half of the position at the middle band and aim for the opposite outer band with the rest.

WHEN IT WORKS BEST
Ranging markets, or markets with moderate moves where price keeps returning to its average.

WHEN TO AVOID IT
– Strong trends where price rides along the outer band without pulling back. The RSI can stay overbought or oversold for a long time.
– High-impact news, when indicators can give false signals.
– When you cannot place a clear stop loss.

HOW TO PRACTICE
Before using real money, go back on the chart, mark past signals that follow these exact rules, and note how many reached the middle band and how many hit the stop.

RISK
No backtest results are included in this post, so please test it before using real funds. Shorting and leverage on futures are risky. Always use a stop loss and a small position size. This is not financial advice. Only use money you can afford to lose.
WATCH & LEARN

Strategy Video

Watch the creator explain this strategy in more detail.

A NOTE FROM THE CREATOR

Creator's Note

Sharing this Bollinger Bands + RSI setup for learning and discussion. It tends to suit ranging or moderate markets and is weak in strong trends. The main rules: wait for a candle to close back inside the band, always use a stop loss, and test on past charts first. No backtest results are included.

See something misleading or inappropriate? Report this Strategy
Found this strategy useful? Share it with others or contribute your own.
Share Your Strategy
PUT YOUR STRATEGY TO THE TEST

Ready to Test This Strategy?

Don't rely on assumptions. Backtest your strategy against historical market data and see how it performs.

Backtest This Strategy