Bitcoin
  Ethereum
  Solana
  TRON
TRON  Hyperliquid
  Dogecoin
  Zcash
Zcash  Cardano
  Stellar
  Hedera
  Sui
Sui  Shiba Inu
  Bittensor
  World Liberty Financial
  Aster
Aster  Ripple USD
  Polkadot
  Render
  Artificial Superintelligence Alliance
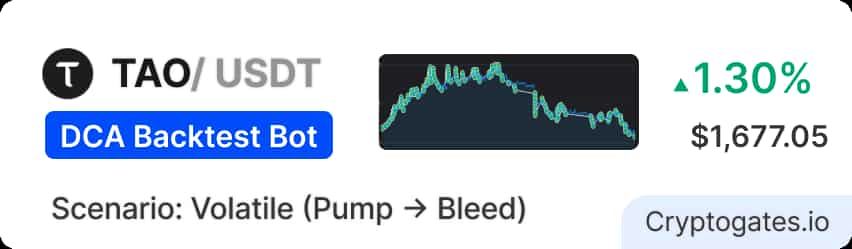
ETH Fell Off a Cliff — and Kept Falling.
ETH opened October 10, 2025, at $4,367.22 — the tail end of a quarterly surge that had pushed sentiment to fever-pitch levels.
By November 25, it closed at $2,959.36. That’s a −$1,407.86 drop. −32.25% in 46 days.
For a spot holder who bought at the open with $1,100, that meant watching $354.61 evaporate — with no bottom in sight and no TP trigger to exit cleanly.
This wasn’t a crash. It was a slow grind lower — lower highs, lower lows, occasional bounces that got sold into immediately. The textbook definition of a post-pump distribution phase.
The question we wanted to answer:
Can a 2% step DCA bot find enough small bounces in a structurally declining market to avoid getting destroyed — or does it just average down into a deepening hole?
We ran this backtest across the full 46-day window using real Binance 1-minute OHLCV data to find out.
Strategy Parameters
How Each Setting Impacted Performance?
Parameter Impact Summary
| Parameter | Impact | The Logic (Why) |
|---|---|---|
| Small Base Order | Limited initial exposure | Low first-entry risk |
| Equal DCA Size | Stable averaging | Linear cost reduction |
| 2% DCA Step | Frequent trigger fires | Captures local bounces |
| 10 DCA Orders | Deep drawdown buffer | Survives multi-leg drops |
| 3% Take Profit | Consistent cycle exits | Enough margin to profit |
56 Orders. 14 Sessions Closed. −$101.49 Net. Here's What That Really Means.
The Math That Matters
💰 The Real Loss Rate:
On your base capital of $1,100, this strategy returned −$101.49 — an effective capital loss of −9.22% over 46 days. That works out to roughly −$66 per month on an annualized basis, or approximately −72% annualized on the base capital deployed. In a −32% market, that’s a meaningful layer of protection — but it’s still a loss, and readers should understand that.
⚡ Where the Bot Actually Helped:
14 of 15 sessions closed via Take Profit — meaning the bot successfully found a 3% bounce in almost every cycle, even during a sustained downtrend. The problem wasn’t the session win rate. The problem was that each new session opened at a progressively lower price, and the cumulative realized losses from sessions that averaged down into deep dips outpaced the profits from shorter, shallower sessions.
🛡️ Fee Reality Check: $4.20 in total fees across 56 orders is negligible — roughly $0.075 per order. Fee drag here is not the story. The 0.00075 rate kept friction nearly invisible. At this fee level, fees represent about 4% additional drag on the realized loss — meaningful but not decisive. The market direction was the decisive factor.
| Variant | DCA Step | TP % | Sessions | Orders | P&L USDT |
|---|---|---|---|---|---|
| A | 1% | 3% | 12 | 75 | −$96.41 |
| B | 2% | 2% | 21 | 65 | −$139.02 |
| CThis Playbook | 2% | 3% | 14 | 56 | −$101.49 |
Variant Explanation:
Strategy C — 2% step, 3% TP — is this playbook?
It ran 14 sessions, executed 56 orders, and realized a loss of –$101.49.
Strategy A (1% step, 3% TP) produced the smallest loss of the three at −$96.41 — but fired 75 orders across only 12 sessions, meaning more capital was deployed more aggressively per session. In a bear market, that heavier averaging helped slightly, but at the cost of deeper per-session exposure.
Strategy B (2% step, 2% TP) was the worst performer at −$139.02. The tighter 2% TP sounds safer, but in a −32% market, it meant the bot was exiting cycles with paper-thin margins — not enough to offset the losses from sessions that averaged deep into the drop. More sessions (21) with less profit per close is a losing equation in sustained bearish conditions.
Strategy C strikes the best balance: the 2% step spaces out, averaging orders enough to avoid over-deploying in shallow dips, and the 3% TP gives each session enough room to close with a meaningful profit when bounces occur. It’s not the least-loss variant — but it’s the most mechanically sound and the safest to operate across different market conditions.
What the results are really telling you.
✅ what worked
The 3% TP target worked because ETH, even in a downtrend, consistently produced 2–4% intraday bounces before resuming lower. 14 of 15 sessions closed via TP hit — a 93% session close rate in a market that dropped 32%.
Sessions 2 through 9 (visible in the log) all closed via TP with P&Ls ranging from $2.85 to $14.24, each deploying between $100.08 and $500.38.
⚠️What didn't work
Session 1 is the red flag. It deployed 11 orders totaling $1,100.83 — the full capital stack — before closing. When the bot fires all 10 DCA orders in a single session, it has exhausted its averaging capacity.
In a 32% downtrend, opening a session near $4,367 and averaging all the way down means the average cost basis remains well above any realistic 3% recovery target. That one session likely absorbed a significant portion of the total −$101.49 loss.
💡 The key insight
DCA bots don’t stop a downtrend. They negotiate with it.
This backtest ran 46 days through a −32% collapse. It still closed 14 of 15 sessions at a profit — because in every downtrend, even brutal ones, there are bounces. The bot’s job is to catch those bounces systematically, without requiring you to predict when they happen.
The deeper lesson: in a bear market, session-level win rate is almost irrelevant. What matters is the entry price of each new session. If the bot keeps opening sessions at progressively lower prices, each successive TP hit is closing at a lower absolute price than the previous loss. The cumulative effect is a slow, managed bleed — not a wipeout.
The optimal use of this setup in a bear market is capital preservation, not profit generation. It performed exactly as designed.
🚩 Watch out for - a potential red flag
The 88.06% max drawdown is the number that will alarm new users — and they’re right to look at it closely. This figure means that at the deepest point of an open session, the unrealized loss on capital deployed in that session reached 88% of the session investment. That is not your total account loss — it is the peak paper loss on a single session’s deployed capital before TP was hit or the session closed.
In a −32% market, this is structurally expected. The bot averaged down across 10 orders in early sessions, pushing the unrealized loss deep before finding a bounce. If you do not have the full $1,100 USDT liquid and available, you cannot fund all 10 DCA orders — and an unfunded order means the bot cannot average down, which means the session can never reach its TP target.
Always ensure your full $1,100 USDT is liquid, uncommitted, and available before running this setup. In a bear market, the bot will use every dollar.
🧭 When This Strategy Works Best
Ideal Conditions:
✔ Sideways / consolidating markets with frequent small oscillations
✔ Post-peak distribution phases with 2–5% daily bounces
✔ Mildly bearish markets where price grinds lower but doesn’t free-fall
✔ Markets with recurring 3–6% intraday swings that trigger TP before the next leg down
🚫 When NOT To Use This Strategy
Avoid when:
❌ ETH is in a confirmed, accelerating crash with no intraday bounces (flash crash conditions)
❌ Volatility collapses — flat markets where 2% moves don’t occur for days
❌ You cannot keep the full $1,100 USDT liquid and available throughout the session
❌ Your risk tolerance cannot handle watching a position sit at −88% unrealized before TP fires
📊 Expert Rating
Profitability: ⭐⭐☆☆☆
Risk Control: ⭐⭐⭐☆☆
Capital Efficiency: ⭐⭐⭐⭐☆
Beginner Friendly: ⭐⭐☆☆☆
Market Adaptability: ⭐⭐⭐☆☆
🏆 Overall Score
5.8 / 10 — Damage Control DCA: Managed the Bleed, Didn’t Stop It
✔ Quick Takeaways
✔ ETH dropped 32.25% in 46 days — the bot lost only 1.81%. That $253 gap vs. buy-and-hold is real, measurable protection.
✔ 14 of 15 sessions closed via Take Profit — a 93% session close rate in a crashing market. The bot found bounces that spot holders never captured.
✔ Session 1 is the most important session to study: 11 orders, $1,100.83 deployed, full capital stack used. That’s the risk profile of this setup in worst-case conditions.
✔ The 88.06% max drawdown is session-level, not account-level. It means one open position hit −88% before recovering to TP. Your full account was not down 88%.
✔ $4.20 in fees across 56 orders is negligible. At a 0.00075 rate, fee friction is not a factor in this strategy’s performance.
✔ Strategy A (1% step) technically lost less (−$96.41 vs −$101.49) — but deployed more orders (75 vs 56) and ran fewer sessions. The capital efficiency trade-off deserves thought before choosing between them.
What did spot buy & hold actually return?
DCA Bot vs Spot Buy & Hold
The opportunity cost of not running the DCA bot in this period: $253.12. That’s the difference between losing $101 and losing $354 — in a market that gave you no good choices. The bot didn’t profit. But it extracted $253 of protection from a 32% collapse that wiped out a third of every spot holder’s position.
In a bear market, the goal shifts. It’s not “how much did I make?” It’s “how much less did I lose than the market?” This bot answered that question well.
Before you run this playbook, check these off.
Use this as your go/no-go checklist before deploying this exact parameter set.
🧠 Market Suitability Matrix
| Market Condition | Rating | Strategic Notes |
|---|---|---|
| Sideways / Consolidating | ★★★★★ Excellent | Frequent triggers, consistent exits |
| High Volatility | ★★★★★ Excellent | Deep entries, fast recoveries |
| Mildly Bearish / Slow Bleed | ★★★★☆ Good | Longer cycles, higher drawdown |
| Mildly Bullish / Slow Climb | ★★★☆☆ Moderate | Fewer DCA triggers; base orders hit TP alone — reduced capital use |
| Strong Bull Run | ★★☆☆☆ Risky | Price surges past base order without triggering DCA; high opportunity cost vs. holding |
| Strong Bear / Crash | ★☆☆☆☆ Poor | All 10 orders deploy without TP ever firing; capital locks up with no exit |
| Very Low Volatility | ★☆☆☆☆ Poor | 2% DCA step never triggers; capital sits idle earning nothing |
How to tune this playbook for different scenarios.
Disclaimer: All data sourced from CryptoGates DCA Backtest Bot. Results are historical simulations using Binance 1-minute OHLCV data. Past backtest performance does not guarantee future live trading results. DYOR.
Battle-Test Your Strategy
Before the Market Does.
Eliminate guesswork with institutional-grade backtesting for DCA, Grid, and Rebalance bots. Real historical data. Real-world results.