🌐 Explore, share, learn & grow.

🧭 Confused about market outlook?

  • bitcoinBitcoin (BTC) $ 76,859.00 2.6%
  • ethereumEthereum (ETH) $ 2,239.56 0.86%
  • solanaSolana (SOL) $ 95.32 0.96%
  • tronTRON (TRX) $ 0.330517 0.14%
  • hyperliquidHyperliquid (HYPE) $ 90.10 2.62%
  • zcashZcash (ZEC) $ 1,240.14 0.74%
  • dogecoinDogecoin (DOGE) $ 0.075519 0.04%
  • moneroMonero (XMR) $ 596.38 3.68%
  • chainlinkChainlink (LINK) $ 11.20 1.33%
  • cardanoCardano (ADA) $ 0.193819 1.26%
  • stellarStellar (XLM) $ 0.168097 3.51%
  • uniswapUniswap (UNI) $ 6.96 4.58%
  • suiSui (SUI) $ 0.892493 1.62%
  • hedera-hashgraphHedera (HBAR) $ 0.072031 3.75%
  • shiba-inuShiba Inu (SHIB) $ 0.000005 1.29%
  • bittensorBittensor (TAO) $ 234.57 1.9%
  • ripple-usdRipple USD (RLUSD) $ 1.00 0.04%
  • aster-2Aster (ASTER) $ 0.684444 0.5%
  • polkadotPolkadot (DOT) $ 0.974308 6%
  • world-liberty-financialWorld Liberty Financial (WLFI) $ 0.050079 2.33%
  • render-tokenRender (RENDER) $ 1.55 0.91%
  • fetch-aiArtificial Superintelligence Alliance (FET) $ 0.166011 0.09%
DCA Strategy
BTC / USDT Spot Long Term

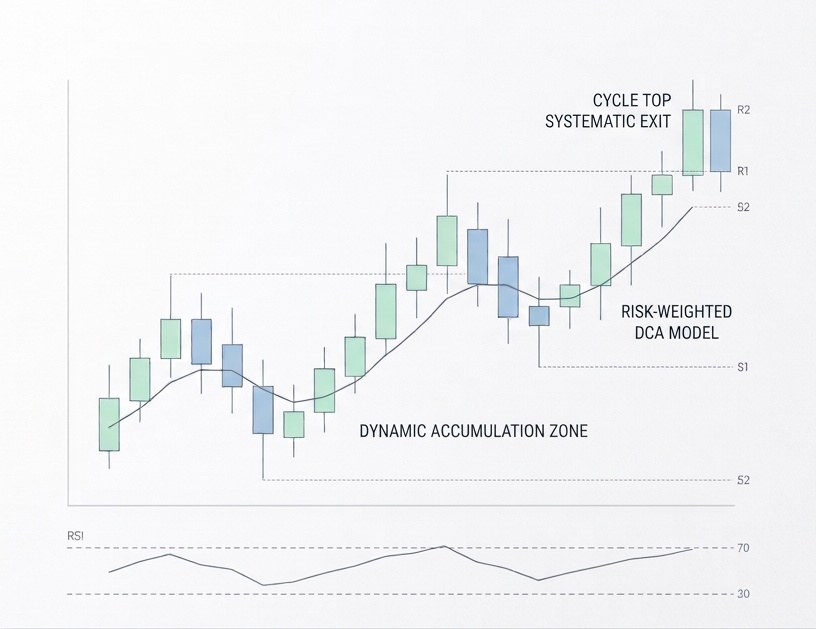
Risk-Based Dynamic DCA: Buy More When BTC Risk Is Low (Cowen Method)

Weekly BTC buys that scale up when a 0-to-1 risk score is low. Based on Benjamin Cowen's Into The Cryptoverse video, with credit.

REPORTED ROI +111.00%
Creator-reported performance
STRATEGY CONTRIBUTOR

Strategy shared by

Noah Crypto
Noah Crypto
@noah-crypto
View Profile
STRATEGY OVERVIEW

Strategy Snapshot

The key details of this trading strategy at a glance.

Strategy Type
DCA
Assets
BTC / USDT
Market
Spot
Time Horizon
Long Term
Risk Profile
Moderate
Trading Frequency
Weekly
THE GAME PLAN

Strategy Rules

The core rules that define how this strategy works.

BASE: buy BTC every week with a fixed base amount (x).
RISK SCORE: Benjamin Cowen's Bitcoin Risk metric (0 = low risk, 1 = high risk). His formula is not public, so read the value from his Into The Cryptoverse charts.

BUY SIZE BY RISK (example used in the video's simulation)
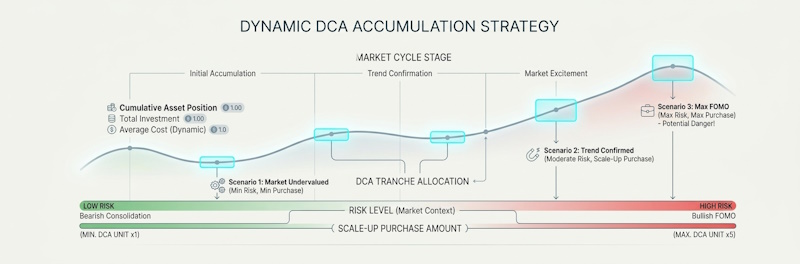
- Risk 0.2 to 0.3: buy 1x
- Risk 0.1 to 0.2: buy 2x
- Risk 0 to 0.1: buy 3x
- Risk above 0.3: no buy, keep the cash
Another slide in the video marks risk above 0.5 as the area to sell or slow down.

TIMING: Monday came out best in the video's chart (UTC close), but the gap is small.

HISTORY: the video's example (Nov 2014 to Jun 2026) bought in 128 of 604 weeks. It is hindsight, not a promise.

Credit: Benjamin Cowen / Into The Cryptoverse. Not financial advice.

INSIDE THE STRATEGY

Strategy Details

Explore the complete strategy, including its approach, entry and exit rules, and risk management.

Most DCA buys the same amount every week. Risk-based DCA changes the amount: buy more when risk is low, and buy nothing (or less) when risk is high. This post explains the idea from Benjamin Cowen's video "Bitcoin Dynamic DCA: How I Navigate Crypto" (Into The Cryptoverse). The method is his. This is my summary of it.

THE RISK SCORE
Cowen's Bitcoin Risk metric is a number from 0 to 1. Low risk means an area that may be attractive for buying. High risk means an area that may be attractive for selling. According to his own description, it is not a tool to predict exact tops or bottoms, and the formula is not published, so it cannot be recreated exactly.

HOW THE BUYING WORKS (example from the video)
Pick a base amount (x) and buy every week, but only when risk is low:
– Risk 0.2 to 0.3: buy x (for example $100)
– Risk 0.1 to 0.2: buy 2x ($200)
– Risk 0 to 0.1: buy 3x ($300)
– Risk above 0.3: skip the buy and keep the cash
So you buy the most when the market looks cheapest by this score.

WHICH DAY
In the video's "best day to DCA" chart, Monday had the lowest average price compared with its 7-day average (UTC close). The difference between days was small, so treat it as a small edge at most.

WHAT THE VIDEO'S EXAMPLE SHOWED
The video ran this on Cowen's simulator from Nov 13, 2014 to Jun 11, 2026 with $100 as the base amount. It bought in 128 of 604 weeks, invested $18,300 in total, and held 32.7 BTC at an average price of about $559. This is a hindsight simulation. Bitcoin was very cheap in the early years, so a result like this is very hard to repeat. It is not a promise for the future.

WHERE BTC IS NOW (TradingView weekly chart)
BTC is around $81,600, about 35% below its all-time high of roughly $126,000. The video showed a risk reading of 0.296 when BTC was near $62,500 (June 2026). Price is higher now, so the risk score is likely higher too. Check the live value on Cowen's dashboard before you act.

WHEN IT MAY WORK
Long holding periods where you want to buy more in cheap areas and avoid buying hard near expensive ones.

WHEN IT MAY STRUGGLE
– Risk can stay low while price keeps falling, so you may buy early.
– You may skip buying for months and miss part of a rally.
– The score has only a few market cycles behind it.
– You need Cowen's dashboard to read the score, and the formula is not public.

TRY IT YOURSELF
Compare against plain weekly DCA on CG Backtest (BTC/USDT, a few years of data) to see how a fixed weekly buy behaves. You can then apply the 1x, 2x and 3x idea by hand using the risk values from Cowen's dashboard.

SOURCE
Benjamin Cowen, Into The Cryptoverse: "Bitcoin Dynamic DCA: How I Navigate Crypto" (video linked in this post). All credit for the method goes to him.

RISK
No backtest of my own is included here. This is not financial advice. Crypto is risky, so only use money you can afford to lose.

WATCH & LEARN

Strategy Video

Watch the creator explain this strategy in more detail.

A NOTE FROM THE CREATOR

Creator's Note

Sharing Benjamin Cowen's risk-based DCA idea for learning and discussion, with full credit to his Into The Cryptoverse video. His risk formula is not public, so I do not claim to recreate it. The 2014 to 2026 numbers are a hindsight example, not a promise. Please check the live risk value on his dashboard before using this.

See something misleading or inappropriate? Report this Strategy
Found this strategy useful? Share it with others or contribute your own.
Share Your Strategy
PUT YOUR STRATEGY TO THE TEST

Ready to Test This Strategy?

Don't rely on assumptions. Backtest your strategy against historical market data and see how it performs.

Backtest This Strategy