Bitcoin
 Ethereum
 Solana
 TRON
 Hyperliquid
 Zcash
 Dogecoin
 Monero
 Chainlink
 Cardano
 Stellar
 Uniswap
 Sui
 Hedera
 Shiba Inu
 Bittensor
 Ripple USD
 Aster
 Polkadot
 World Liberty Financial
 Render
 Artificial Superintelligence Alliance

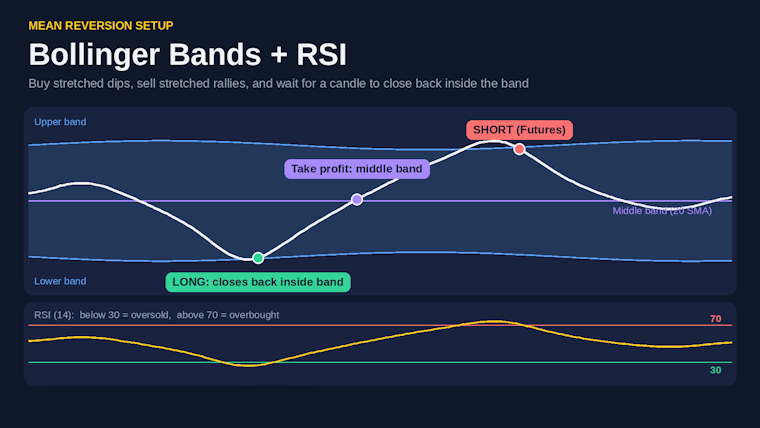
A simple mean reversion setup that uses two common indicators: Bollinger Bands to spot stretched price, and RSI to confirm that momentum is overbought or oversold. The idea is that price often returns toward its average after a stretch.
STEP 1: SET UP THE CHART
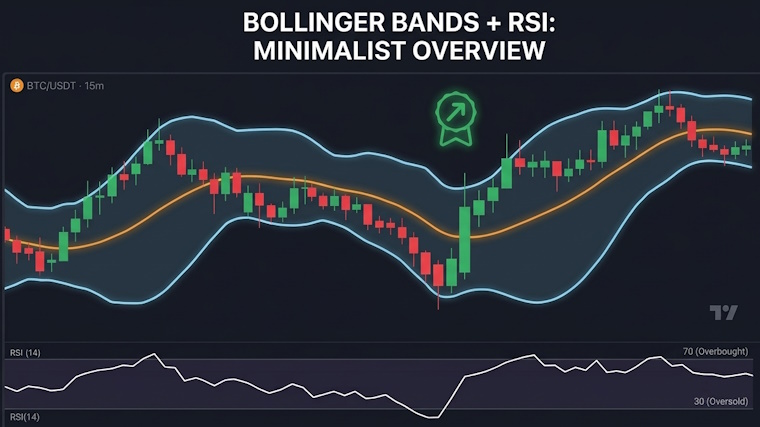
Open a chart (for example on TradingView) and add:
1. Bollinger Bands: length 20, standard deviation 2.
2. RSI: length 14, with levels at 30 (oversold) and 70 (overbought).
STEP 2: LONG (BUY) SETUP
– Price touches or slightly pierces the lower Bollinger Band.
– RSI is below 30.
– Do not enter on the touch alone. Wait for a candle to close back inside the lower band, then enter Long.
STEP 3: SHORT (SELL) SETUP, FUTURES ONLY
– Price touches or slightly pierces the upper Bollinger Band.
– RSI is above 70.
– Wait for a candle to close back inside the upper band, then enter Short.
STEP 4: EXIT AND STOP LOSS
– Stop loss: just beyond the recent swing low (Long) or swing high (Short), so normal noise does not stop you out.
– Take profit: the middle Bollinger Band (20 SMA).
– Optional: take half of the position at the middle band and aim for the opposite outer band with the rest.
WHEN IT WORKS BEST
Ranging markets, or markets with moderate moves where price keeps returning to its average.
WHEN TO AVOID IT
– Strong trends where price rides along the outer band without pulling back. The RSI can stay overbought or oversold for a long time.
– High-impact news, when indicators can give false signals.
– When you cannot place a clear stop loss.
HOW TO PRACTICE
Before using real money, go back on the chart, mark past signals that follow these exact rules, and note how many reached the middle band and how many hit the stop.
RISK
No backtest results are included in this post, so please test it before using real funds. Shorting and leverage on futures are risky. Always use a stop loss and a small position size. This is not financial advice. Only use money you can afford to lose.